Synthesis of azo carbonate monomers and biocompatibility study of poly(azo-carbonate-urethane)s†
R. M. Capitãoab,
R. D. E. Santoab,
A. Magalhãesc,
D. Assisd,
G. V. J. da Silva e,
C. B. Scarimf,
R. C. Cheluccif,
C. R. Andradeg,
M. C. Chungf and
E. R. P. González*a
aFaculdade de Ciências e Tecnologia, Universidade Estadual Paulista, Campus de Presidente Prudente, Departamento de Física, Química e Biologia, Laboratório de Química Orgânica Fina – C.P. 467, Presidente Prudente, 19060-900, SP, Brazil. E-mail: eperez@fct.unesp.br
bPrograma de Pós-Graduação em Ciência e Tecnologia de Materiais (POSMAT), Universidade Estadual Paulista, São Paulo, Brazil
cDepartamento de Química Inorgânica, Instituto de Química, Universidade de Campinas UNICAMP, Campinas, 13083-970, São Paulo, Brazil
dBruker do Brasil, Atibaia, 12954-260, SP, Brazil
eDepartamento de Química, Faculdade de Filosofia, Ciências e Letras de Ribeirão Preto, Universidade de São Paulo, Avenida dos Bandeirantes, 3900, 14040-901 Ribeirão Preto, SP, Brazil
fFaculdade de Ciências Farmacêuticas, Departamento de Fármacos e Medicamentos, Universidade Estadual Paulista, Campus de Araraquara, Brazil
gFaculdade de Odontologia, Departamento de Fisiologia e Patologia, Universidade Estadual Paulista, Campus de Araraquara, Brazil
First published on 29th July 2016
Abstract
The present work describes the synthesis of azo carbonate monomers by a clean carbonylation synthetic route using di-methylcarbonate. The kinetics study showed a conversion of ∼98% to bis-carbonates after only six minutes of reaction using triazabicyclo[4.4.0]dec-5-ene (TBD) as the catalyst. The preparation of azo-carbonates by means of coupling aryldiazonium salts with bis-carbonate was performed. The reactivity of azo-carbonate monomers was tested in the polycondensation reaction with an aminoalcohol using TBD as a catalyst for the formation of non-isocyanate poly(azo-carbonate-urethane)s PCU 1 and PCU 2. The copolymers’ structures were confirmed by FT-IR, NMR and MALDI experiments, which allow us to determine the different terminal groups of the polymer chains formed. The molecular weights and the molecular weight distribution of PCU 1 and PCU 2 were determined by size-exclusion chromatography (SEC) experiments and thermal stabilities were also studied by TG analysis. The biocompatible properties of monomers 4 and 6 and polymers PCU 1 and PCU 2 were investigated by liver, kidney and colon histological analyses.
1. Introduction
Azo aromatic compounds exhibit a versatility of applications in various fields, such as textile, pharmaceutical, cosmetic and food industries, advanced application in organic synthesis and high-tech products such as lasers, liquid crystal displays and electro-optics devices.1–4Azo-polymers are important because of their potential applications as optical and electronics materials.5 They are generally used in studies of optical memories, relief surfaces, liquid crystals, nonlinear optics, holographic memories, waveguide switches and other photonic devices.6–9
Polycarbonates are characterized by having excellent mechanical, optical and thermal properties and have a wide range of applications.10,11 Poly(alkyl)carbonate derivatives of aliphatic diols show potential use as biodegradable and biocompatible materials.12 Polyurethanes (PU) are an important class of thermoplastic and thermosetting polymers due to their mechanical, thermal and chemical properties, which can be set through the proper selection of a wide variety of raw materials.13 Current production of PU14 is based on highly toxic diisocyanates (such as MDI and TDI). However, in terms of green chemistry, today syntheses of polyurethanes free of isocyanate (NIPUs) are highly desirable.15
There has been considerable attention paid to polycarbonate urethanes (PCUs) for improvement of their mechanical, anti-hydrolyzation and anti-oxidation properties compared to the traditional polyurethanes.16 PCUs have excellent toughness, flexibility, durability, chemical- and bio-stability and are bio-compatible with human tissues, therefore they have been used or tested in modern medical applications,17 like implanted medical devices, heart valves, blood pumps, cardiovascular implants, in reconstructive surgery, tissue repair, etc.17
Carbonates are an important class of organic compounds used for a variety of industrial and synthetic applications.18 They have been used in polymer chemistry,19 agricultural products20 and biologic fields.21 A clean carbonylation synthetic route is proposed in the literature for the production of symmetrical and asymmetrical organic carbonates using dimethyl carbonate (DMC) in the presence of an organic catalyst.22
DMC has been used as a milder environmental alternative for methylation and carboxymethylation procedures compared to other agents traditionally used for this purpose, such as COCl2 (phosgene), CH3OC(O)Cl (methyl chloroformate), (CH3)2SO4 (dimethylsulfate) and methyl halide (MeX)22,23 methylation or transesterification reactions, depending on the experimental conditions. Transesterification products generally occur in reactions in which temperature is kept below 90 °C (ref. 24 and 25) and in general use or make use of basic homogeneous catalysts.
This work reveals the use of 1,5,7-triazabicyclo[4.4.0]dec-5-ene (TBD) and 1,8-diazabicyclo[5.4.0]undec-7-ene (DBU) as organic catalysts and have been successfully used as catalysts for transesterification reactions of DMC.26 The bis-carbonate was used for a coupling reaction generating azo carbonate monomers followed by a polycondensation reaction with an aminoalcohol for the formation of non-isocyanate poly(azo-carbonate-urethane)s. Finally, the biocompatibility properties of monomers 4 and 6 and polymers PCU 1 and PCU 2 were investigated by liver, kidney and colon histological analyses.
2. Results and discussion
2.1. Synthesis of intermediate bis-carbonate
In order to obtain a methodology to incorporate the arylazo groups into potential polymeric materials like poly(azo-carbonate-urethane)s, a two-step synthesis of azo carbonate monomers as carriers for arylazo groups was performed.In the first reaction step, a clean reaction was investigated by transesterification of N-phenyldiethanolamine with excess DMC to obtain the corresponding bis-carbonate compound 1 (Scheme 1) with high purity (NMR, EI-MS, FTIR and UV-Vis can be seen in the ESI†). This reaction was carried out without the use of organic solvents.
 | ||
| Scheme 1 Transesterification reaction of N-phenyldiethanolamine with excess DMC to obtain the corresponding bis-carbonate compound 1. | ||
A transesterification reaction of N-phenyldiethanolamine with DMC was performed using the catalysts DBU and TBD and the kinetics monitoring was performed by GC-MS analysis. Fig. 1 shows the GC-MS chromatograms of compound 1 using DBU (20% mol) at three different reaction times (1, 3 and 6 hours). The peaks observed in the chromatograms were attributed to the precursor N-phenyldiethanolamine, the mono-carbonate intermediate and bis-carbonate 1, respectively, from the corresponding mass spectra (see ESI†). The chromatogram at 6 hours (black line) showed ∼98% of conversion to bis-carbonate 1.
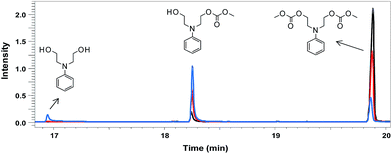 | ||
| Fig. 1 GC-MS analysis of the transesterification reaction mixture at three different reaction times (blue – 1 h; red – 3 h; black – 6 h). | ||
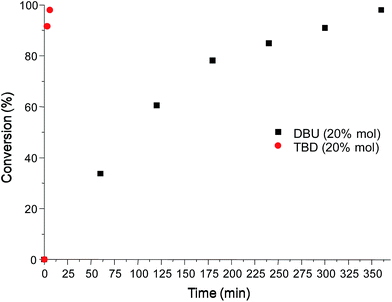
The reaction was also investigated using TBD as a catalyst in the same molar ratio used previously for DBU (20% mol) and the kinetics study showed a conversion of ∼98% to bis carbonate in only six minutes of reaction time (entry 1, Table 1), showing that TBD is a much more efficient catalyst for this reaction. Fig. 2 shows the time–conversion plot for both catalysts at 20% mol.
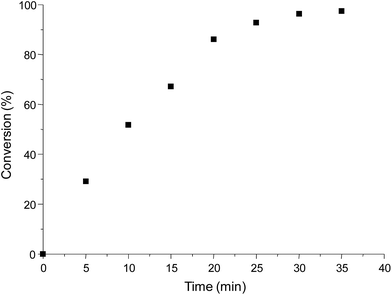
Given this result, other proportions of catalyst TBD were studied. Decreasing of TBD proportion to 10% mol showed the same result (∼98% of conversion in 6 minutes, entry 2, Table 1). In TBD proportions of 5% mol and 1% mol, the necessary time to obtain ∼98% of conversion were 15 and 35 minutes, respectively (entries 3 and 4 in Table 1), showing that for the same catalytic amounts, TBD is a more efficient catalyst that DBU at 20% mol. A time–conversion plot for the catalysis using 1% mol of TBD is shown in Fig. 3.
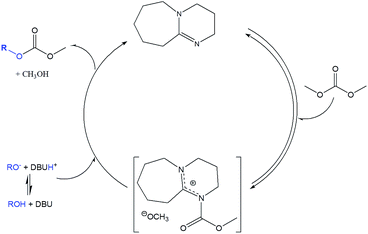 | ||
| Scheme 2 Reported mechanism for DBU catalyzed alcohol transesterification with DMC.32,34 | ||
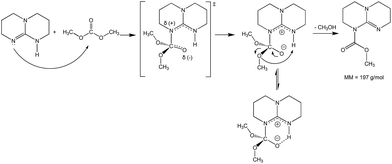
This reaction can be also catalyzed by bi-cyclic guanidines like TBD. In this case, a synergic process could be also present (Brønsted–Lewis catalysis). Kinetics studies have been reported to clarify the exact role of guanidine as a catalyst in Michael reactions.35 Use of TBD in methoxycarbonylation reactions with DMC was reported without a clear explanation of the TBD catalysis mechanism.26,34,36
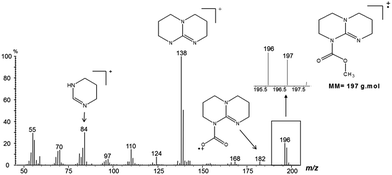
To investigate if TBD also acts as a nucleophilic catalyst, a direct reaction between DMC and TBD was carried out (Scheme 3). The reaction was followed by GC-MS analysis of aliquots of the reaction mixture. Observation of the molecular ion with m/z = 197 (Fig. 4) proved the formation of N-methoxycarbonyl–TBD as an intermediate product.
2.2. Synthesis of azo dye carbonates 2–8
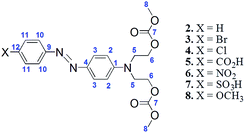
Compound 1 was used for a coupling reaction with aryldiazonium salts to form the respective azo dye carbonates 2–8 with good or moderate yields (Scheme 4). The low yield of some azo dye carbonates could be associated with the low reactivity of aryldiazonium salts toward bis-carbonate 1.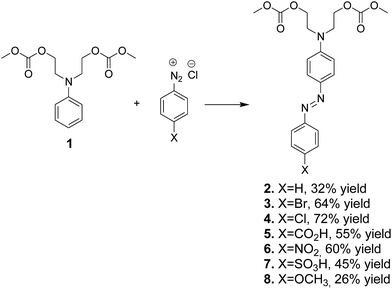 | ||
| Scheme 4 Synthesis of azo dye carbonates 2–8 by coupling of aryldiazonium salts with intermediate bis-carbonate 1. | ||
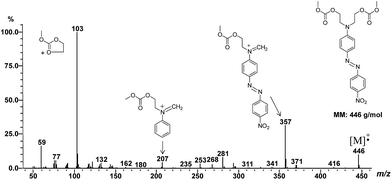
The reaction products were analyzed by direct introduction of the samples in the mass spectrometer apparatus using EI ionization mode (see in ESI†). Formation of azo dye carbonates was shown by observation of the respective molecular ions (except for compound 7) as exemplified in Fig. 5 (m/z 446 for molecular ion of compound 6).
Azo dye carbonates 2–8 were also unambiguously characterized by 1H NMR, 13C NMR, 1H–13C HSQC and 1H–13C HMBC (see ESI†). In 1H NMR spectra, the evidence for the formation of azo carbonates was the disappearance of a signal attributed to aromatic hydrogen H4, the observation of p-substituted aromatic signals for protons H10 and H11 and the change of chemical shift of hydrogen H3. 13C NMR experiments also confirm the formation of azo dye carbonates. The main evidence was the change of chemical shifts of C4 carbon from 117.3 ppm in compound 1 to ∼144 ppm in the azo dye carbonates. The presence of signals attributed to carbons C9, C10, C11 and C12 also confirmed the formation of the azo-coupling products. Tables 2 and 3 summarize the chemical shifts of compounds 1–8.
| Compound | X | H2 | H3 | H4 | H5 | H6 | H8 | H10 | H11 |
|---|---|---|---|---|---|---|---|---|---|
| 1 | — | 6.76 | 7.27 | 6.78 | 3.69 | 4.31 | 3.79 | — | — |
| 2 | 7.40 | 6.83 | 7.89 | — | 3.77 | 4.35 | 3.78 | 7.85 | 7.48 |
| 3 | — | 6.82 | 7.87 | — | 3.75 | 4.34 | 3.78 | 7.72 | 7.59 |
| 4 | — | 6.82 | 7.86 | — | 3.76 | 4.34 | 3.78 | 7.78 | 7.44 |
| 5 | — | 6.86 | 7.91 | — | 3.78 | 4.36 | 3.79 | 7.91 | 8.22 |
| 6 | — | 6.86 | 7.93 | — | 3.81 | 4.37 | 3.79 | 7.93 | 8.33 |
| 7 | — | 6.76 | 7.66 | — | 3.66 | 4.29 | 3.67 | 7.73 | 7.93 |
| 8 | 3.86 | 6.82 | 7.84 | — | 3.77 | 4.34 | 3.78 | 7.84 | 6.98 |
| Compound | X | C3 | C4 | C7 | C8 | C9 | C10 | C11 | C12 |
|---|---|---|---|---|---|---|---|---|---|
| 1 | — | 129.6 | 117.3 | 155.8 | 55.0 | — | — | — | — |
| 2 | — | 125.3 | 144.5 | 155.7 | 55.1 | 153.1 | 122.4 | 129.1 | 129.8 |
| 3 | — | 123.9 | 144.3 | 155.7 | 55.1 | 151.8 | 123.8 | 132.2 | 125.5 |
| 4 | — | 125.4 | 144.3 | 155.7 | 55.1 | 151.5 | 123.7 | 129.2 | 135.4 |
| 5 | 171.0 | 126.0 | 144.6 | 155.8 | 55.2 | 150.3 | 122.4 | 131.4 | 129.7 |
| 6 | — | 126.4 | 144.6 | 155.8 | 55.2 | 156.6 | 124.8 | 122.9 | 147.8 |
| 7 | — | 125.4 | 143.0 | 155.9 | 55.1 | 153.6 | 126.6 | 122.1 | 143.4 |
| 8 | 55.6 | 124.8 | 144.5 | 155.7 | 55.1 | 147.4 | 124.1 | 114.2 | 161.2 |
The UV-Vis study of azo-dyes carbonates 2–8 was conducted in DMSO solution. The absorption spectra showed two main absorption bands in the 415–485 and 266––270 nm regions attributed to π → π* and n → π* transitions, respectively (Fig. 6). The transition π → π* is more sensitive to the electronic effects of the p-substituent group. Considering compound 2 as a model (X = H), the highest red-shift (λmax = 485 nm) was observed for a strong electron-withdrawing group as a p-substituent (compound 6, X = NO2) and the smaller red-shift (λmax = 415 nm) was observed for an electron-donating group (X = OCH3).
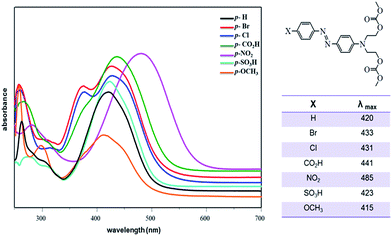 | ||
| Fig. 6 UV-Vis spectra of compounds 2–8 in DMSO (individual spectra can be seen in the ESI†). | ||
These results agree with those expected. The UV-Vis absorption bands of azo compounds depend on the combination of electron-donating and electron-withdrawing moieties in their structures.37,38 If an electron-donating group is present, intense absorption bands arise, associated with the transfer of electron density from the donor group into the rest of the chromogen. The absorption wavelength can be increased by attaching electron-withdrawing groups to the second phenyl ring.39
2.3. Synthesis of azo polymers
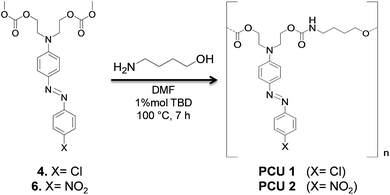
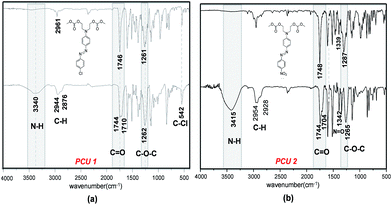
Formation of poly(azo-carbonate-urethane)s from azo dye carbonates was investigated for compounds 4 and 6 (Scheme 5). The choice of the azo-carbonate 4 was due to the presence of a chlorine isotopic pattern useful for mass spectrometric analyses of the resulting polymer. In the case of compound 6, the choice was due to the higher red-shift observed in UV-Vis spectrum of this molecule.FTIR spectroscopy was used to characterize the new carbonate and urethane groups formed by polycondensation. Fig. 7 shows the FT-IR spectra of poly(azo-carbonate-urethane) PCU 1 and PCU 2 (spectrum (a) and (b), respectively). Appearance of bands at 3400 and 1540 cm−1 indicate the presence of urethane NH groups. The band observed at 1710–1704 cm−1 is related to the axial deformation of the carbonyl group (C![[double bond, length as m-dash]](https://www.rsc.org/images/entities/char_e001.gif) O) of the urethane bond in the polymer. Also absorption bands were observed at 1744 cm−1 associated to axial deformation of carbonyl (C
O) of the urethane bond in the polymer. Also absorption bands were observed at 1744 cm−1 associated to axial deformation of carbonyl (C![[double bond, length as m-dash]](https://www.rsc.org/images/entities/char_e001.gif) O) and ∼1263 cm−1 attributed to the stretch of the ester group (C–O–C) in the carbonate bond in the polymer structure.26,40 Asymmetric and symmetric stretching of the methylenic groups (CH2) were observed between 2876 and 2954 cm−1, respectively. Furthermore, for PCU 1 a band was observed at 542 cm−1 attributed to the relative stretching of C–Cl and PCU 2 shows a band associated with a nitro group (N–O) at 1342 cm−1.
O) and ∼1263 cm−1 attributed to the stretch of the ester group (C–O–C) in the carbonate bond in the polymer structure.26,40 Asymmetric and symmetric stretching of the methylenic groups (CH2) were observed between 2876 and 2954 cm−1, respectively. Furthermore, for PCU 1 a band was observed at 542 cm−1 attributed to the relative stretching of C–Cl and PCU 2 shows a band associated with a nitro group (N–O) at 1342 cm−1.
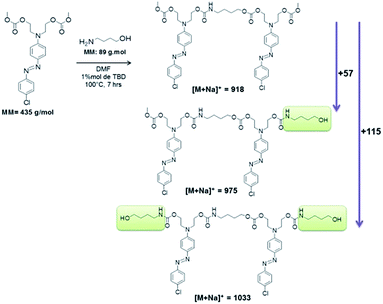
Fig. 8 shows the MALDI-TOF spectrum and the structures of each oligomer series with respective mass values for PCU 1 (X = Cl). Three mass series ( ,
,  and
and  ) with intervals of 460 Da corresponding to the repetition of co-monomer were observed. Each mass series corresponds to different end groups. Series
  was associated to oligomers with two terminal methyl carbonates, series
  was attributed to oligomers ended by both methyl carbonate and hydroxyl group, and series
  was associated to oligomers with two terminal hydroxyl groups.
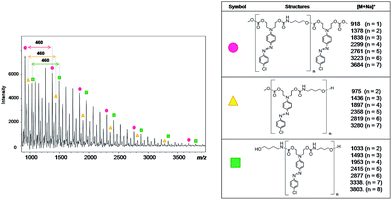 | ||
| Fig. 8 Mass spectrum obtained using MALDI-TOF of PCU 1 and structures and the values found in the MALDI mass spectrum of the reaction products formed for each polymer. | ||
Hence, the difference of m/z 57 between series  (n = 1) and
  (n = 2) refers to a 4-aminobutanol moiety (MW = 89 g mol−1 of 4-aminobutanol minus 32 of exiting methanol). Similarly, the difference of m/z 115 between series
  and
and  corresponds to two 4-aminobutanol groups (Fig. 9).
The same reaction conditions (DMF, 1% of TBD and 7 h) were used for azo-carbonate 6 (X = NO2) generating PCU 2. Fig. 10 shows the MALDI-TOF spectrum and the structures of each oligomer series with respective mass values for PCU 2. Also three mass series were observed, in this case with intervals of 471 Da, corresponding to a repeating unit mass of co-monomer (n). The same pattern of end groups in the oligomers discussed above for PCU 1 was observed for PCU 2.
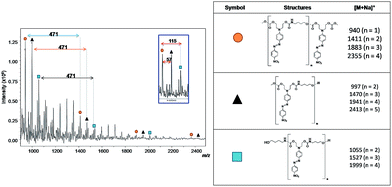 | ||
| Fig. 10 Mass spectrum obtained using MALDI-TOF of PCU 2 and structures and the values found in the MALDI mass spectrum of the reaction products formed for each polymer. | ||
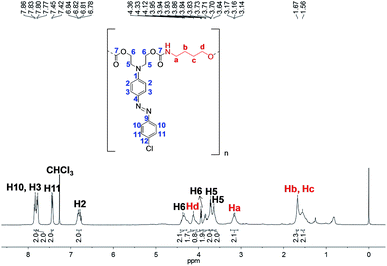
Fig. 11 shows a 1H NMR spectrum of PCU 1. The 1H NMR spectrum proves the formation of the polymer by the appearance of signals relating to methylene hydrogens from the spacer. Signals at 1.56 and 1.67 ppm corresponding to Hc and Hb, respectively, as well as the signals at 3.16 and 4.12 ppm corresponding to Ha and Hd, respectively, are consistent with similar molecules found in the literature.41 The duplicate signals for hydrogens H5 and H6 are probably due to the different chemical environment for these hydrogens (neighbors to carbonate and carbamate groups) or due to the presence of different end groups as observed in the MALDI-TOF experiments.
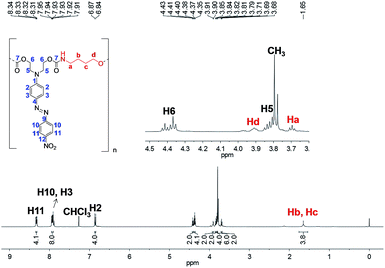
The 1H NMR spectrum of PCU 2 (Fig. 12) also showed the signals Ha–Hd corresponding to methylenic hydrogens of the spacer. However, a methyl signal at 3.79 ppm was observed indicating, as had been observed in the MALDI experiments, that PCU 2 did not grow as much as PCU 1. The integration of the methyl signal is six, indicating two methyl groups, and the integration of each aromatic hydrogen is four, indicating two azo groups in the structure, and therefore the main product in PCU 2 must be the oligomer with n = 1 of the  series of m/z 940 (Fig. 10).
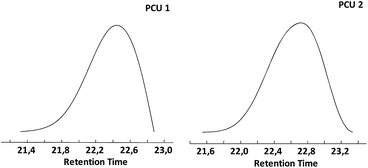
Size-exclusion chromatograms of PCU 1 and PCU 2 (Fig. 13) showed a single peak with a retention time between 21.4 and 22.9 min for PCU 1 with a maximum at 22.4 min and retention time between 21.6 and 23.4 min for PCU 2 with a maximum at 22.7 min.
The mean polymer masses were computed by the SEC software and PCU 1 showed a mean number average molecular weight Mn = 2280, and mean weight average molecular weight Mw = 2864 with a polydispersity index Mw/Mn = 1.26. Mean polymer masses computed by the SEC software for PCU 2 were Mn = 1372 and Mw = 1773 with a polydispersity index Mw/Mn = 1.29. Table 4 shows Mn, Mw and Mw/Mn values found for PCU 1 and PCU 2. The Mn values found agree with the MALDI and 1H NMR experiments: PCU 1 is a larger oligomer than PCU 2. Moreover, the polydispersity index found at 1.26 and 1.29 for PCU 1 and PCU 2, respectively, shows a good molecular weight distribution.
| Compound | Mn | Mw | Mw/Mn |
|---|---|---|---|
| PCU 1 | 2280 | 2864 | 1.26 |
| PCU 2 | 1372 | 1773 | 1.29 |
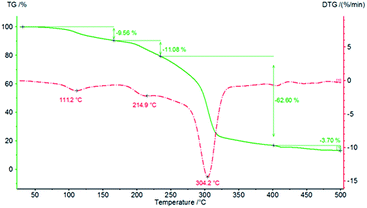
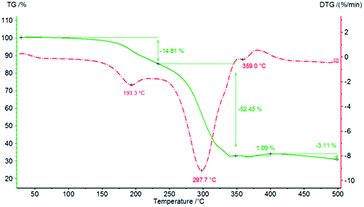
Finally, thermal analyses of PCU 1 and PCU 2 (Fig. 14 and 15, respectively) were performed to investigate the thermal stability of the PCUs. The maximal temperature of the first thermal decomposition observed was at 111.2 °C for PCU 1 with a 9.56% weight loss and 193.3 °C for PCU 2 with a 14.81% weight loss. The main thermal decomposition was observed with a maximal temperature at 304.2 °C for PCU 1 (62.60% weight loss) and at 297.7 °C for PCU 2 (52.45% weight loss).
2.4. Biocompatibility properties
After 24 hours of oral administration the negative control group demonstrated the rare presence of micro-abscesses in the liver lobules and this result was similar for PCU 1, PCU 2, 4 and 6 groups. After 72 hours the PCU 1 group maintained a similar result to the negative control and PCU 2, 4 and 6 showed a significant increase of liver lobule micro-abscess scoring. Finally, after 14 days of administration we identify a significant reduction of inflammatory micro-abscess in the liver lobules. Only group 4maintains the common presence of lobular micro-abscesses (Fig. 16). The other liver histopathology analysis didn’t show any statistical difference to the presence of necrosis, vascular alteration (congestion) or hepatic lipidosis.
The colon analysis demonstrated a similar histopathology scoring to the analysis of the mucosa and submucosa, smooth muscle layer and the region of GALT. However, after 72 hours of administration, 6 and PCU 2 demonstrated significant statistical difference to GALT scoring with an increase of GALT disorganization (Fig. 17).
For the kidney scoring the following parameters were analyzed: glomerular filtration space, proximal and distal ducts, vascular alterations and inflammatory infiltrates. All groups and periods (24 h, 72 h and 14 days) demonstrated similar conditions with no statistical difference.
Our results demonstrated the absence of histopathological toxicity to the colon and kidney in all groups and periods. After 72 hours of oral administration of 4, 6, and PCU 2 and after 14 days of oral administration of 4 the liver showed an increase in lobule micro-abscess scoring. The PCU 1 demonstrated a similar result to the negative control and it was the most compatible compound.
3. Experimental section
3.1. Materials
Commercial sodium nitrite, hydrochloric acid, 4-nitroaniline, 4-bromoaniline, 4-chloroaniline, 4-aminobenzene sulfonic acid, 4-aminobenzoic acid, 4-methoxyaniline, aniline, N-phenyldiethanolamine, dimethyl carbonate (DMC), 1,8-diazabicyclo[5.4.0]undec-7-ene (DBU), 1,5,7-triazabicyclo[4.4.0]dec-5-ene (TBD) and ethanol 99% were obtained from Sigma Aldrich and used without previous purification.3.2. Measurements
1H and 13C NMR spectra were obtained at 400.13 and 100.61 MHz, respectively. Chemical shifts for 1H NMR and 13C NMR were referenced to TMS; all NMR peaks were reported in ppm and observed at 25 °C. NMR data are shown as: chemical shift, multiplicity (s = singlet, d = doublet, dd = doublet of doublet, t = triplet, qua = quadruplet, qu = quintuplet, m = multiplet, br s = broad singlet), integration, and coupling constants (in hertz). GC-MS spectra were obtained using a Shimadzu QP-2010 plus. The column used was coated with 5% diphenyl–95% dimethyl polysiloxane and the carrier gas used was helium. The protocol used for analysis was: injection temp.: 200 °C; initial column temp.: 50 °C; hold time: 6 min; heating rate: 15 °C min−1; final temp.: 230 °C; hold time: 15 min; flow control mode: linear velocity; pressure: 80.1 kPa; total flow: 18.1 mL min−1; column flow: 1.37 mL min−1; interface temp.: 250 °C; ion source temp.: 300 °C; solvent peaks was cut off after 4 min; start time: 4.5 min; end time: 45 min. EI-MS spectra were obtained by direct insertion in the mass spectrometer, GC-MS Shimadzu QP-2010 plus. The protocol used for analysis was: interface temp.: 240 °C; ion source temp.: 300 °C; solvent cut time: 0.25 min; start time: 0.30 min; end time: 25.0 min; DI temperature program: initial temp.: 50 °C, heating hate of 20 °C min−1 until 350 °C, and hold time of 10 min. Analyses were carried out using chloroform and acetonitrile as solvents. FTIR measurements were performed on a Bruker FT-IR spectrometer, model Vector 22, and the spectra were collected at 23 °C accumulating 124 scans obtained at 4 cm−1 spectral resolution in KBr/sample mixed pellets. All melting points (mp) were obtained using a Quimis Q-340 M apparatus. The UV-Vis spectra were recorded in dimethyl sulfoxide (DMSO) solutions carefully conditioned on quartz cells using a Perkin-Elmer Lambda 25 spectrometer within the wavelength setup range of 200–700 nm. Mass measurements were carried out using a Bruker Microflex LT MALDI-TOF mass spectrometer, equipped with a 337 nm nitrogen laser at a pulse rate of 60 Hz. The polymer samples were dissolved in tetrahydrofuran (THF) at 10 mg mL−1 concentration. The used matrix was dithranol with 15 mg mL−1 concentration of cationising agent and sodium iodide (NaI) and silver trifluoroacetate (AgTFA) dissolved in methanol (10 mg mL−1). The final ratio of the cationic matrix was 1![[thin space (1/6-em)]](https://www.rsc.org/images/entities/char_2009.gif) :
:![[thin space (1/6-em)]](https://www.rsc.org/images/entities/char_2009.gif) 10
10![[thin space (1/6-em)]](https://www.rsc.org/images/entities/char_2009.gif) :
:![[thin space (1/6-em)]](https://www.rsc.org/images/entities/char_2009.gif) 1 where 1 μL of this mixture was deposited in the MALDI plate. Mass spectra were obtained in linear, positive-ion mode and the parameters for the analysis were as follows: pulsed-ion extraction delay of 150 ns, ions source voltage one (20.0 kV), ion source voltage two (17 kV) and ion source lens voltage (7.0 kV). The spectra were acquired by accumulating 500 laser shots between 20% and 50% laser power in the range of 800 to 4000 m/z. The molecular weights and the molecular weight distribution of the polymers were determined by gel permeation chromatography using a Shimadzu Prominence LC system equipped with a LC-20AD pump, a DGU-20A5 degasser, a CBM-20A communication module, a CTO-20A oven at 40 °C and a RID-10A detector equipped with two Shimadzu columns (GPC-805: 30 cm, ∅ = 8.0 mm). The retention time was calibrated with standard monodispersed polystyrene using HPLC-grade THF as eluent at 40 °C with a flow rate of 1.0 mL min−1. TG measurements were carried out with a Netzsch TG 209. The samples (∼5 mg) were placed into aluminum pans and heated at 10° min−1 under a dynamic nitrogen atmosphere at a flow rate of 25 mL min−1 from room temperature to 500 °C.
1 where 1 μL of this mixture was deposited in the MALDI plate. Mass spectra were obtained in linear, positive-ion mode and the parameters for the analysis were as follows: pulsed-ion extraction delay of 150 ns, ions source voltage one (20.0 kV), ion source voltage two (17 kV) and ion source lens voltage (7.0 kV). The spectra were acquired by accumulating 500 laser shots between 20% and 50% laser power in the range of 800 to 4000 m/z. The molecular weights and the molecular weight distribution of the polymers were determined by gel permeation chromatography using a Shimadzu Prominence LC system equipped with a LC-20AD pump, a DGU-20A5 degasser, a CBM-20A communication module, a CTO-20A oven at 40 °C and a RID-10A detector equipped with two Shimadzu columns (GPC-805: 30 cm, ∅ = 8.0 mm). The retention time was calibrated with standard monodispersed polystyrene using HPLC-grade THF as eluent at 40 °C with a flow rate of 1.0 mL min−1. TG measurements were carried out with a Netzsch TG 209. The samples (∼5 mg) were placed into aluminum pans and heated at 10° min−1 under a dynamic nitrogen atmosphere at a flow rate of 25 mL min−1 from room temperature to 500 °C.
3.3. Synthesis
2,2′-(Phenylimino)bis-ethyl-methyl-carbonate (1). White solid (0.27 g, 90%); FTIR (KBr) νmax/cm−1 748, 962, 1257, 1440, 1507, 1600, 1744, 2884, 1H NMR (400.13 MHz, CDCl3) δ 7.28–7.24 (m, 2H), 6.79–6.75 (m, 3H), 4.31 (t, J = 6.3 Hz, 4H), 3.79 (s, 6H) and 3.69 (t, J = 6.4 Hz, 4H); 13C NMR (100.61 MHz, CDCl3) δ 155.7, 146.9, 129.6, 117.3, 112.1, 64.8, 54.9, 49.9; GC-MS m/z (%): 103 (100), 208 (34), 77 (22), 132 (20), 59 (18), 91 (12), 297 (8).
Synthesis of aryldiazonium salt. 1 mmol of p-substituted aniline was poured into a minimal amount of water and 0.33 mL of 37% HCl solution. Then, the mixture was heated until complete dissolution. Afterward the solution was cooled, until the temperature reached a value between 0 and 5 °C. Then, the reaction mixture was slowly added with stirring to a cold solution of 1 mmol (0.07 g) of sodium nitrite dissolved in 0.5 mL of water to form a diazonium salt.
Synthesis of azo carbonates. Compound 1 was dissolved in a minimal acetonitrile volume (ethanol was used for compound 7) and the resulting solution was slowly added under stirring to the aryldiazonium salt. The temperature was kept between 0 and 5 °C. The solid products (except compounds 2 and 8) were filtered off under reduced pressure and washed with cold ethanol to yield azo dye carbonates 2–8.
2,2′-[[4-[(Phenyl)azo]phenyl]imino]bis-ethyl-methyl-carbonate (2). Brown oil (0.13 g, 32%): FTIR (KBr) νmax/cm−1 967, 1275, 1513, 1602, 1739, 2885; 1H NMR (400.13 MHz, CDCl3) δ 7.87 (dd, J = 9.0, 7.8 Hz, 4H), 7.48 (t, J = 7.6 Hz, 2H), 7.40 (t, J = 7.3 Hz, 1H), 6.83 (d, J = 9.1 Hz, 2H), 4.35 (t, J = 6.1 Hz, 4H), 3.78 (s, 6H), 3.77 (m, 4H); 13C NMR (100.61 MHz, CDCl3) δ 155.7, 153.1, 149.5, 144.5, 129.8, 129.1, 125.3, 122.4, 111.7, 64.7, 55.1, 50.0; EI-MS m/z (%): 103 (100), 312 (39), 401 (17), 77 (14), 207 (9), 236 (7).
2,2′-[[4-[(4-Bromophenyl)azo]phenyl]imino]bis-ethyl-methyl-carbonate (3). Beige solid (0.31 g, 64%): mp = 131–134 °C; FTIR (KBr) νmax/cm−1 750, 833, 1261, 1505, 1598, 1748, 2960; 1H NMR (400.13 MHz, CDCl3) δ 7.87 (d, J = 9.1 Hz, 2H), 7.72 (d, J = 8.7 Hz, 2H), 7.59 (d, J = 8.6 Hz, 2H), 6.82 (d, J = 9.1 Hz, 2H), 4.34 (t, J = 6.1 Hz, 4H), 3.78 (s, 6H), 3.76 (d, J = 6.3 Hz, 4H); 13C NMR (100.61 MHz, CDCl3) δ 155.7, 151.8, 149.8, 144.3, 132.2, 125.5, 123.9, 123.8, 111.8, 64.6, 55.1, 50.0; EI-MS m/z (%): 103 (100), 59 (12), 392 (11), 390 (11), 156 (5), 77 (5), 481 (4), 479 (4).
2,2′-[[4-[(4-Chlorophenyl)azo]phenyl]imino]bis-ethyl-methyl-carbonate (4). Beige solid (0.31 g, 72%): mp = 113–116 °C; FTIR (KBr) νmax/cm−1 788, 833, 1261, 1505, 1598, 1748, 2960; 1H NMR (400.13 MHz, CDCl3) δ 7.86 (d, J = 9.1 Hz, 2H), 7.79 (d, J = 8.7 Hz, 2H), 7.43 (d, J = 8.6 Hz, 2H), 6.82 (d, J = 9.1 Hz, 2H), 4.34 (t, J = 6.1 Hz, 4H), 3.78 (s, 6H), 3.77–3.74 (m, 4H); 13C NMR (100.61 MHz, CDCl3) δ 155.7, 151.5, 149.7, 144.3, 135.4, 129.2, 125.4, 123.7, 111.7, 64.6, 55.1, 50.0; EI-MS m/z (%): 103 (100), 346 (26), 435 (10), 270 (6), 207 (4), 77 (3).
2,2′-[[4-[(4-Benzoic acid)azo]phenyl]imino]bis-ethyl-methyl-carbonate (5). Orange solid (0.24 g, 55%): mp = 184–187 °C; FTIR (KBr) νmax/cm−1 790, 1264, 1515, 1605, 1677, 1748, 2963, 3300; 1H NMR (400.13 MHz, CDCl3) δ 8.22 (dd, J = 8.7, 2.1 Hz, 2H), 7.93–7.89 (m, J = 9.0, 8.4 Hz, 4H), 6.85 (dd, J = 9.3, 2.3 Hz, 2H), 4.36 (t, J = 6.1 Hz, 4H), 3.79 (s, 6H), 3.78 (s, 4H); 13C NMR (100.61 MHz, CDCl3) δ 171.0, 156.5, 155.8, 150.3, 147.6, 144.6, 131.4, 126.0, 122.4, 111.8, 64.7, 55.2, 50.1; EI-MS m/z (%): 103 (100), 356 (18), 162 (16), 77 (14), 311 (8), 280 (7).
2,2′-[[4-[(4-Nitrophenyl)azo]phenyl]imino]bis-ethyl-methyl-carbonate (6). Red solid (0.27 g, 60%): mp = 110–112 °C; FTIR (KBr) νmax/cm−1 856, 1293, 1505, 1602, 1748, 2969 cm−1; 1H NMR (400.13 MHz, CDCl3) δ 8.33 (d, J = 8.9 Hz, 2H), 7.93 (dd, J = 8.9, 9.1 Hz, 4H), 6.86 (d, J = 9.2 Hz, 2H), 4.37 (t, J = 6.1 Hz, 4H), 3.81 (d, J = 6.1 Hz, 4H), 3.79 (s, 6H); 13C NMR (100.61 MHz, CDCl3) δ 156.6, 155.8, 150.8, 147.8, 144.6, 126.4, 124.8, 122.9, 111.9, 64.6, 55.2, 50.1; EI-MS m/z (%): 103 (100), 357 (32), 59 (17), 446 (11), 281 (8), 77 (6).
2,2′-[[4-[(4-Benzenesulfonic acid)azo]phenyl]imino]bis-ethyl-methyl-carbonate (7). Brown solid (0.22 g, 45%); mp = >300 °C; FTIR (KBr) νmax/cm−1 850, 1039, 1176, 1597, 1751, 3454; 1H NMR (400.13 MHz, D2O) δ 7.92 (d, J = 8.7 Hz, 2H), 7.73 (d, J = 8.6 Hz, 2H), 7.66 (d, J = 9.0 Hz, 2H), 6.76 (d, J = 8.9 Hz, 2H), 4.29 (t, J = 5.3 Hz, 4H), 3.68–3.64 (m, 10H); 13C NMR (100.61 MHz, D2O) δ 155.9, 153.6, 150.6, 143.4, 143.0, 126.6, 125.4, 122.1, 111.6, 65.0, 55.1 and 48.9.
2,2′-[[4-[(4-Methoxyphenyl)azo]phenyl]imino]bis-ethyl-methyl-carbonate (8). Brown oil (0.11 g, 26%): FTIR (KBr) νmax/cm−1 836, 1210, 1269, 1507, 1596, 1745, 2891; 1H NMR (400.13 MHz, CDCl3) δ 7.84 (dd, J = 9.0, 9.2 Hz, 4H), 6.98 (d, J = 9.0 Hz, 2H), 6.82 (d, J = 9.2 Hz, 2H), 4.34 (t, J = 6.1 Hz, 4H), 3.86 (s, 3H), 3.78–3.76 (m, 10H); 13C NMR (100.61 MHz, CDCl3) δ 161.2, 155.7, 149.0, 147.4, 144.5, 124.8, 124.1, 114.2, 111.7, 64.7, 55.6, 55.1, 50.0; EI-MS m/z (%): 103 (100), 342 (30), 431 (17), 77 (10), 135 (7), 266 (6).
PCU 1. Beige solid (0.31 g, 67%); FTIR (KBr) νmax/cm−1 542, 788, 833, 1007, 1087, 1138, 1261, 1357, 1387, 1511, 1598, 1710, 1744, 2876, 2944, 3344; 1H NMR (400.13 MHz, CDCl3) δ 7.86 (d, J = 9.1 Hz, 2H), 7.79 (d, J = 8.7 Hz, 2H), 7.43 (d, J = 8.6 Hz, 2H), 6.82 (d, J = 9.1 Hz, 2H), 4.34 (t, J = 6.1 Hz, 4H), 3.78 (s, 6H), 3.77–3.74 (m, 4H); 13C NMR (100.61 MHz, CDCl3) δ 155.0, 151.3, 135.4, 129.2, 125.3, 123.5, 123.4, 111.9, 60.6, 60.0, 55.3, 51.0, 40.7, 29.7, 26.4, 25.8.
PCU 2. Red solid (0.34 g, 73%); FTIR (KBr) νmax/cm−1 537, 684, 829, 859, 1038, 1107, 1146, 1265, 1342, 1391, 1519, 1602, 1704, 1744, 2828, 2954; 1H NMR (400.13 MHz, CDCl3) δ 8.33 (d, J = 8.9 Hz, 2H), 7.93 (dd, J = 8.9, 9.1 Hz, 4H), 6.86 (d, J = 9.2 Hz, 2H), 4.37 (t, J = 6.1 Hz, 4H), 3.81 (d, J = 6.1 Hz, 4H) and 3.79 (s, 6H); 13C NMR (100.61 MHz, CDCl3) δ 157.3, 156.6, 151.5, 147.6, 144.2, 126.2, 124.8, 122.8, 111.9, 64.8, 50.6, 40.6, 29.7, 26.5 and 26.0.
3.4. Study design
The in vivo experiment had 15 groups of six animals. Body weights were determined prior to dosing and the dose was calculated based on body weight. The experimental groups were: polymers and monomers: PCU 1, PCU 2, 4 and 6 (50 mg kg−1 – orally); physiological solution (0.9% NaCl) with three distinct periods of analysis after administration (24 h, 72 h and 14 days). The sacrifices were realized by CO2 chamber. Tissues were immediately extracted and fixed in formalin buffer (10%) for further processing and analysis.42–46
4. Conclusions
A DMC transesterification reaction with N-phenyldiethanolamine to obtain bis-carbonate monomers was performed using DBU and TBD as catalysts. The TBD shows better catalytic activity with conversion to the bis-carbonate in lower molar ratios and shorter reaction times. Azo-carbonate monomers were obtained with yields from good to moderate. The poly(azo-carbonate-urethane)s were prepared by co-polymerization of azo-carbonates with 4-aminobutanol. The FTIR and NMR analysis confirm the formation of the copolymers, MALDI analysis allows the determination of the different terminal groups of oligomers, SEC experiments allows the determination of the molecular weights and their distribution. Thermal stability of materials was studied by TG analysis. The biocompatibility study showed the absence of histopathological toxicity to the colon and kidney in all groups and periods. In the liver, an increase of lobule micro-abscesses was observed in some analyzed groups and periods. The PCU 1 demonstrated similar results to the negative control.Acknowledgements
The authors would like to thank the Brazilian Research Foundations FAPESP (2013/24487-6), CNPq and CAPES for research fellowships and financial assistance. We are also grateful to the post-graduation programs of the São Paulo State University (Unesp), Science and Technology of Materials (POSMAT) and Pharmaceutical Sciences of the Faculty of Pharmacy at Araraquara, for scientific support. We are also grateful to the Professor Mario Sergio Palma of the Biosciences Institute at Unesp of Rio Claro by ESI and MALDI experiments and useful discussion of the results, to the Professors Valdemiro Pereira de Carvalho Júnior and Beatriz Eleuterio Gois and their post-graduation student Yan Fraga who performed the SEC analyses. Authors are also grateful to Professor Deuber Lincon da Silva Agostini for TG experiments.Notes and references
- H. Zollinger, Dyes and Pigments, VCH publishers, New York, 1987 Search PubMed.
- A. T. Peter and H. S. Freeman, Colour Chemistry. The Design Dyes and Pigments, Elsevier Appl. Sci. Publ, 1991 Search PubMed.
- P. Gregory, High-Technology applications of organic colorants, Plenum Press, New York, London, 1991 Search PubMed.
- C. T. Kuo, S. Y. Huang, M. S. Kuo and D. J. Jang, J. Appl. Phys., 2005, 44, 3111–3114 CrossRef CAS.
- S. L. Lim, N. Li, J. Lu, Q. Ling, C. X. Zhu, E. Kang and K. G. Neoh, ACS Appl. Mater. Interfaces, 2009, 1, 60–71 CAS.
- M. J. Lee, D. H. Jung and Y. K. Han, Mol. Cryst. Liq. Cryst., 2006, 444, 41–50 CrossRef CAS.
- S. K. Yesodha, C. K. S. Pillai and N. Tsutsumi, Prog. Polym. Sci., 2004, 29, 45–74 CrossRef CAS.
- N. K. Viswanathan, D. Y. Kim, S. Bian, J. Williams, W. Liu, L. Li, L. Samuelson, J. Kumar and S. K. Tripathy, J. Mater. Chem., 1999, 9, 1941–1955 RSC.
- R. Hagen and T. Bieringer, Adv. Mater., 2001, 13, 1805–1810 CrossRef CAS.
- Polycarbonates, in Encyclopedia of Polymer Science and Technology, Ed. D. J. Brunelle, John Wiley & Sons, Inc., 2004, vol. 7, pp. 397–426 Search PubMed.
- D. Clagett and S. Shafer, Polycarbonates, in Conprehensive Polymer Science, Pregman Press, 1989, vol. 5, pp. 345–356 Search PubMed.
- J. Pokharkar and S. Sivaram, Polymer, 1995, 36, 4851–4854 CrossRef.
- C. R. Kumar and J. Karger-Kocsis, Eur. Polym. J., 2002, 38, 2231 CrossRef CAS.
- D. Randall and S. Lee, The Polyurethanes Book, Wiley, New York, 2000 Search PubMed.
- W. C. Pan, C. H. Lin and S. A. Dai, J. Polym. Sci., Part A: Polym. Chem., 2014, 52, 2781–2790 CrossRef CAS.
- J. Guo, M. Zhao, Y. Ti and B. Wang, J. Mater. Sci., 2007, 42, 5508–5515 CrossRef CAS.
- M. Špírková, J. Pavličevićc and A. Strachota, Eur. Polym. J., 2011, 47, 959–972 CrossRef.
- A. G. Shaikh and S. Sivaram, Chem. Rev., 1996, 96, 951–976 CrossRef CAS PubMed.
- V. Pokharkar and S. Sivaram, Polymer, 1995, 36, 4851–4854 CrossRef CAS.
- J. B. Adams, PCT Int. Appl. WO 04318, 1992.
- C. Ghiron, T. Rossi and R. J. Thomas, Tetrahedron Lett., 1997, 38, 3569–3572 CrossRef CAS.
- P. Tundo and M. Selva, Acc. Chem. Res., 2002, 35, 706–716 CrossRef CAS PubMed.
- V. V. Rekha, M. V. Ramani, A. Ratnamala, V. Rupakalpana, G. V. Subbaraju, C. Satyanarayana and C. S. Rao, Org. Process Res. Dev., 2009, 13, 769–773 CrossRef CAS.
- U. Tilstam, Org. Process Res. Dev., 2012, 16, 1150–1153 CrossRef CAS.
- E. Quaranta, M. Carafa and F. Trani, Appl. Catal., B, 2009, 91, 380–388 CrossRef CAS.
- M. R. Islam, Y. M. Kurle, J. L. Gossage and T. J. Benson, Energy Fuels, 2013, 27, 1564–1569 CrossRef CAS.
- J. E. Taylor, S. D. Bull and J. M. J. Williams, Chem. Soc. Rev., 2012, 41, 2109–2121 RSC.
- M. Baidya and H. Mayr, Chem. Commun., 2008, 1792–1794 RSC.
- T. Ishikawa and T. Kumamoto. Superbases for Organic Synthesis: Guanidines, Amidines, Phosphazenes and Related Organocatalysts, John Wiley & Sons, Chichester, 2009 Search PubMed.
- E. R. P. González, M. O. Silva, V. C. Costa, U. P. Rodrigues-Filho and D. W. Franco, Tetrahedron Lett., 2002, 43, 4091–4093 CrossRef.
- E. R. P. González, R. H. A. Santos, T. P. Maria, M. T. P. Gambardella, L. G. M. Macedo, U. P. Rodrigues-Filho, J.-C. Launay and D. W. Franco, J. Org. Chem., 2004, 69, 8005–8011 CrossRef PubMed.
- M. Carafa, E. Mesto and E. Quaranta, Eur. J. Org. Chem., 2011, 13, 2458–2465 CrossRef.
- E. Quaranta, A. Angelini, M. Carafa, A. Dibenedetto and V. Mele, ACS Catal., 2014, 4, 195 CrossRef CAS.
- F. Aricò, S. Evaristo and P. Tundo, Green Chem., 2015, 17, 1176–1185 RSC.
- X. Fu and C.-H. Tan, Chem. Commun., 2011, 47, 8210–8222 RSC.
- H. Mutlu, J. Ruiz, S. C. Solleder and M. A. R. Meier, Green Chem., 2012, 14, 1728–1735 RSC.
- J. J. Kim, K. Funabiki, H. Muramatsu, K. Shibata, S. H. Kim, H. Shiozaki, H. Hartmann and M. Matsui, J. Chem. Soc., Perkin Trans. 2, 2001, 2, 379–387 RSC.
- J. Fabian and H. Hartmann, Light Absorption of Organic Colorants, Springer-Verlag, Berlin, 1980, p. 42 Search PubMed.
- G. S. Kumar; Azo Functional Polymers: Functional Group Approach in Macromolecular Desingn, Technomic Publishing, USA, 1992, p. 32 Search PubMed.
- A. Szelest-Lewandowska, B. Masiulanis, M. Szymonowicz, S. Pielka and D. Paluch, J. Biomed. Mater. Res., Part A, 2007, 509–520 CrossRef CAS PubMed.
- F. Aricò, U. Toniolo and P. Tundo, Green Chem., 2012, 14, 58–61 RSC.
- J. B. Cavalcanti, R. C. C. Ximenes, G. B. L. Couto, J. T. Pinheiro, L. B. Evêncio, M. L. N. Nascimento, P. M. N. Freitas, G. M. P. Silva, C. M. M. B. Castro and E. R. Almeida, Rev. Bras. Plant. Med., 2013, 15, 467–473 CrossRef.
- C. J. De lima, I. I. C. Da Silva, L. F. H. Barros, J. M. Granjueiro and M. H. P. Silva, Rev. Mater., 2011, 16, 574–582 Search PubMed.
- A. A. L. Faraj, B. Alotaibi, A. P. Shaik, K. Z. Shamma, I. A. Jammaz and J. Gerl, Int. J. Nanomed., 2015, 10, 6293–6302 CrossRef PubMed.
- A. Y. L. Lim, I. Segarra, S. Chakrarthi, S. Akram and J. P. Judson, BMC Pharmacol., 2010, 10, 1–17 Search PubMed.
- J. E. Vela-ramirez, J. T. Goodman, P. M. Bogiatto, R. Roychoudhury, N. L. B. Pohl, J. M. Hostetter, M. J. Wennemuehler and B. Narasimhan, AAPS J., 2015, 17, 256–267 CrossRef CAS PubMed.
Footnote |
| † Electronic supplementary information (ESI) available: NMR, ESI-MS and FT-IR data are reported. See DOI: 10.1039/c6ra11075d |
| This journal is © The Royal Society of Chemistry 2016 |

