DOI:
10.1039/C4TX00066H
(Paper)
Toxicol. Res., 2015,
4, 160-168
Interaction of tannic acid with carbon nanotubes: enhancement of dispersibility and biocompatibility†
Received
3rd July 2014
, Accepted 28th September 2014
First published on 1st October 2014
Abstract
The interaction of manufactured nanomaterials with environmental and biological systems has been a subject of great research interest for a long time. In the present study, adsorption of a universal environmental organic material (named tannic acid (TA)) on carbon nanotubes (CNTs) was investigated. The influence of CNT properties and pH values on the sorption capacity of CNTs for TA was also evaluated. Our results demonstrated that the sorption capacity of CNTs was positively correlated with their specific surface areas. Furthermore, TA could effectively enhance the water dispersibility of CNTs and reduce their cytotoxicity. Our results implied that TA could influence the environmental behavior and biological responses of the manufactured nanomaterials, reminding us that much more attention should be paid to the synergistic toxicity of nanomaterials when we evaluate their environmental impacts.
1. Introduction
With the rapid development of nanoscience and nanotechnology, a variety of manufactured nanomaterials including semiconductor quantum dots, metal oxides, metal nanoparticles, carbon nanomaterials, organic nanomaterials, etc. have been prepared and these show a great deal of potential applications in various fields.1–16 Mass production and subsequent widespread applications of these nanomaterials will inevitably increase their release into the environment, and arouse great interest in their toxicity to the environment and human health.17–22 Therefore, a careful examination of manufactured nanomaterials with environmental and biological systems is of great research interest. Over the past few years, considerable effort has been devoted to these areas and some progress has been made. For example, previous reports have suggested that many environmental pollutants including organic materials, heavy metal ions and radioactive elements could be adsorbed on nanomaterials owing to their high surface areas and specific chemical properties.23–33 Adsorption of organic materials on manufactured nanomaterials might also change their water dispersibility and environmental behavior.34 On the other hand, considering the potential applications of nanomaterials, the biological responses of various biological systems including different types of cells, viruses, fungi, bacterials, plants and animals with manufactured nanomaterials have also been carefully examined.35–41 However, to the best of our knowledge, the effect of environmental pollutants on the biological responses of manufactured nanomaterials has seldom been reported.42–44
Tannic acid (TA) is a relatively simple dissolved organic matter (DOM) with a known molecular structure; it is distributed in species throughout the plant kingdom and is formed by degradation of dead plants.45 It has been reported that TA has a significant effect on the dispersion and mobility of nanomaterials in aqueous environments.31,46 TA has also been previously regarded as the model chemical or DOM surrogate to investigate the mechanism of adsorption of DOM by carbon nanotubes (CNTs).34 For example, Lin et al. indicated that TA could be adsorbed onto CNT surfaces with a sorption affinity comparable to that of DOM and can enhance the stability of CNT suspensions, suggesting that the environmental behavior or biological responses of CNTs may be altered due to the adsorption of TA in the environment.23 On the other hand, due to its unique structural characteristics such as polyphenol structure (Fig. S1†), TA possesses a strong antioxidant capability, and has been regarded as an antioxidant compound to prevent lipid oxidation and radical-mediated DNA cleavage by scavenging oxygen and oxygen-derived radicals.47–50 Therefore we can expect that the biological responses of nanomaterials may be changed after they were interacted with TA.
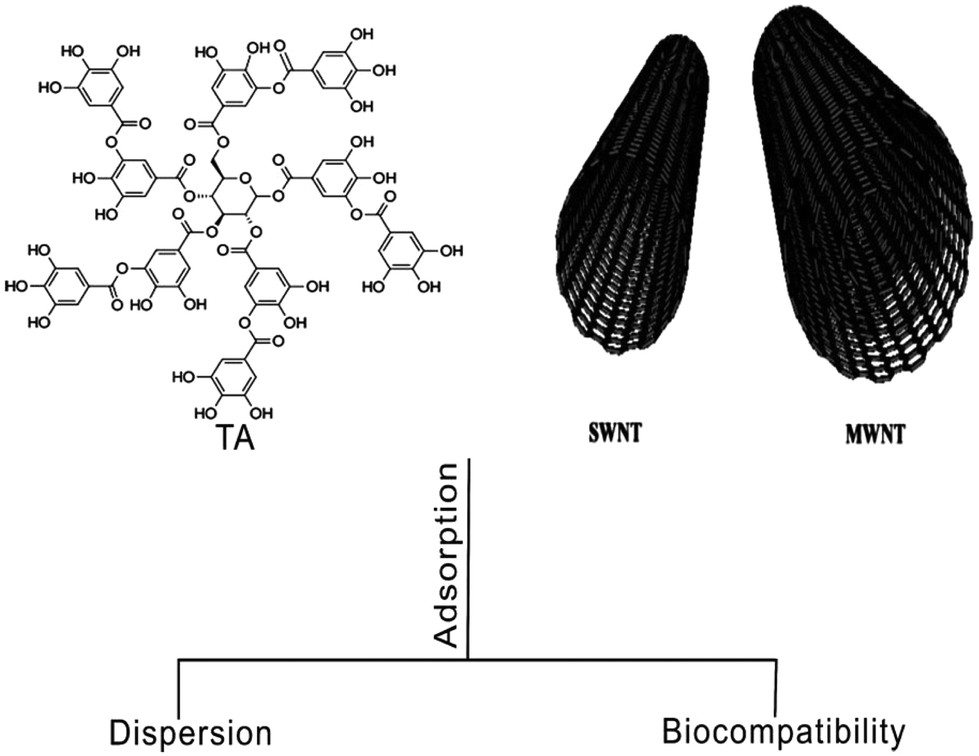
In this contribution, CNTs were selected as the model manufactured nanomaterials to investigate their interaction with TA because of their superior properties51,52 and promising applications.27–29,32,53–58 As shown in Scheme 1, the adsorption of TA on single-walled carbon nanotubes (SWNTs) and four multi-walled carbon nanotubes (MWNTs) with different diameters was investigated to evaluate the effect of CNT properties on the adsorption of TA by CNTs. The influence of pH values on the sorption capability of CNTs was also determined. Finally, the cytotoxicity of CNTs and CNT–TA complexes was also compared. We demonstrated that TA has a significant influence on the water dispersibility and biocompatibility of CNTs. These results reminded us that much more attention should be paid to the environmental impact of nanomaterials because they may be interacted with other environmental pollutants.
 |
| | Scheme 1 Schematic showing the experimental conditions under which the effects of TA adsorbed onto the CNTs was investigated for the corresponding dispersion and biocompatibility. TA: tannic acid, SWNT: single-walled carbon nanotubes, MWNT: multi-walled carbon nanotubes. | |
2 Experimental section
2.1 Materials
CNTs were purchased from Shenzhen Nanotech Port Co., China. They included one SWNT with a claimed outer diameter of 1–2 nm and four MWNTs with claimed outer diameters of <10 nm (MWNT10), 20–30 nm (MWNT30), 20–40 nm (MWNT40) and 60–100 nm (MWNT100). These CNTs were synthesized by chemical vapor deposition from the CH4–H2 mixture at 700 °C using Ni particles as a catalyst. All the CNT samples were used without any further purification and their basic properties, such as the diameter, length, purity, amorphous contents and special surface areas of these CNTs, were provided by the supplier (Table 1). TA was purchased from Sinopharm Group Chemical Reagent Co. Ltd (Shanghai, China) with a structure characterized by five digallic acid units ester-linked to a glucose core (Fig. S1†). Detailed structural information on TA could be found in ESI.† The characterization of CNTs was done by scanning electron microscopy (SEM; LEO 1530 VP) and transmission electron microscopy (TEM; JEOL, JEM-2010). The high resolution TEM images were obtained using a FEI Tecnai G2 F20 TEM operated at an accelerating voltage of 200 kV. TEM grids were prepared by loading the sample dispersed ultrasonically in ethanol onto a copper grid. Thermal gravimetric analysis (TGA) was conducted on a TA instrument Q50 with a heating rate of 20 °C min−1. Samples weighing between 10 and 20 mg were heated from 25 to 600 °C in air flow (60 mL min−1), with N2 as the balance gas (40 mL min−1). Raman spectra of CNT nanoparticles were recorded on an RM 2000 confocal microscopic Raman spectrometer (Renishaw PLC, England) employing a 514.5 nm laser beam. The X-ray photoelectron spectra (XPS) were recorded on a VGESCALAB 220-IXL spectrometer using an Al Kα X-ray source (1486.6 eV). The FT-IR spectra were recorded in transmission mode on a Perkin-Elmer Spectrum 100 spectrometer (Waltham, MA, USA). Typically, 4 scans at a resolution of 1 cm−1 were accumulated to obtain one spectrum. The Brunauer–Emmett–Teller (BET) surface area, SBET, of the samples was determined from N2 adsorption–desorption isotherms obtained at 77 K using an ASAP 2010 Surface Area Analyzer (Micromeritics Instruments, USA). Prior to measurements, all samples were outgassed for 2 h at 473 K and 0.1 Pa. The surface areas were calculated by the BET method.59 The metal catalysts of CNT samples were detected by Inductively Coupled Plasma Mass Spectrometry (ICP-MS, Thermo Elemental, X-7). We demonstrated that the metal catalyst in CNT samples is very low (less than 1%), indicating its high purity. For example, the metal catalyst of MWNT40 is 0.63% for Fe and 0.14% for Ni.
Table 1 Properties of CNTs. Special surface areas of CNT samples were determined by BET, and the other properties of CNTs were provided by the supplier
| CNTs |
Diameter (nm) |
Length (μm) |
Purity |
Amorphous carbon |
Special surface area |
| SWNT |
1–2 |
5–15 |
90% |
5% |
526 |
| MWNT10 |
<10 |
5–15 |
90% |
5% |
272 |
| MWNT30 |
10–30 |
5–15 |
95% |
3% |
112 |
| MWNT40 |
20–40 |
1–2 |
95% |
3% |
102 |
| MWNT100 |
60–100 |
5–15 |
95% |
3% |
61 |
2.2 Batch adsorption experiments
The adsorption experiments were performed according to a previous report with a small modification.23 Briefly, 8 mg of CNTs was added into 40 mL vials with 40 mL of TA solution with initial TA concentrations of 0, 5, 10, 20, 40, 100, 200 and 300 μg mL−1. The mixtures of CNTs and TA solution were sonicated in a water bath (25 °C, 40 kHz) for 15 min. Then the vials were sealed with aluminum-foil-lined Teflon screw caps and were shaken for 5 days at 25 ± 1 °C. Preliminary experiments indicated that apparent equilibrium of sorption was reached within 48 h (Fig. S5†). After equilibration, they were filtered through a 0.22 μm membrane filter. The filtrate was immediately measured using a UV-Vis spectrophotometer (Hitachi, U-3010, Tokyo, Japan) at 274 nm (Fig. S4†).
To study the effect of pH values on TA sorption, 8 mg of CNTs were dispersed into 40 mL solutions containing 40 μg mL−1 of TA. The initial pH values were adjusted from 1.0 to 11.0 using NaOH or HCl (1 mol L−1) (the pH values after adjustment could be found in ESI Table S2†). After the suspensions were shaken for 48 h at room temperature, the amounts of TA adsorbed on CNTs at different pH values were calculated using the method in ESI (Fig. S4†).
Commonly used nonlinear isotherm models (Table S1, ESI†) were employed to fit the sorption experiment data. All estimated model parameter values and their probabilities of assuming the null hypothesis (P) were determined using a plotting software program (Original 8.0). Statistical significance was accepted when P was less than 0.01. The goodness of fit was evaluated by the fitting parameters adjusted square of the correlation coefficient (Adj r2, also given by the Original 8.0) which takes into account the number of independent variables reflecting the degrees of freedom.
2.3 Effect of TA on the stability of CNT suspensions
Furthermore, the effects of TA on the stability of CNT suspensions were also investigated using the method described above. In brief, 8 mg of CNTs was dispersed into 40 mL with 40 μg mL−1 of TA solution. Vials were sealed and shaken for 5 days. After equilibration, the vials were centrifuged at 3000 rpm for 20 min, and the resulting supernatants, stable suspensions possibly with dispersed individual nanotubes, were taken out and determined with a UV-Vis spectrometer at 500 nm. Because TA has no absorbance at 500 nm (Fig. S4a†), there was a good correlation between the absorbance at this wavelength and CNT concentrations. Additional, previous reports indicated that the deposition of CNT suspensions by centrifuging at 3000 rpm for 20 min was more than that by deposing for 4 days.23,60 The 4 day period was used previously as the duration to examine the stabilization of CNTs in an aqueous phase. Thus, the suspended CNTs in the supernatants after centrifuging at 3000 rpm for 20 min were arbitrarily considered to be stable in TA solution.
2.4 The effect of TA on the cytotoxicity of SWNT and MWNT40
Human lung cancer cells (A549 cells) were purchased from the Institute of Biochemistry and Cell Biology, Shanghai, China. A549 cells were cultured in RPMI-1640 medium supplemented with 10% heat-inactivated FBS, 2 mM glutamine, 100 U mL−1 penicillin, and 100 μg mL−1 streptomycin. Cell culture was maintained at 37 °C under humidified conditions of 95% air and 5% CO2 in culture medium. Cell culture medium was changed every three days for maintaining the exponential growth of the cells.
The 3-(4,5-dimethylthiazol-2-yl)-2,5-diphenyltetrazolium bromide (MTT, Sigma) cell viability assay was conducted to investigate the cytotoxicity of SWNT and MWNT40 before and after adsorption of TA according to our previous reports.61–67 Briefly, 1 × 10⁵ cells were grown in wells of a 24 well plate overnight in a volume of 1 mL. Cells were then treated with 20 μg mL−1 of TA and serially diluted CNTs (0, 5, 10, 20, 40, 100 μg mL−1) for 24 h. The CNTs were sterilized by a standard sterilization procedure (121 °C, 30 min) for cell culture. Then these sterilized CNTs were dispersed in cell culture medium with a concentration of 2 mg mL−1. Then cell culture medium was removed and cells were washed three times with PBS to remove the TA and dead cells. 500 μl of MTT solution was added and incubated for 2 h, and 500 μl of sodium dodecyl sulfate was added to dissolve the MTT crystal. At the end of this period, the number of viable cells was determined by a quantitative colorimetric staining assay using a tetrazolium salt (MTT, Sigma Chemical Co.) and measured using a microplate reader (Bio-Rad, model 680, Bio-Rad Co., Hercules, USA). Cultures without cells were used as blanks. The amount of dark blue formazan dye generated by the live cells was proportional to the number of live cells. Four replicate wells were used for each control and test concentration per plate, and the experiment was repeated three times. Cell survival was expressed as absorbance relative to that of untreated controls. Results are presented as the mean ± standard deviation (SD).
2.5 DPPH free radical scavenging assay
The 1,1-diphenyl-2-picryl (DPPH˙) free radical scavenging assay was performed to determine the antioxidant activity of TA according to previous studies but with slight modifications.62,68 Briefly, 0.1 mM solution of DPPH˙ was prepared in ethanol and 0.5 mL of this solution was added to 1.5 mL of TA solution in ethanol at different concentrations (5–40 μg mL−1). Half an hour later, the absorbance was measured at 515 nm against blank samples. Lower absorbance of the reaction mixture indicates higher DPPH˙ free radical scavenging activity. A standard curve was set up using different concentrations of DPPH˙. The DPPH˙ concentration scavenging capacity was expressed as mM in the reaction medium and calculated from the calibration curve determined by linear regression (r2 = 0.9972). The capability to scavenge the DPPH˙ radical was calculated using the following equation:
| Scavenging activity (%) = (A − B)/A × 100 |
where A is the absorbance of DPPH˙ and B is the absorbance of the DPPH˙ and TA combination.
3. Results and discussion
3.1 Characterization of CNTs
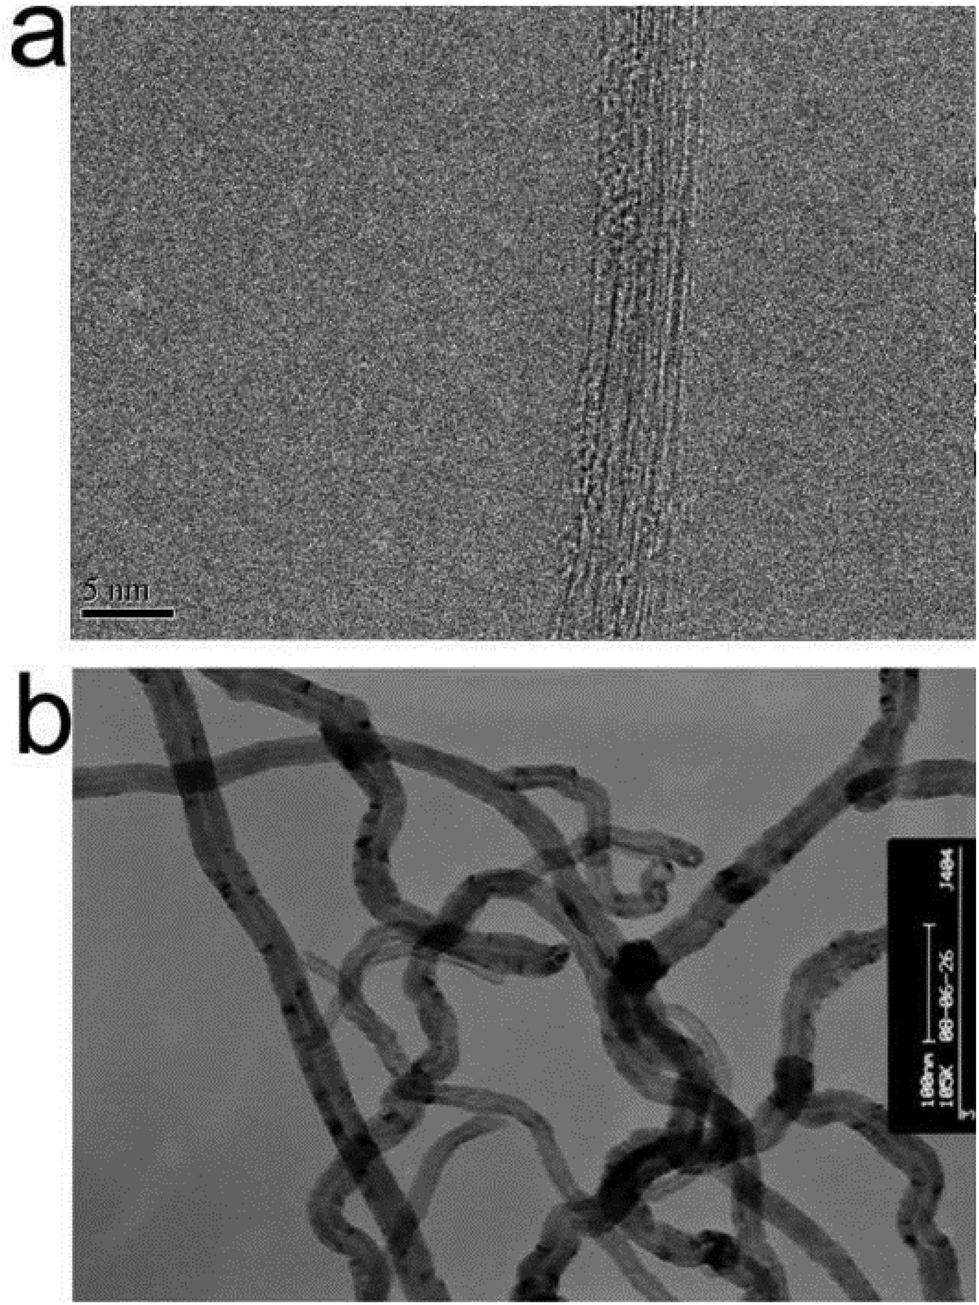
The topographical microstructure and surface morphology of the CNTs were characterized by SEM and TEM. SWNT entangled into bundles with diameters from seven to tens of nanometers due to the strong interaction between the individuals. Lots of amorphous carbon clusters or metal contaminants could be clearly observed on the surface of bundles (Fig. S2a,†Fig. 1a). Fig. S2b† shows that MWNT40 was also readily wrapped into bundles; however, the entanglement of MWNT40 was obviously reduced. The SWNT was displayed in Fig. 1a. It can be seen that bundles of SWNT with diameter around 5 nm can be observed. Although a lot of high resolution TEM images were obtained, it is still very difficult to obtain an individual SWNT via TEM characterization. In contrast, the outer wall and the inner wall of MWNT40 can also be easily discriminated by TEM characterization (Fig. 1b). Compared with SWNT, few amorphous carbons were found by TEM. On the other hand, the morphology of CNTs showed no significant change after TA was adsorbed on the CNTs (Fig. S6†). However, the dispersibility of both SWNT and MWNT40 was obviously improved (Fig. S7†). The enhanced water dispersibility of CNTs after adsorption of TA is likely due to the introduction of hydrophilic phenolic hydroxyl groups into CNTs. The enhancement of water dispersibility of CNTs could also be achieved by many other amphiphilic agents. For example, Kim et al. compared the dispersion of SWNTs using a commercially available surfactant (Pluronic F-127) and a water-soluble chitosan derivate, chitosan-hydroxyphenyl acetamide (CHPA). They demonstrated that CHPA is an efficient biocompatible agent for individual dispersion of SWNTs. The pendant phenyl rings on CHPA could be the main force for adsorption of CHPA on SWNTs.60
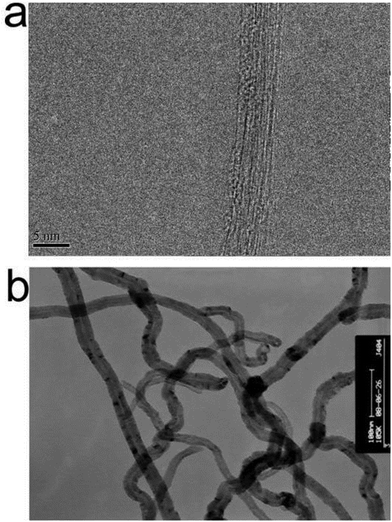 |
| | Fig. 1 TEM images of CNTs: (a) SWNT, scale bar = 5 nm; and (b) MWNT40, scale bar = 100 nm. | |
It is well known that TA has ten aromatic rings and a number of hydrophilic hydroxyl groups. When it was mixed with CNTs, the aromatic rings could readily adsorb on the CNT surface through π–π interaction, which has been previously proposed by many other reports.23 The hydrophilic hydroxyl groups could therefore be introduced on the surface of CNTs at the same time; thus the CNTs showed enhanced dispersibility in aqueous solution. On the other hand, the improvement in water dispersion of CNTs after adsorption of TA was further evidenced by the zeta-potential measurement. For example, zeta-potential values of SWNT and MWNT40 are −14.5 ± 5.4 and −13.4 ± 5.2 eV, respectively. The zeta-potential values were increased to −47.5 ± 3.4 and −51.2 ± 2.5 eV for SWNT-TA and MWNT40-TA, respectively. The increase of the absolute zeta-potential values could therefore increase the electrical double layer repulsive forces, thus improving the stability of CNT suspensions.
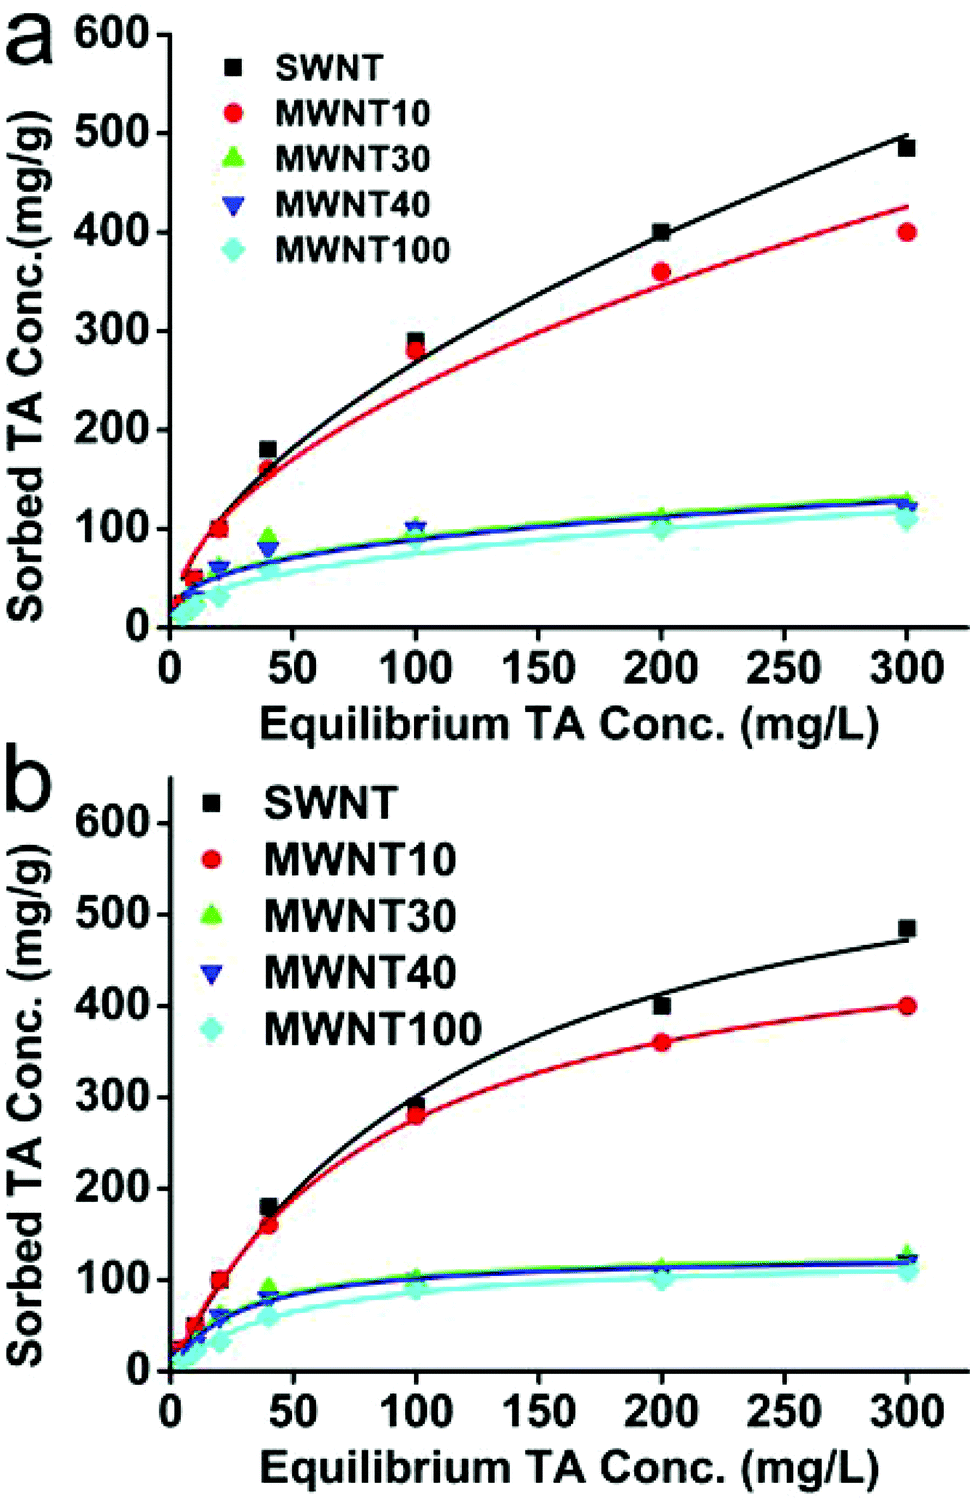
3.2 Effects of CNT properties on sorption
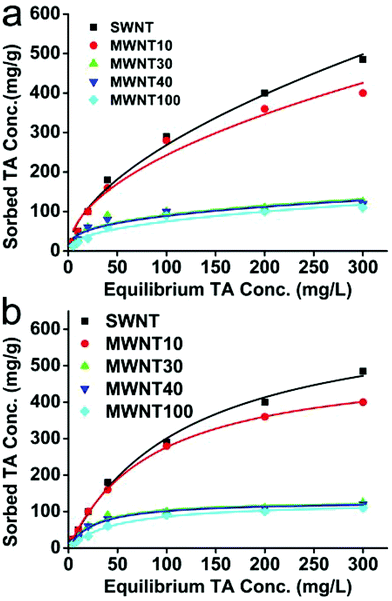
Adsorption isotherms of TA on SWNT and four MWNTs were fitted by two commonly used nonlinear fitting models: the Freundlich model (Fig. 2a) and the Langmuir model (Fig. 2b). As shown in Fig. 2, both of them could obtain good fitting results, and CNTs with different properties showed significantly different sorption capabilities. We found that the sorption capabilities of SWNT and MWNT10 were obviously greater than those of MWNT30, MWNT40 and MWNT100. However, the sorption capacities of MWNT30, MWNT40 and MWNT100 show no significant difference at given sorption concentrations. The effects of CNT properties and surface functionalization on their adsorption behavior has recently been reported by Wang et al.69 Three different CNTs (SWCNTs, DWCNTs and MWCNTs) and two oxidized MWCNTs with different oxygen contents have been utilized for adsorption of heavy metal ions. They demonstrated that the adsorption capacity of CNTs for heavy metal ions was dominated by the amount of surface functional groups of CNTs. On the other hand, they also suggested that most of the heavy metal ions could be desorbed from CNTs in solutions with low pH values, but a small portion of them might be adsorbed on CNTs irreversibly as the amount of metal ions adsorbed on CNTs increases.69 Our results as well as the previous reports implied that the adsorption capability of CNTs to environmental pollution could be improved by surface modification. Furthermore, our results also indicated that adsorption of TA might also influence the interactions between CNTs and heavy metal ions.
 |
| | Fig. 2 Adsorption isotherms of TA on CNTs: (a) Freundlich model fitting results and (b) Langmuir model fitting results. | |
Table 2 shows the Langmuir model fitting results obtained from sorption data. It can be seen that the adsorption capacity (Q0) decreased in the order of SWNT > MWNT10 > MWNT30 > MWNT40 > MWNT100. By comparing with the results of Table 1, we found that the sorption capacity of CNTs was positively correlated with their special surface areas. However, it is worth noting that although the special surface area of SWNT (526 m2 g−1) is much greater than that of MWNT10 (272 m2 g−1), their sorption capacity showed relatively small difference (660 mg g−1 for SWNT and 517 mg g−1 for MWNT10), suggesting that other factors such as oxygen and amorphous carbon contents may also contribute to the sorption capability of TA and CNTs. Similar results were also demonstrated in previous reports.24 As Lin et al. demonstrated, the special surface area of SWNT was larger than that of MWNT10; however their sorption capacity Q0 showed the opposite trend.24 They speculated that SWNT may be readily entangled into bundles due to its greater aspect ratio, thus decreasing the sorption sites for TA. In contrast with Lin's results, we showed that the sorption capacity of SWNT is not like the expected value; it is still greater than that of MWNT10. The difference in results between this work and Lin's report is partly ascribed to the different sorption treatments used.24 For example, in our work, the CNTs and TA were first mixed and ultrasonically dispersed for 15 min; however, Lin's report did not use ultrasonic dispersion before sorption experiments. This comparison suggested that apart from the properties of CNTs, ultrasonic treatment could also influence the sorption capacity of CNTs.24 Furthermore, pretreatment by ultrasonic treatment could also shorten the equilibrium time. In this study, the sorption equilibrium time is 48 h, which is significantly shorter than in Lin's report.24 One possible reason for these differences is that ultrasonic treatment could effectively decrease entanglement of CNT bundles.
Table 2 Langmuir model coefficients obtained from sorption data fitting resultsa
| CNT |
Q
0
|
p of Q0 |
b
|
p of b |
Adj r2 |
|
Q
0 (mg g−1) is the maximum monolayer adsorption capacity, b [mg L−1] constant is related to the molar heat of adsorption, and Adj r2 is the adjusted r square.
|
| SWNT |
660 |
<0.01 |
0.00835 |
<0.01 |
0.995 |
| MWNT10 |
517 |
<0.01 |
0.0114 |
<0.01 |
0.999 |
| MWNT30 |
131 |
<0.01 |
0.0369 |
<0.01 |
0.968 |
| MWNT40 |
128 |
<0.01 |
0.0369 |
<0.01 |
0.986 |
| MWNT100 |
127 |
<0.01 |
0.0206 |
<0.01 |
0.992 |
The Langmuir adsorption model is the most commonly used model to quantify the amount of adsorbate adsorbed on an adsorbent as a function of partial pressure or concentration at a given temperature. The basic idea behind the Langmuir model is the coverage of the surface by a monomolecular layer. Therefore, CNTs with greater special surface areas (SWNT and MWNT10) showed relatively better fitting results than CNTs (MWNT30, MWNT40 and MWNT100) with smaller surface areas (Adj r2 in Table 2). One more thing that should be pointed out is that the special surface areas of SWNT are significantly greater than those of MWNT10. However, the Adj r2 value is smaller than that of MWNT10. We believe that the possible reason is that the surface of SWNT is different from that of MWNT10. As described above, SWNT are readily entangled and coated by amorphous carbon. Therefore it will lead to significantly different adsorption sites. However, one of the main assumptions used in the Langmuir model is that all adsorption sites are equally “active”. Compared with the Langmuir model, the Freundlich model is an important multisite adsorption model for rough surfaces. Therefore, the Adj r2 values obtained from the Freundlich model showed no significant difference (Table 3), suggesting that the sorption of TA by CNTs was complex, which was not confined in the carbon nanotube surface and TA.
Table 3 Freundlich model coefficients obtained from sorption data fitting resultsa
| CNT |
K
f
|
p of Kf |
n
|
p of n |
Adj r2 |
|
K
f [(mg g−1)/(mg L−1)1/h] is the Freundlich affinity coefficient, and 1/n is the Freundlich exponential coefficient.
|
| SWNT |
21.7 |
<0.01 |
1.79 |
<0.01 |
0.994 |
| MWNT10 |
22.9 |
<0.01 |
1.87 |
<0.01 |
0.995 |
| MWNT30 |
13.44 |
<0.01 |
2.27 |
<0.01 |
0.994 |
| MWNT40 |
15.74 |
<0.01 |
2.45 |
<0.01 |
0.995 |
| MWNT100 |
12.2 |
<0.01 |
2.25 |
<0.01 |
0.995 |
The sorption mechanism of TA by CNTs have been widely investigated and discussed.23,70–72 A generally accepted mechanism was that aromatic rings in the structure of TA could interact with the surface of CNTs through π–π interactions. As we all know, there are ten aromatic rings in the TA structure. Therefore the interactions between TA and CNTs are very strong. Moreover, once TA was adsorbed on the surface of CNTs, many functional groups will also be introduced onto the surface of CNTs. They may continue interacting with TA in solution through π–π interactions and hydrogen bonds. Therefore, the sorption between TA and CNTs may not be regarded as monomolecular layer adsorption when CNTs are dispersed in a high concentration of TA solution. This could also explain why the Freundlich model is better than the Langmuir model.
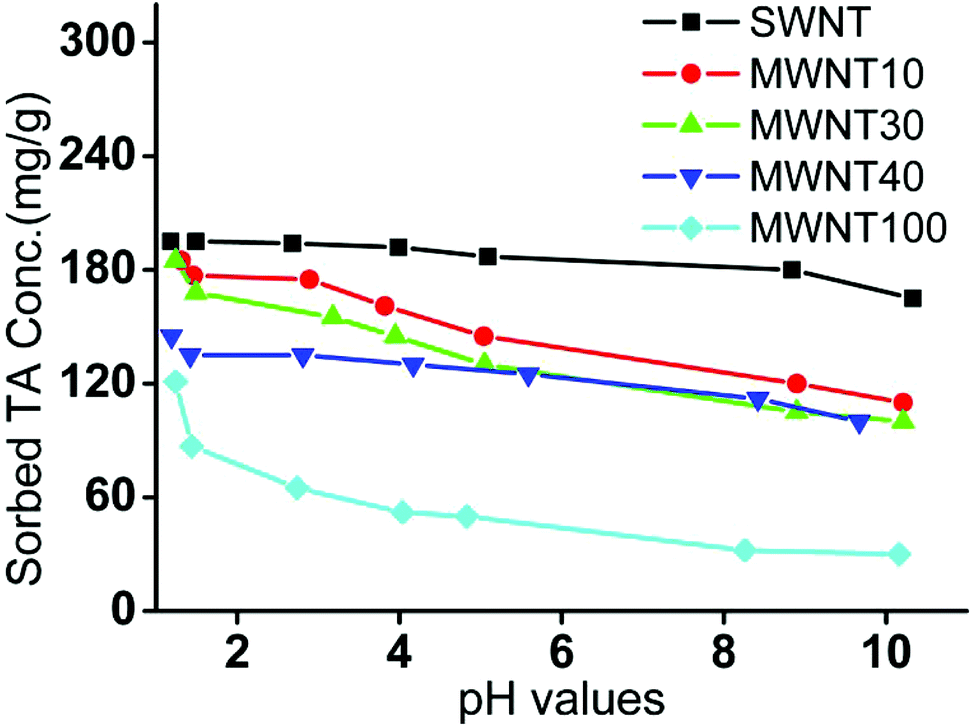
3.3 Effect of pH values on sorption
Fig. 3 shows the effect of pH values on the sorption of TA by CNTs. It can be seen that the sorption capacity of CNTs decreased with the increase of pH values. We ascribed these results to the following reasons. For example, at high pH values, the hydroxyl groups on TA will be ionized, thus increasing the repulsive force between TA and impeding the formation of multi-layered TA adsorption layers. In contrast, at low pH values, TA is likely to form multi-layer TA adsorption layers. However, it is worth noting that the influence of pH values on the sorption capacity of CNTs is significantly different. The pH values showed little influence on the sorption capacity of SWNT because it possessed relatively high special surface areas, which did not have to form multi-layers at the experimental concentration of TA (40 μg mL−1).
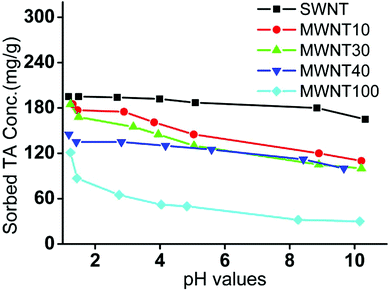 |
| | Fig. 3 Effects of pH values on the adsorption of TA by CNTs. The concentration of CNTs is 200 μg mL−1 and the initial concentration of TA is 40 μg mL−1. | |
3.4 Dispersibility of CNTs in TA
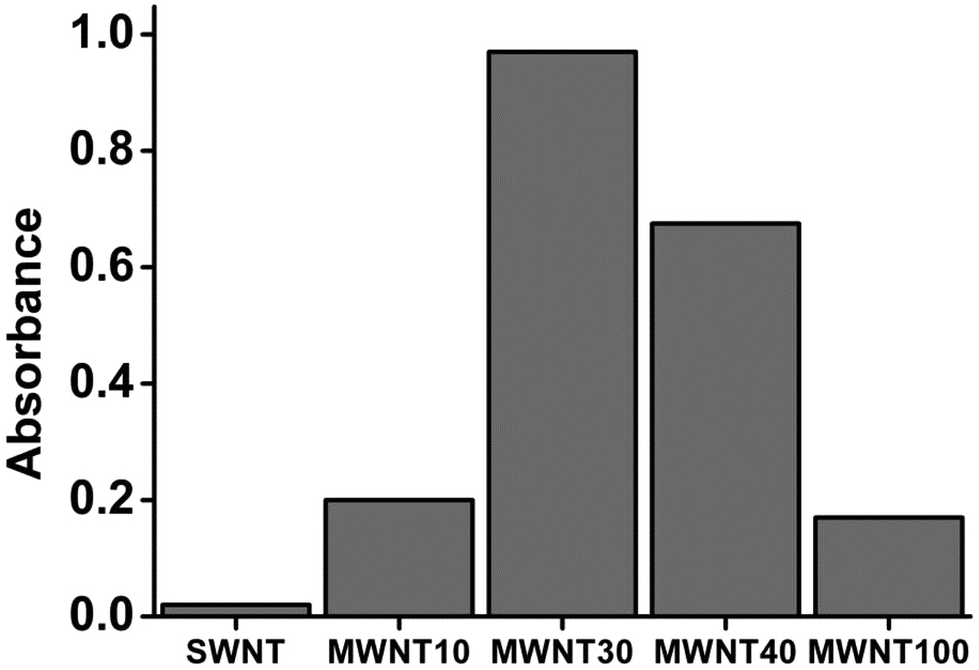
To examine the dispersibility of CNTs in TA solution, the absorbance at 500 nm was quantitatively determined using a UV-Vis spectrometer. CNT–TA suspensions were obtained according to the procedure described in the Experimental section. As shown in Fig. 4, most of the CNT suspensions show absorbance at 500 nm, but their absorbance is different for different CNTs. Among them, the absorbances of MWNT30 and MWNT40 are relatively high. However, the absorbance of SWNT is close to zero, suggesting that the effects of TA on the dispersibility of different CNTs are different. It is worth noting that the dispersibility of CNTs is not positively correlated with their adsorption capacity. As shown in Fig. 2, the SWNT has the maximum adsorption capability; however, its UV absorbance value is very low (Fig. 4). We speculated that one of the possible reasons is that the concentration of TA used in our experiment is too low. In this case, the concentration of TA is not enough to fully debundle SWNTs. However, because the special surface areas of MWNT30 and MWNT40 are relatively low, TA is enough for covering the surface of these CNTs, showing significant enhancement of their water dispersibility. On the other hand, the low efficient water dispersibility of MWCNT100 is possibly ascribed to the few TA adsorbed on its surface (Fig. 4).
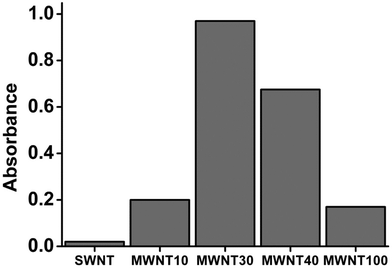 |
| | Fig. 4 Absorbance of CNT suspensions after CNTs were dispersed by a water solution with 40 μg mL−1 of TA. | |
3.5 The effect of TA on the cytotoxicity of SWNT and MWNT40
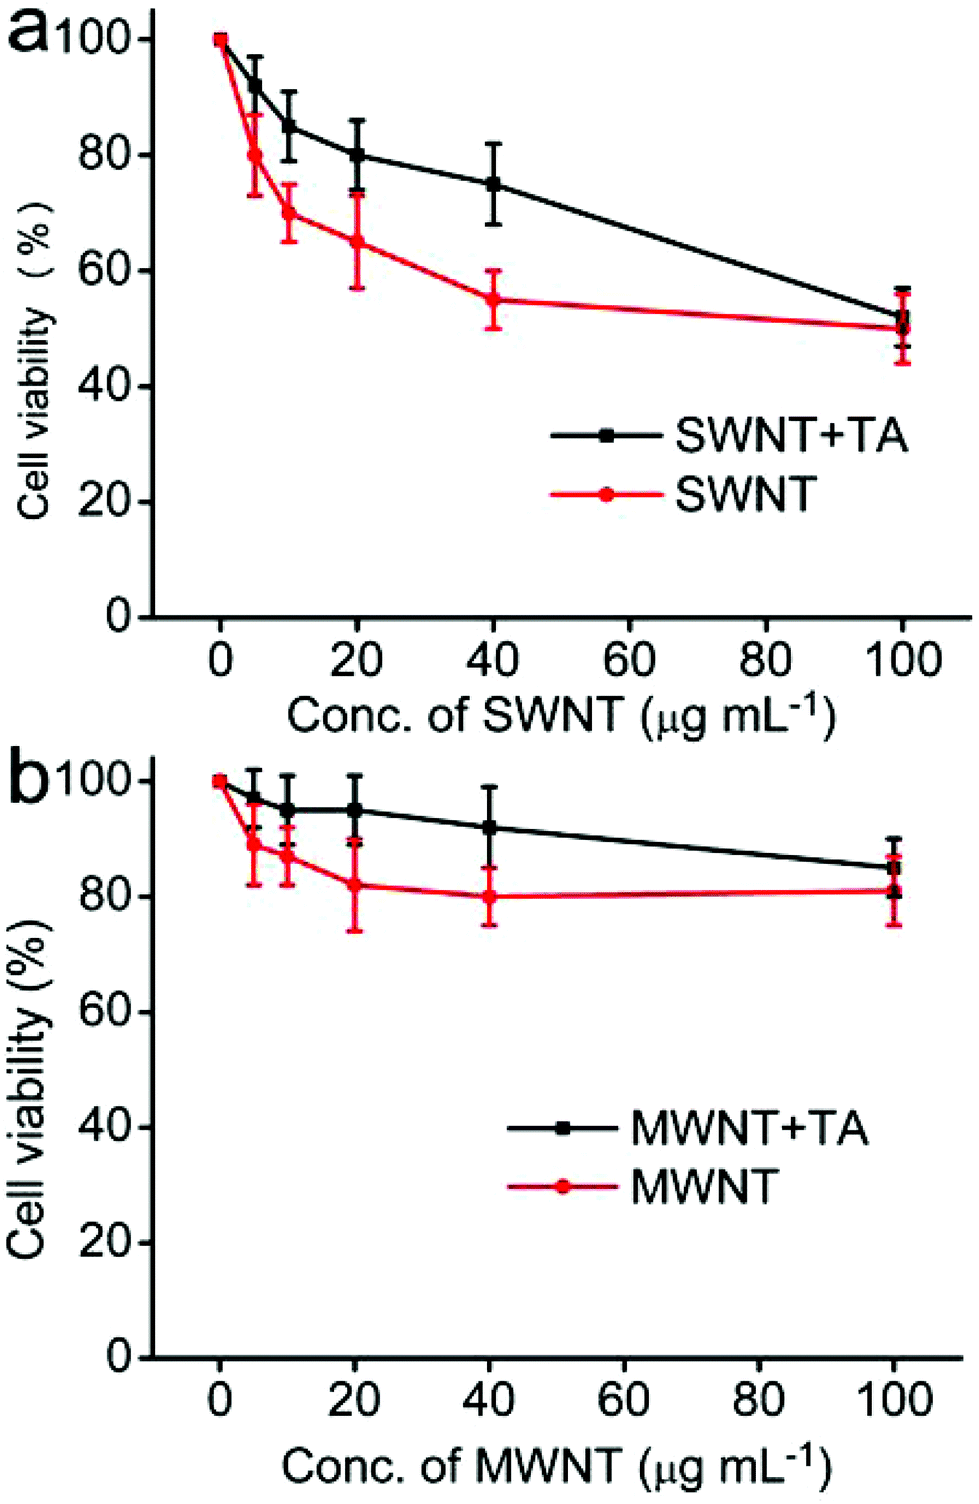
Before the determination of the effect of TA on the cytotoxicity of SWNT and MWNT40, we first evaluated the cytotoxicity of TA to A549 cells. As shown in Fig. S8,† a dose-dependent cytotoxicity was observed. It can be seen that the cell viability of A549 cells is still greater than 90% when the concentration of TA is less than 20 μg mL−1. Therefore, we selected this concentration for further cytotoxicity experiments. Fig. 5 shows the effect of TA on the cytotoxicity of SWNT and MWNT40. It can be seen that the cytotoxicity of SWNT and MWNT40 to A549 cells shows a dose-dependent manner, and the cell viability of SWNT is greater than that of MWNT40. Interestingly, TA could significantly decrease the cytotoxicity of SWNT and MWNT40 at low dosage (<40 μg mL−1). However, when the concentration of CNTs is up to 100 μg mL−1, TA has no significant effect on the cell viability of CNTs. We think that the limited protective effect of TA on the cytotoxicity of CNTs at high concentrations could be ascribed to the following reasons. First, more TA was coated on CNTs in low concentration, which resulted in better dispersibility and low cytotoxicity. Second, ROS production by CNTs in high concentration has surpassed the free radical scavenging capability of TA. Previously, some reports have studied the interaction between TA and nanomaterials; however, these reports were focused on the adsorption mechanism and the effect of TA on transportation of nanomaterials in the environment.23 No studies have reported on the effects of TA on the biocompatibility of CNTs. The protective effects of TA on the cytotoxicity of CNTs are still unclear. It is well known that many factors such as adsorption of essential micronutrients and the physicochemical properties of CNTs could influence the cytotoxicity of CNTs.73 To better understand the mechanism of protection effects of TA on CNTs, the free radical scavenging capability of TA was measured. On the other hand, it has also been reported that the cytotoxicity of CNTs may be ascribed to the leaching of metal catalysts such as Fe, Co and Ni into the cell culture medium.74 Therefore the release of metal ions from CNTs was also determined by ICP-MS. In this work, we found that almost no metal ions were detected by ICP-MS when SWNT and MWNT40 were dispersed in water for 24 h, suggesting that leaching of metal ions from CNTs is not the major reason for the cytotoxicity of CNTs.
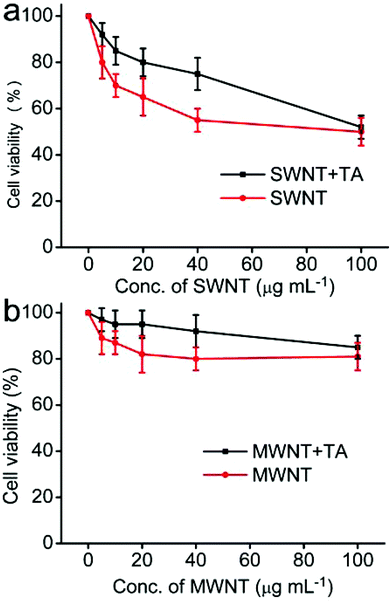 |
| | Fig. 5 Effects of TA on the cytotoxicity of SWNT and MWNT40 to A549 cells; the concentration of TA is 20 μg mL−1; CNTs and TA were co-exposed to cells for 24 h. (a) Cytotoxicity of SWNT and SWNT–TA; (b) cytotoxicity of MWNT40 and MWNT40–TA. | |
3.6 DPPH˙ free radical scavenging assay
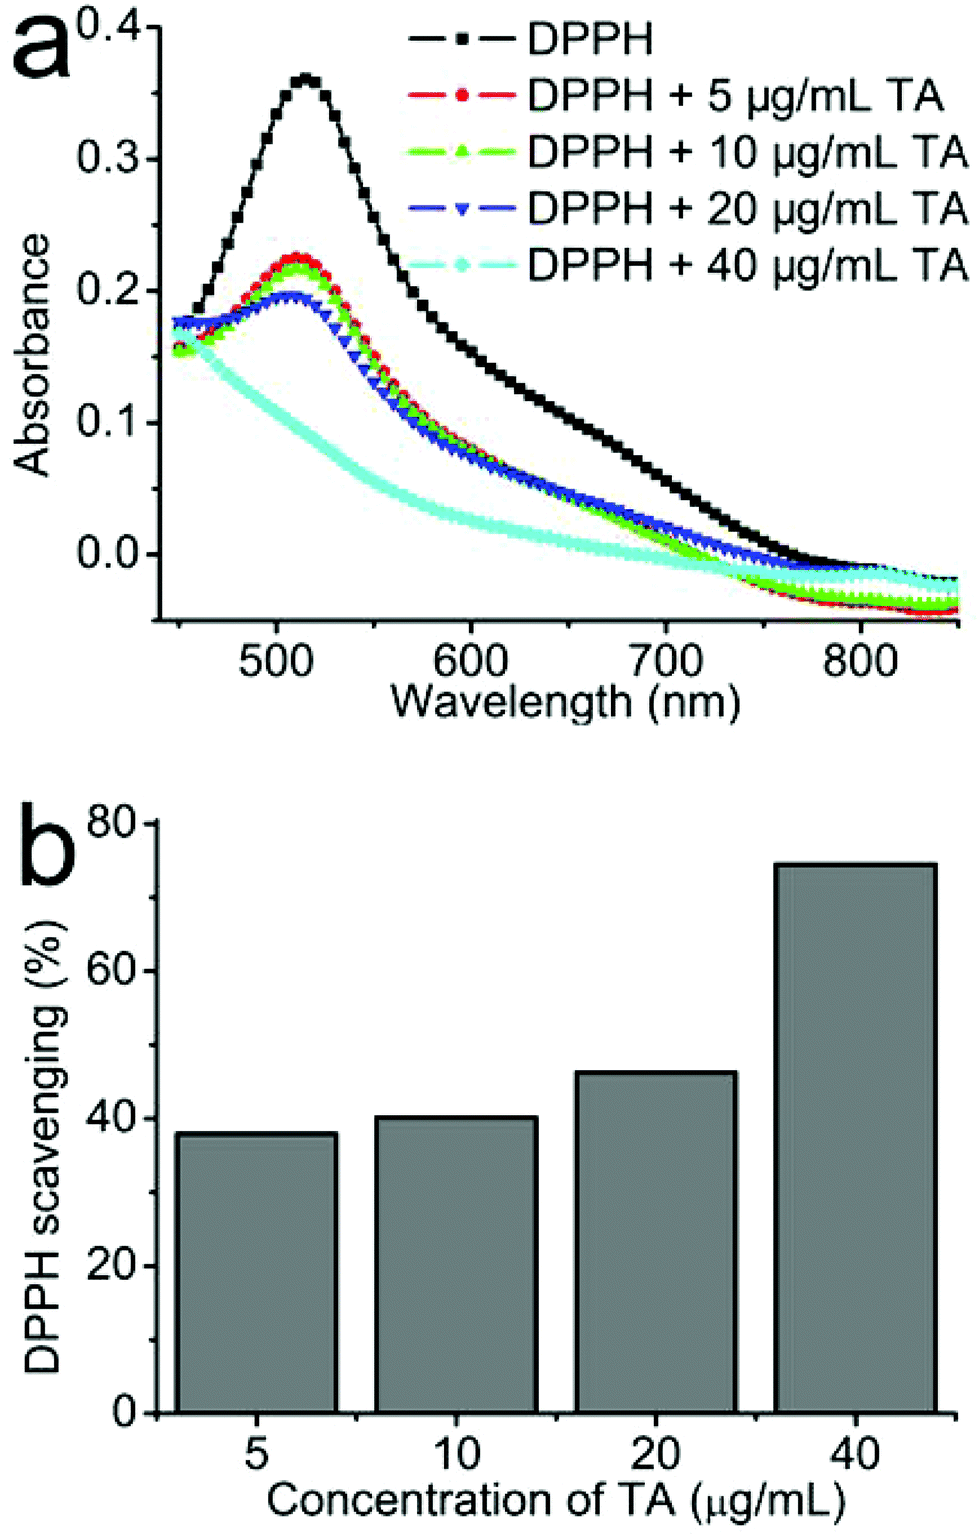
Fig. 6a shows the UV-Vis spectrum of DPPH˙ free radicals after mixing with different concentrations of TA from a concentration of 5 to 40 μg mL−1. It can be seen that the absorbance of DPPH˙ is significantly decreased after mixing with TA solution. With increasing the concentrations of TA, the free radical scavenging capability is significantly enhanced. We further investigated the dose-dependent radical scavenging capability of TA based on the UV absorbance at 515 nm. As shown in Fig. 6b, when the concentration of TA is up to 40 μg mL−1, about 75% of DPPH˙ free radicals were scavenged. As we all know, oxidant stress is one of the major mechanisms for CNT toxicity.75–77 Therefore, the strong free radical scavenging capability of TA may be the reason for the better biocompatibility of CNT–TA complexes.
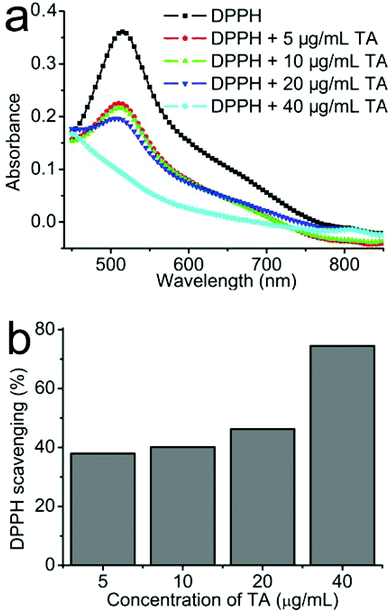 |
| | Fig. 6 DPPH˙ free radical scavenging activity of different concentrations (5–40 μg mL−1) of tannic acid (TA): (a) absorbance of the UV-Vis spectrum; (b) percent of DPPH scavenging by TA (DPPH: 1,1-diphenyl-2-picryl free radical). | |
4. Conclusions
In summary, this study showed that a universal environmental organic pollutant (TA) could be effectively adsorbed on CNTs, and their sorption capacity of CNTs was positively correlated with their specific surface areas. After the adsorption of TA, CNTs exhibited relatively higher water dispersibility. More importantly, our results further demonstrated that CNT–TA complexes showed much less cytotoxicity than that of CNTs alone. One possible reason could be ascribed to the antioxidant properties of TA. All of these results suggested that the environmental behavior as well as the biological outcome of manufactured nanomaterials could be affected by other environmental pollutants, reminding us that much more attention should be paid to the synergistic toxicity of nanomaterials and other environmental pollutants.
Acknowledgements
This research was supported by the National Science Foundation of China (no. 21134004, 21201108, and 51363016), and the National 973 Project (no. 2011CB935700), China Postdoctoral Science Foundation (2012M520388, 2012M520243, 2013T60100, and 2013T60178).
Notes and references
- X. Zhang, S. Wang, M. Liu, B. Yang, L. Feng, Y. Ji, L. Tao and Y. Wei, Phys. Chem. Chem. Phys., 2013, 15, 19013–19018 RSC
 .
.
- X. Michalet, F. Pinaud, L. Bentolila, J. Tsay, S. Doose, J. Li, G. Sundaresan, A. Wu, S. Gambhir and S. Weiss, Science, 2005, 307, 538–544 CrossRef CAS PubMed .
- M. Nyk, R. Kumar, T. Y. Ohulchanskyy, E. J. Bergey and P. N. Prasad, Nano Lett., 2008, 8, 3834–3838 CrossRef CAS PubMed .
- P. Couleaud, V. Morosini, C. Frochot, S. Richeter, L. Raehm and J. O. Durand, Nanoscale, 2010, 2, 1083–1095 RSC .
- I. Díez and R. H. A. Ras, Nanoscale, 2011, 3, 1963–1970 RSC .
- J. Hui, X. Zhang, Z. Zhang, S. Wang, L. Tao, Y. Wei and X. Wang, Nanoscale, 2012, 4, 6967–6970 RSC .
- R. Jin, Nanoscale, 2010, 2, 343–362 RSC .
- X. Zhang, J. Hui, B. Yang, Y. Yang, D. Fan, M. Liu, L. Tao and Y. Wei, Polym. Chem., 2013, 4, 4120–4125 RSC .
- X. Zhang, M. Liu, B. Yang, X. Zhang, Z. Chi, S. Liu, J. Xu and Y. Wei, Polym. Chem., 2013, 4, 5060–5064 RSC .
- X. Zhang, X. Zhang, B. Yang, M. Liu, W. Liu, Y. Chen and Y. Wei, Polym. Chem., 2013, 4, 4317–4321 RSC .
- X. Zhang, C. Fu, L. Feng, Y. Ji, L. Tao, Q. Huang, S. Li and Y. Wei, Polymer, 2012, 53, 3178–3184 CrossRef CAS PubMed .
- X. Zhang, S. Wang, C. Fu, L. Feng, Y. Ji, L. Tao, S. Li and Y. Wei, Polym. Chem., 2012, 3, 2716–2719 RSC .
- X. Zhang, X. Zhang, B. Yang, M. Liu, W. Liu, Y. Chen and Y. Wei, Polym. Chem., 2014, 5, 399–404 RSC .
- X. Zhang, X. Zhang, B. Yang, L. Liu, J. Hui, M. Liu, Y. Chen and Y. Wei, RSC Adv., 2014, 4, 10060–10066 RSC .
- X. Zhang, S. Wang, C. Zhu, M. Liu, Y. Ji, L. Feng, L. Tao and Y. Wei, J. Colloid Interface Sci., 2013, 397, 39–44 CrossRef CAS PubMed .
- X. Zhang, X. Zhang, L. Tao, Z. Chi, J. Xu and Y. Wei, J. Mater. Chem. B, 2014, 2, 4398–4414 RSC .
- X. Zhang, J. Yin, C. Peng, W. Hu, Z. Zhu, W. Li, C. Fan and Q. Huang, Carbon, 2011, 49, 986–995 CrossRef CAS PubMed .
- X. Zhang, W. Hu, J. Li, L. Tao and Y. Wei, Toxicol. Res., 2012, 1, 62–68 RSC .
- B. Yang, Y. Zhang, X. Zhang, L. Tao, S. Li and Y. Wei, Polym. Chem., 2012, 3, 3235–3238 RSC .
- X. Cai, J. Hao, X. Zhang, B. Yu, J. Ren, C. Luo, Q. Li, Q. Huang, X. Shi and W. Li, Toxicol. Appl. Pharmacol., 2010, 243, 27–34 CrossRef CAS PubMed .
- X. Zhang, S. Wang, M. Liu, J. Hui, B. Yang, L. Tao and Y. Wei, Toxicol. Res., 2013, 2, 335–346 RSC .
- X. Zhang, J. Yin, C. Kang, J. Li, Y. Zhu, W. Li, Q. Huang and Z. Zhu, Toxicol. Lett., 2010, 198, 237–243 CrossRef CAS PubMed .
- D. Lin and B. Xing, Environ. Sci. Technol., 2008, 42, 5917–5923 CrossRef CAS .
- D. Lin and B. Xing, Environ. Sci. Technol., 2008, 42, 7254–7259 CrossRef CAS .
- G. Sheng, J. Li, D. Shao, J. Hu, C. Chen, Y. Chen and X. Wang, J. Hazard. Mater., 2010, 178, 333–340 CrossRef CAS PubMed .
- L. Wang, D. Zhu, L. Duan and W. Chen, Carbon, 2010, 48, 3906–3915 CrossRef CAS PubMed .
- X. Wang, C. Chen, W. Hu, A. Ding, a. Di Xu and X. Zhou, Environ. Sci. Technol., 2005, 39, 2856–2860 CrossRef CAS .
- D. Xu, X. Tan, C. Chen and X. Wang, J. Hazard. Mater., 2008, 154, 407–416 CrossRef CAS PubMed .
- H. C. Zhang, E. Q. Guo, Y. L. Zhang, P. H. Ren and W. J. Yang, Chem. Mater., 2009, 21, 5125–5135 CrossRef CAS .
- C. Chen and X. Wang, Ind. Eng. Chem. Res., 2006, 45, 9144–9149 CrossRef CAS .
- J. Chen, W. Chen and D. Zhu, Environ. Sci. Technol., 2008, 42, 7225–7230 CrossRef CAS .
- J. Hu, C. Chen, X. Zhu and X. Wang, J. Hazard. Mater., 2009, 162, 1542–1550 CrossRef CAS PubMed .
- M. Liu, X. Zhang, B. Yang, F. Deng, Z. Huang, Y. Yang, Z. Li, X. Zhang and Y. Wei, RSC Adv., 2014, 4, 35137–35143 RSC .
- H. Hyung, J. D. Fortner, J. B. Hughes and J. H. Kim, Environ. Sci. Technol., 2007, 41, 179–184 CrossRef CAS .
- G. Jia, H. Wang, L. Yan, X. Wang, R. Pei, T. Yan, Y. Zhao and X. Guo, Environ. Sci. Technol., 2005, 39, 1378–1383 CrossRef CAS .
- J. Wang, G. Zhou, C. Chen, H. Yu, T. Wang, Y. Ma, G. Jia, Y. Gao, B. Li and J. Sun, Toxicol. Lett., 2007, 168, 176–185 CrossRef CAS PubMed .
- W. Hu, C. Peng, W. Luo, M. Lv, X. Li, D. Li, Q. Huang and C. Fan, Acs Nano, 2010, 4, 4317–4323 CrossRef CAS PubMed .
- P. Zhang, Y. Ma, Z. Zhang, X. He, Z. Guo, R. Tai, Y. Ding, Y. Zhao and Z. Chai, Environ. Sci. Technol., 2012, 46, 1834–1841 CrossRef CAS PubMed .
- C.-W. Lam, J. T. James, R. McCluskey and R. L. Hunter, Toxicol. Sci., 2004, 77, 126–134 CrossRef CAS PubMed .
- D. B. Warheit, B. Laurence, K. L. Reed, D. Roach, G. Reynolds and T. Webb, Toxicol. Sci., 2004, 77, 117–125 CrossRef CAS PubMed .
- Y. Zhu, X. Zhang, J. Zhu, Q. Zhao, Y. Li, W. Li, C. Fan and Q. Huang, Int. J. Mol. Sci., 2012, 13, 12336–12348 CrossRef CAS PubMed .
- P. Wick, P. Manser, L. K. Limbach, U. Dettlaff-Weglikowska, F. Krumeich, S. Roth, W. J. Stark and A. Bruinink, Toxicol. Lett., 2007, 168, 121–131 CrossRef CAS PubMed .
- L. Dong, K. L. Joseph, C. M. Witkowski and M. M. Craig, Nanotechnology, 2008, 19, 255702 CrossRef PubMed .
- A. L. Alpatova, W. Shan, P. Babica, B. L. Upham, A. R. Rogensues, S. J. Masten, E. Drown, A. K. Mohanty, E. C. Alocilja and V. V. Tarabara, Water Res., 2010, 44, 505–520 CrossRef CAS PubMed .
- J. D. Reed, J. Anim. Sci., 1995, 73, 1516–1528 CAS .
- B. Espinasse, E. M. Hotze and M. R. Wiesner, Environ. Sci. Technol., 2007, 41, 7396–7402 CrossRef CAS .
- G. K. B. Lopes, H. M. Schulman and M. Hermes-Lima, Biochim. Biophys. Acta, 1999, 1472, 142–152 CrossRef CAS .
- R. Pulido, L. Bravo and F. Saura-Calixto, J. Agric. Food Chem., 2000, 48, 3396–3402 CrossRef CAS PubMed .
- C. Sánchez-Moreno, J. A. Larrauri and F. Saura-Calixto, J. Sci. Food Agric., 1998, 76, 270–276 CrossRef .
- Y. Yilmaz and R. T. Toledo, J. Agric. Food Chem., 2004, 52, 255–260 CrossRef CAS PubMed .
- X. Zhang, J. Ji, X. Zhang, B. Yang, M. Liu, W. Liu, L. Tao, Y. Chen and Y. Wei, RSC Adv., 2013, 3, 21817–21823 RSC .
- X. Zhang, M. Liu, Y. Zhang, B. Yang, Y. Ji, L. Feng, L. Tao, S. Li and Y. Wei, RSC Adv., 2012, 2, 12153–12155 RSC .
- M. Prato, K. Kostarelos and A. Bianco, Acc. Chem. Res., 2007, 41, 60–68 CrossRef PubMed .
- P. Bonnet, M. Gresil, H. Bizot, I. Riou, P. Bertoncini, A. Buleon and O. Chauvet, J. Nanopart. Res., 2010, 12, 545–550 CrossRef CAS .
- X. Peng, Y. Li, Z. Luan, Z. Di, H. Wang, B. Tian and Z. Jia, Chem. Phys. Lett., 2003, 376, 154–158 CrossRef CAS .
- R. W. M. Krause, B. B. Mamba, L. N. Dlamini and S. H. Durbach, J. Nanopart. Res., 2010, 12, 449–456 CrossRef CAS .
- N. V. Perez-Aguilar, E. Mu oz-Sandoval, P. E. Diaz-Flores and J. R. Rangel-Mendez, J. Nanopart. Res., 2010, 12, 467–480 CrossRef CAS .
- Q. Wang, X. Wang, Z. Chai and W. Hu, Chem. Soc. Rev., 2013, 42, 8821–8834 RSC .
- X. Zhang, X. Zhang, S. Wang, M. Liu, Y. Zhang, L. Tao and Y. Wei, ACS Appl. Mater. Interfaces, 2013, 5, 1943–1947 CAS .
- C. K. Najeeb, J.-H. Lee, J.-H. Kim and D. Kim, Colloids Surf., B Biointerfaces, 2013, 102, 95–101 CrossRef CAS PubMed .
- X. Zhang, Y. Zhu, J. Li, Z. Zhu, J. Li, W. Li and Q. Huang, J. Nanopart. Res., 2011, 13, 6941–6952 CrossRef CAS .
- Y. Zhu, W. Li, Q. Li, Y. Li, Y. Li, X. Zhang and Q. Huang, Carbon, 2009, 47, 1351–1358 CrossRef CAS PubMed .
- L. Xu, X. Zhang, C. Zhu, Y. Zhang, C. Fu, B. Yang, L. Tao and Y. Wei, J. Biomater. Sci., Polym. Ed, 2013, 24, 1564–1574 CrossRef CAS PubMed .
- H. Qi, M. Liu, L. Xu, L. Feng, l. Tao, Y. Ji, X. Zhang and Y. Wei, Toxicol. Res., 2013, 2, 427–433 RSC .
- X. Zhang, S. Wang, L. Xu, Y. Ji, L. Feng, L. Tao, S. Li and Y. Wei, Nanoscale, 2012, 4, 5581–5584 RSC .
- J. Li, Y. Zhu, W. Li, X. Zhang, Y. Peng and Q. Huang, Biomaterials, 2010, 31, 8410–8418 CrossRef CAS PubMed .
- M. Liu, X. Zhang, B. Yang, F. Deng, J. Ji, Y. Yang, Z. Huang, X. Zhang and Y. Wei, RSC Adv., 2014, 4, 22294–22298 RSC .
- T. Yokozawa, C. P. Chen, E. Dong, T. Tanaka, G. I. Nonaka and I. Nishioka, Biochem. Pharmacol., 1998, 56, 213–222 CrossRef CAS .
- J. Li, C. Chen, S. Zhang, X. Ren, X. Tan and X. Wang, Chem. – Asian J., 2014, 9, 1144–1151 CrossRef PubMed .
- B. Pan and B. Xing, Environ. Sci. Technol., 2008, 42, 9005–9013 CrossRef CAS .
- X. Wang, Y. Liu, S. Tao and B. Xing, Carbon, 2010, 48, 3721–3728 CrossRef CAS PubMed .
- J. Yin, C. Kang, Y. Li, Q. Li, X. Zhang and W. Li, Toxicol. Res., 2014, 3, 367–374 RSC .
- L. Guo, A. Von Dem Bussche, M. Buechner, A. Yan, A. B. Kane and R. H. Hurt, Small, 2008, 4, 721–727 CrossRef CAS PubMed .
- X. Liu, L. Guo, D. Morris, A. B. Kane and R. H. Hurt, Carbon, 2008, 46, 489–500 CrossRef CAS PubMed .
- X. Zhang, W. Hu, J. Li, L. Tao and Y. Wei, Toxicol. Res., 2012, 1, 62–68 RSC .
- X. Zhang, H. Qi, S. Wang, L. Feng, Y. Ji, L. Tao, S. Li and Y. Wei, Toxicol. Res., 2012, 1, 201–205 RSC .
- W. Qi, J. Bi, X. Zhang, J. Wang, J. Wang, P. Liu, Z. Li and W. Wu, Sci. Rep., 2014, 4 DOI:10.1038/srep04352 .
Footnote |
| † Electronic supplementary information (ESI) available: SEM images of CNTs, UV-Vis spectra of TA, cytotoxicity of TA, etc. See DOI: 10.1039/c4tx00066h |
|
| This journal is © The Royal Society of Chemistry 2015 |
Click here to see how this site uses Cookies. View our privacy policy here. 
 b,
Fengjie
Deng
a,
Cuiying
Zhou
a,
Junfeng
Hui
b,
Wanyun
Liu
a and
Yen
Wei
*b
b,
Fengjie
Deng
a,
Cuiying
Zhou
a,
Junfeng
Hui
b,
Wanyun
Liu
a and
Yen
Wei
*b