
 Open Access Article
 This Open Access Article is licensed under a
 Creative Commons Attribution 3.0 Unported Licence
Influence of fluorination in π-extended backbone polydiketopyrrolopyrroles on charge carrier mobility and depth-dependent molecular alignment†
C. J.
Mueller
a,
E.
Gann
bc,
C. R.
McNeill
c and
M.
Thelakkat
*a
aApplied Functional Polymers, Macromolecular Chemistry I, University of Bayreuth, 95440 Bayreuth, Germany. E-mail: mukundan.thelakkat@uni-bayreuth.de
bAustralian Synchrotron, 800 Blackburn Road, Clayton, VIC 3168, Australia
cDepartment of Materials Science and Engineering, Monash University, Wellington Road, Clayton VIC, 3800, Australia
First published on 4th August 2015
Abstract
A series of π-extended polydiketopyrrolo[3,4-c]pyrroles with a varying degree of fluorination on the thiophene–phenyl–thiophene comonomer was synthesized by Stille polycondensation. The influence of the degree of fluorination was studied with regard to the polymer properties, such as absorption, electrochemical redox potentials, the solid state structure as well as depth-dependent molecular alignment in thin films. Additionally, their performance in organic field effect transistors was evaluated. Whereas fluorination slightly increases the alkyl lamella and shrinks the π–π spacings, the coherence lengths were found to improve significantly in both directions. All polymers were found to be p-type materials when employed in organic field effect transistors (OFET). These devices can be tuned towards ambipolarity in the case of the tetrafluorinated copolymer upon thermal annealing.
Introduction
Diketopyrrolopyrrole (DPP) based materials are promising candidates for organic electronics due to their high ambipolar charge carrier mobilities, low optical gap and high absorption coefficient. Especially their use in organic field effect transistors (OFETs) has received considerable attention over the last few years. This is mainly due to their remarkable structural order1 leading to high planarity of the DPP moieties arising from strong intermolecular π–π interactions which promote charge transport.2,3The π–π interactions in DPP copolymers can be increased by side chain engineering4,5 or by incorporating planarizing aromatic units as comonomers into the backbone.6 Examples are long non-alkylated oligoaromatic units such as hexa- or heptathiophenes,7 vinylene-bridged bithiophenes or biselenophenes,4 as well as highly π-extended donating units consisting of thiophene, selenophene and phenyl moieties.8
Very recently it has been shown that comonomers with the thiophene–phenyl–thiophene (TPT) motif are especially promising candidates to facilitate highly planar, crystalline and aggregating DPP copolymers.8–10 In order to further promote the planarization of semiconducting polymers the exploitation of diffusive nonbonding heteroatom interactions has been employed.11 Two of those interactions are the hydrogen–fluorine and the hydrogen–oxygen interactions that help lock the conformation of the polymer backbone into a more planarized state. In low bandgap polymers, the influence of fluorination on regioselectivity of the resulting copolymer structure has also been reported.12 Not only fluorinated phenylene units have been shown to be valuable building blocks for semiconducting copolymers,13 but recently it has been shown that for the TPT motif, bifluorination or bialkoxylation of the central phenyl unit facilitates charge transport and leads to either preferred edge-on alignment in the case of fluorination or face-on alignment in the case of alkoxylation.9 On the other hand, a tetrafluorinated TPT derivative has been employed in oligomers14,15 as well as in DPP copolymers carrying furanyl flanking units by Sonar et al.16 and has been found to provide ambipolarity in OFET devices. It is hitherto unknown whether this ambipolarity is caused by the furanyl-flanking units or the tetrafluorination of the TPT. Therefore it is interesting, to study the effect of fluorination in the conventional DPP copolymers with thienyl flanking units. The impact of tetrafluorination in a TPT moiety on the rotational barrier has been studied by computational methods.17
In this contribution we report the synthesis of a series of three extended π-conjugated PDPPs by using a non-alkylated thiophene-n-fluorophenylene-thiophene (n = 0, 2, 4) unit as the comonomer. The crystalline depth-dependant alignment in thin films and the charge transport properties in OFET devices is studied with respect to the degree of fluorination in order to gain insight into the structure–property relationship of these π-extended systems and to evaluate the utility of fluorination in semiconducting polymers as a measure for improving semiconducting material properties. We also evaluate the various non-covalent interactions possible in these derivatives based on experimental crystallographic data of the building blocks.
Results and discussion
Synthesis
The synthesis of the stannylated TPT-comonomers is summarized in Fig. 1. For the nonfluorinated TPT unit 4a a synthesis route which has been published for the bis(tributyltin)-analogs18,19 was adapted. For the difluorinated compound 4b as well as the tetrafluorinated 4c, a direct lithiation from 2b and 2c, respectively, has been reported.16,20 We found that monostannylated compounds that are obtained as byproducts from direct lithiation of 2a–c are difficult to separate even by multiple recrystallizations and sublimations. Therefore we adopted a different synthetic route involving first bromination followed by lithiation and stannylation to obtain 4b and 4c. The almost quantitative conversion achieved in this bromination route employed here results in high monomer purities. Therefore, this bromination route was employed for all the three stannylated DPP derivatives. In detail, starting from the 1,4-dibrominated phenylene compounds 1a–c a Stille coupling was employed to obtain the TPT blocks 2a–c. Subsequent bromination with NBS in DMF yielded the dibrominated TPT blocks 3a–c in good yields, especially for the fluorinated derivatives where the yield was 80–95%. Lithiation of 3a–c in THF at −78 °C followed by quenching with trimethyltin chloride gave the desired monomers 4a–c. For the fluorinated compounds 4b and 4c the stannylation was quantitative. For all three monomers it should be noted that purification is feasible by crystallization due to the high crystallinity of the obtained compounds.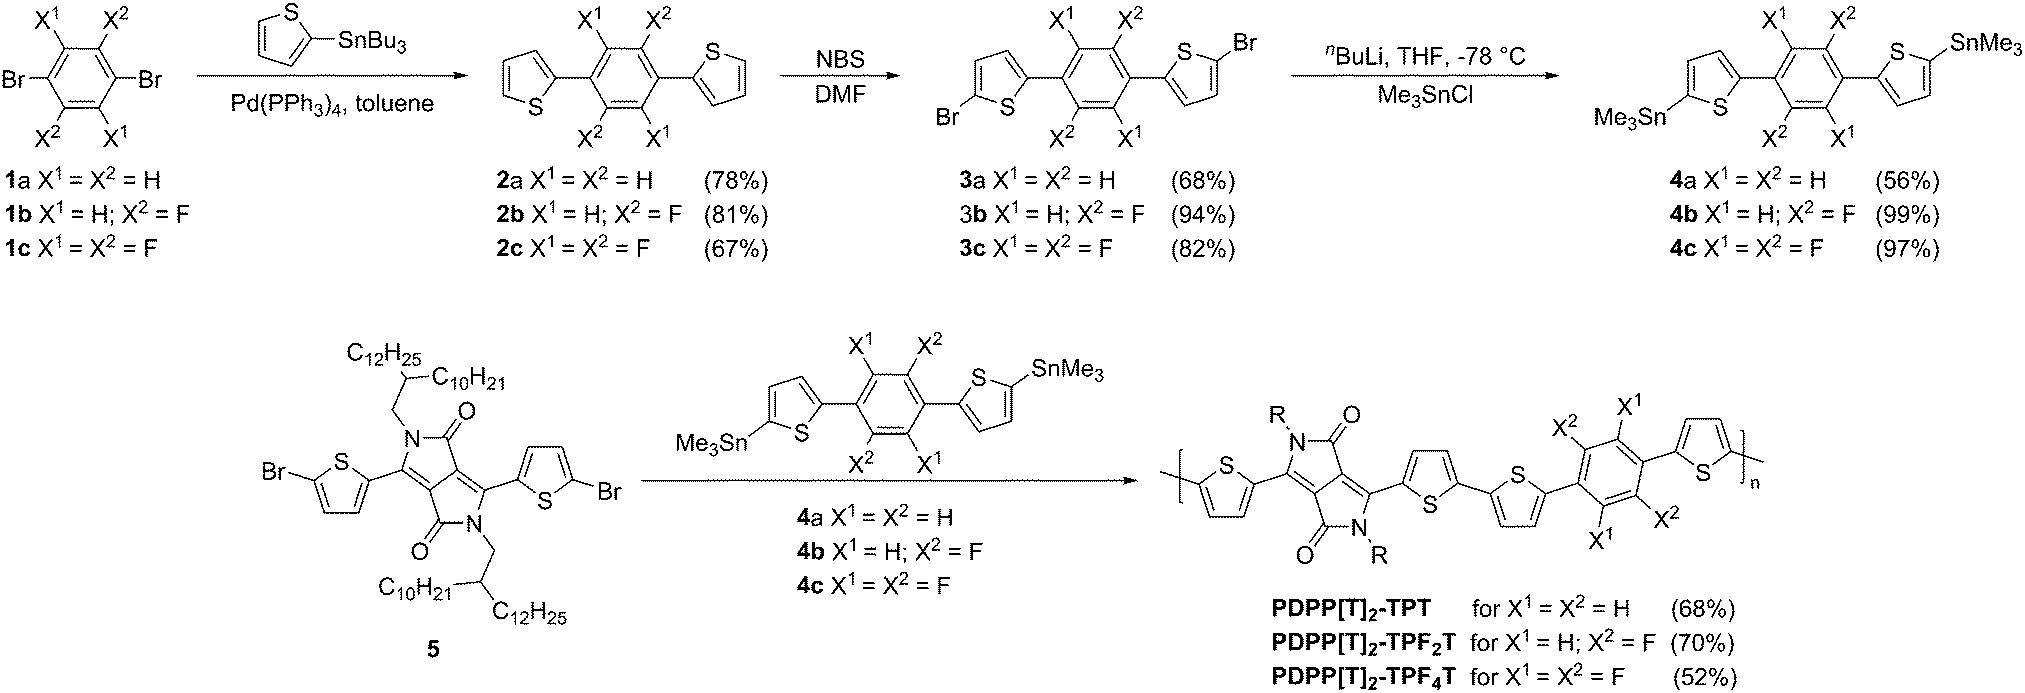 | ||
| Fig. 1 Syntheses of the thiophene–phenyl–thiophene monomers with different degrees of fluorination. Experimental details are given in the ESI.† Synthesis of the extended PDPP–TPFnT copolymers by Stille-polycondensation. All yields are given in parentheses. | ||
The thienyl-DPP monomer 5 was synthesized following a literature procedure,21 which was adapted to increase the yield and purity. Polymerizations were carried out in chlorobenzene at 180 °C under microwave conditions using Pd2(dba)3 with P(o-Tol)3 as the catalytic system.22 The resulting polymers are named after their respective DPP aryl flanking units [Ar] and comonomer Mco (see Fig. 2).23 All polymers were endcapped with thiophene on both ends. Detailed procedures are given in the Experimental section. All polymers were obtained in high number average molecular weights (Mn) in the range of 20![[thin space (1/6-em)]](https://www.rsc.org/images/entities/char_2009.gif) 400–38100 kg mol−1 and dispersities (Đ) between 1.9 and 2.3 (Table 1). The individual GPC traces are given in the ESI† (Fig. S1–S3, ESI†) and show a monomodal distribution for every polymer. All polymerizations were carried out using similar conditions regarding concentrations, degree of monomer purities, temperatures and catalytic system. All compounds were polymerized to the precipitation limit in chlorobenzene at 180 °C. The molecular weight of the fluorinated polymers is therefore smaller due to the lower solubility of these polymers upon introduction of fluorine groups.
400–38100 kg mol−1 and dispersities (Đ) between 1.9 and 2.3 (Table 1). The individual GPC traces are given in the ESI† (Fig. S1–S3, ESI†) and show a monomodal distribution for every polymer. All polymerizations were carried out using similar conditions regarding concentrations, degree of monomer purities, temperatures and catalytic system. All compounds were polymerized to the precipitation limit in chlorobenzene at 180 °C. The molecular weight of the fluorinated polymers is therefore smaller due to the lower solubility of these polymers upon introduction of fluorine groups.
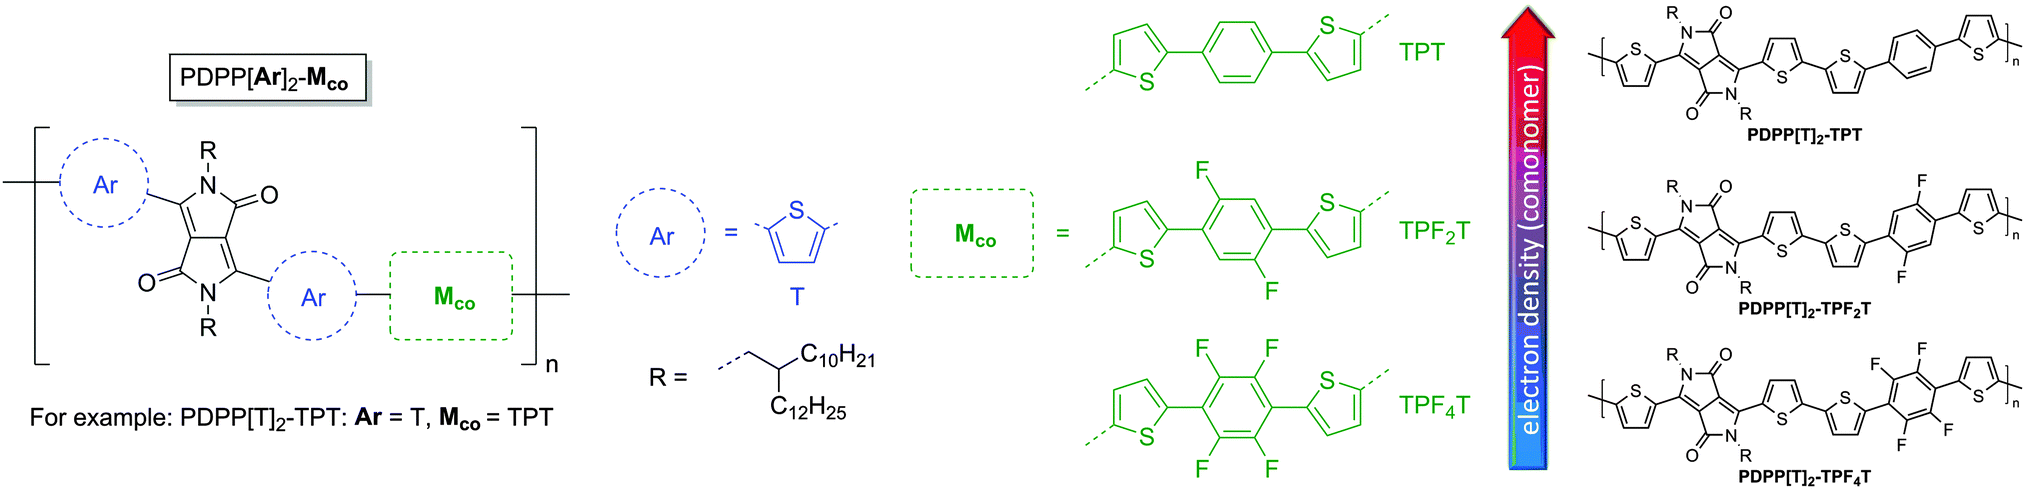 | ||
| Fig. 2 Structures of the new extended PDPP[T]2–TPFnT polymers in order of the overall electron density. R = 2-Decyltetradecyl (C10/C14). The systematic nomenclature of the DPP copolymers is adopted from our earlier publication.23 | ||
| Polymer | M n [kg mol−1] | M w [kg mol−1] | Đ | DPnc | T 5% [°C] | T m [°C] | T c [°C] | IPf [eV] | EAg [eV] | E CV [eV] | E opt [eV] |
|---|---|---|---|---|---|---|---|---|---|---|---|
| a Determined by GPC at 150 °C using 1,2,4-trichlorobenzene as the eluent. b Dispersity. c Degree of polymerization calculated from Mn. d Decomposition onset (5%) determined by TGA. e Average Flash-DSC peak melting temperature (Tm) and crystallization temperature (Tc) at −200 K s−1. f Ionisation potential (HOMO). g Electron affinity (LUMO). h Band-gap determined by cyclic voltammetry in thin film. i Optical gap determined from absorption onset in film. | |||||||||||
| PDPP[T]2–TPT | 38.1 | 71.4 | 1.9 | 31 | 389 | 307 | 253 | −5.69 | −3.61 | 2.08 | 1.51 |
| PDPP[T]2–TPF2T | 24.5 | 53.1 | 2.2 | 20 | 406 | 337 | 289 | −5.72 | −3.60 | 2.12 | 1.46 |
| PDPP[T]2–TPF4T | 20.4 | 47.2 | 2.3 | 16 | 394 | 344 | 303 | −5.89 | −3.97 | 1.92 | 1.47 |
This behaviour has been reported before and is ascribed to the higher degree of aggregation occurring in fluorinated conjugated polymers.24 However, all three polymers are soluble and processable from chloroform. It has been shown earlier by Janssen et al. that the aggregation behaviour in PDPPs plays a significant role in determining alignment in thin film and the morphology of polymer/fullerene blends. Furthermore it was shown that these effects can be influenced by either tuning the solubilizing alkyl sidechains5 or the aromatic units along the backbone.6
Thermogravimetric analysis (see ESI,† Fig. S6) shows very high decomposition onsets T5% around 400 °C for all three derivatives, as is common for PDPPs.
The melting points of PDPPs are usually very high and close to their respective decomposition onsets which makes them difficult to observe using conventional dynamic scanning calorimetry (DSC). We therefore evaluated the thermal properties of these three polymers using a Flash-DSC setup with heating rates from 50 K s−1 to 1000 K s−1. The representative 200 K s−1 heating and cooling curves are shown in Fig. 4b and the individual heating and cooling curves for all scan rates are shown in the ESI† (Fig. S4). The respective melting points determined from the average peak value for the different ramping speeds are summarized in Table 1. The nonfluorinated PDPP[T]2–TPT shows the lowest melting temperature (307 °C) whereas fluorination leads to increased melting temperatures of 337 °C and 344 °C for the di- and tetrafluorinated copolymers, respectively. This is in accordance with our previous reasoning on differences in molecular weight due to increased aggregation in the fluorinated polymers. Crystallization temperatures are rate-dependant due to the kinetic nature of crystallization. The crystallization temperatures derived from the −200 K s−1 cooling curve given in Table 1 are exemplary and show the same trend as the melting temperatures (Fig. 4b).
The optical properties of the three polymers were investigated by absorption as well as photoluminescence measurements. The individual solution as well as solid-state spectra are shown in Fig. 3.
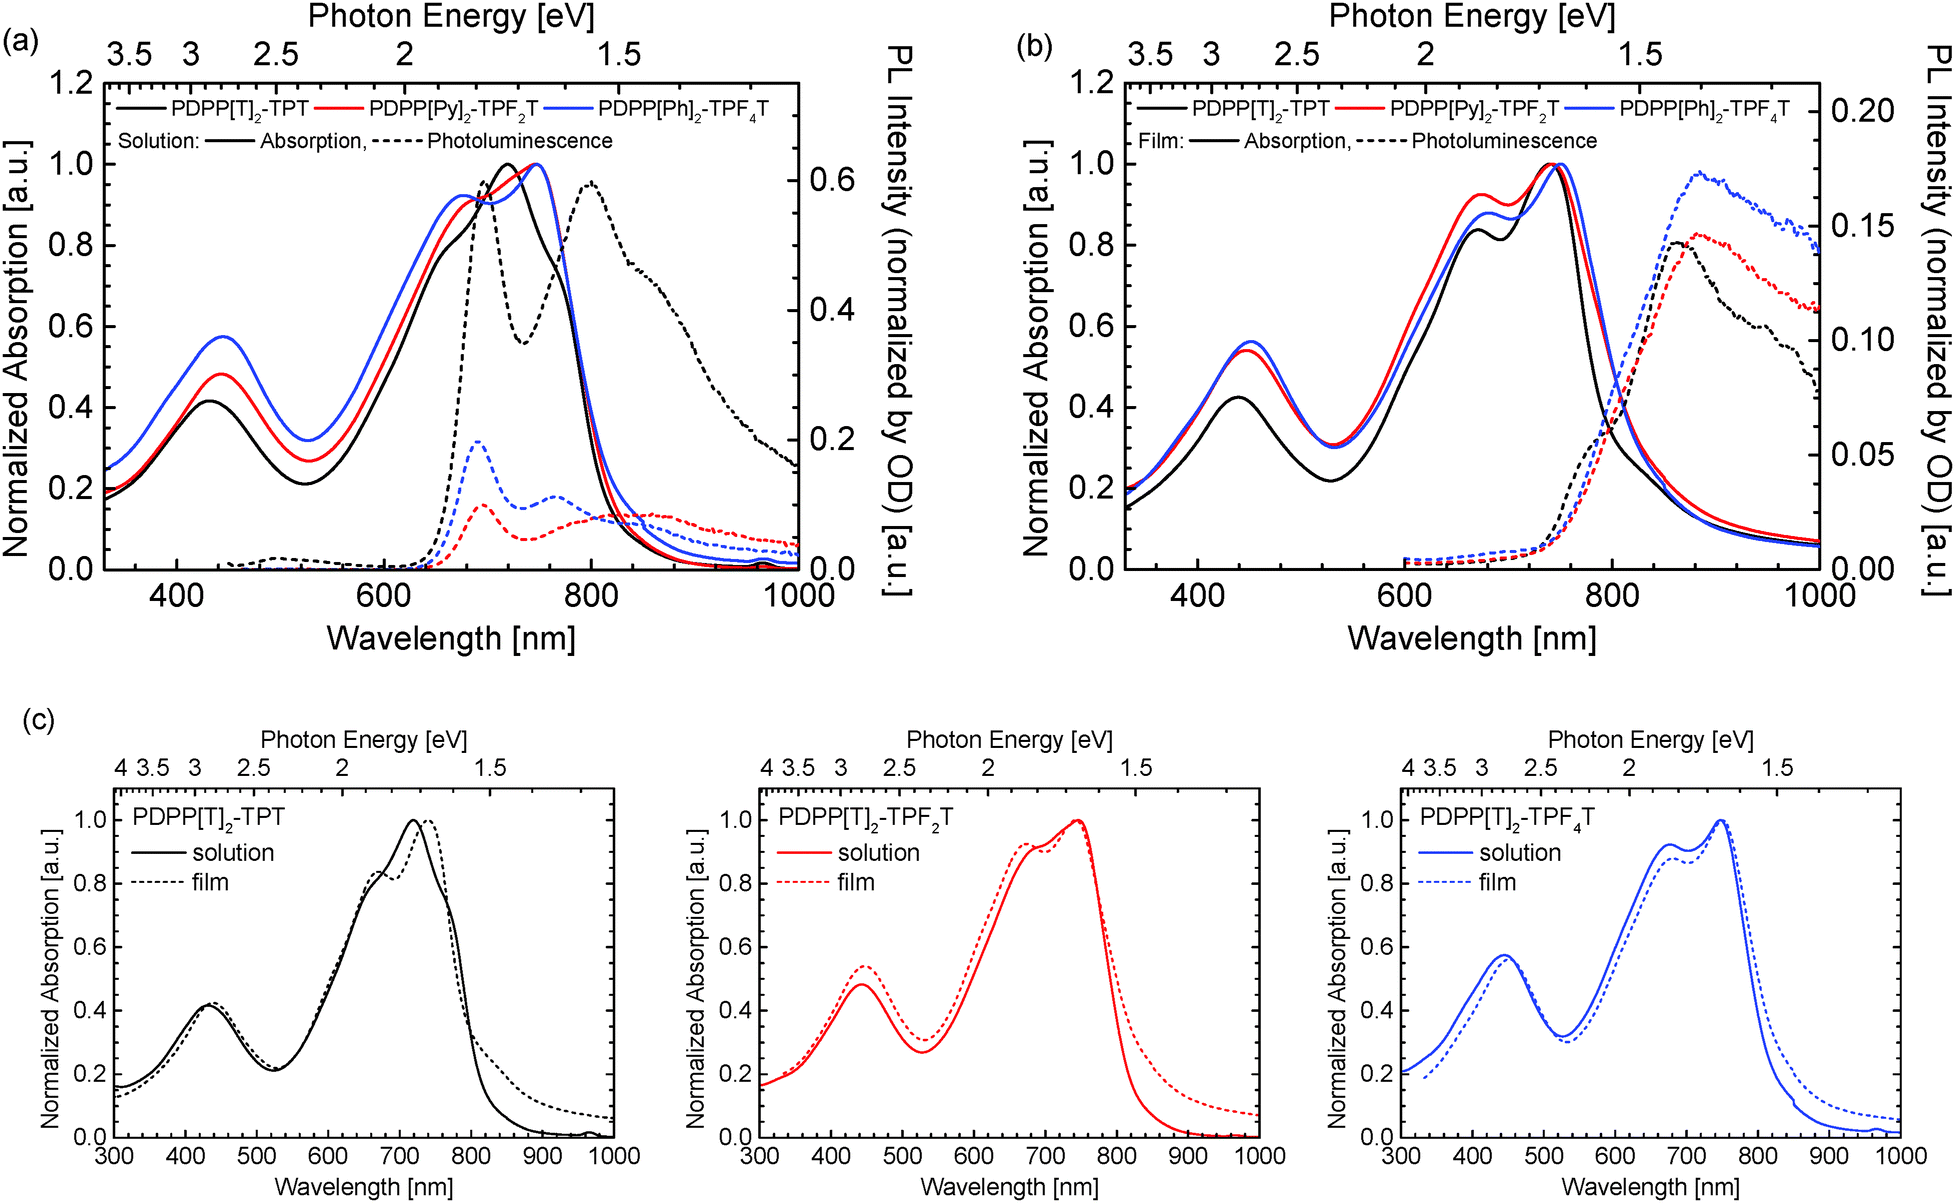 | ||
| Fig. 3 Absorption and photoluminescence data for the PDPP[T]2–TPFnT copolymers measured in (a) chloroform solution and in (b) film. A comparison of solution and film absorption spectra is shown in (c). | ||
All three polymers show similar absorption patterns and an almost identical optical gap of 1.5 eV (see Table 1). When comparing the individual solution spectra (Fig. 3a), a slight shift in peak positions for the visible absorption band becomes observable, which is not apparent in the solid state spectra (Fig. 3b). More specifically, when comparing the solution and film absorption spectra of the three individual compounds (Fig. 3c), a notable change in absorption behaviour is observed only by the non-fluorinated PDPP[T]2–TPT. Upon di-fluorination in PDPP[T]2–TPF2T, the solution and thin film spectra become much more similar. Finally, for the tetrafluorinated PDPP[T]2–TPF4T both absorption curves are more or less identical. We ascribe this behaviour to the strong aggregation of the fluorinated polymers and the presence of aggregates in the solutions that don't differ significantly from those finally formed in film. This finding is supported by the fact that the photoluminescence intensity for PDPP[T]2–TPT in solution is stronger by a factor of about 3 than those from the fluorinated counterparts PDPP[T]2–TPF2T and PDPP[T]2–TPF4T. This photoluminescence quenching is again ascribed to the strong aggregation of the fluorinated polymers in solutions. In thin film, when all the three polymers show the absorption spectrum of the aggregated species, the photoluminescence intensity is comparable for all three polymers.
Oxidation and reduction potentials of the individual polymers were studied by cyclic voltammetry. The individual cyclic voltammograms are shown in ESI† (Fig. S5). The energy levels of the polymers were calculated from the redox half step potentials calibrated against ferrocene in acetonitrile, for which a work function of −5.23 eV for the ferrocene/ferrocenium redox couple is taken from literature.25 All potentials were obtained using a standard three-electrode cyclic voltammetry setup. Polymers were spincoated onto ITO glass slides which were used as the working electrode and measurements were carried out in solutions containing a 0.1 M tetra-n-butylammonium hexafluorophosphate/acetonitrile electrolyte solution at a scan rate of 100 mV s−1. The values for the ionization potential (IP), which closely resembles the highest occupied molecular orbital (HOMO) as well as the electron affinity (EA), which resembles the lowest unoccupied molecular orbital (LUMO) are summarized in Table 1 and comparatively shown in Fig. 4.26 Interestingly, when compared to the nonfluorinated PDPP[T]2–TPT (IP: −5.69 eV, EA: 3.61 eV), difluorination in PDPP[T]2–TPF2T only has a negligible effect on both, IP (−5.72 eV) and EA (−3.60 eV). The fundamental bandgap ECV of 2.1 eV is therefore also identical for both polymers. Upon introduction of two more fluorine atoms yielding PDPP[T]2–TPF4T a clear shift of both energy levels towards lower values can be observed, resulting in an IP of −5.89 eV and an EA of −3.97 eV as well as a fundamental bandgap of 1.92 eV. Compared to the optical gap these values are significantly larger, which can be taken as an indicator for large a large exciton binding energy Eb in these polymers.26
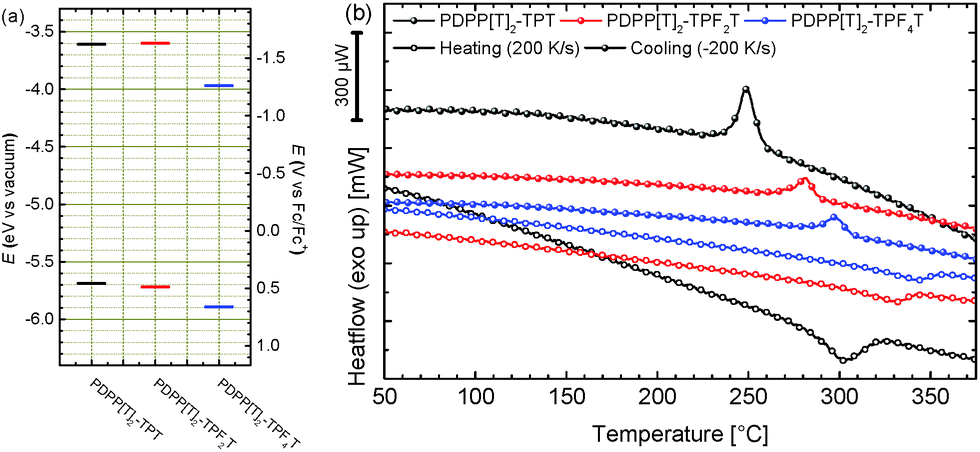 | ||
| Fig. 4 (a) Energy level comparison for the extended backbone DPP copolymers with a varying degree of fluorination. Values are determined by cyclic voltammetry in thin film; (b) Flash-DSC curves for 200 K s−1 heating/cooling rates. See ESI† (Fig. S5) for additional scan rates. | ||
Influence of fluorination on backbone planarization: weak non-covalent interactions
There are several contradictory reports in the recent literature on the origin and the exact conformation that are caused by heteroatom interactions. Whereas elaborate theoretical work by Ratner et al. based on quantum chemical calculations mainly favours hydrogen–heteroatom interactions such as H⋯F, H⋯O, H⋯S etc., several reports claim that S⋯F and O⋯F interactions influence the planarization of semiconducting polymer backbones.9,27 It has also been reported, that the interaction between heteroatoms such as S⋯F and O⋯F are nearly zero.11We like to emphasize, that for most of the motifs employed in these polymers, experimental structural data for building blocks is available from single crystal crystallography. We therefore analysed the Cambridge Crystallographic Database Centre (CCDC) library for the various low molecular weight TPT motifs with different degrees of fluorination on the central phenyl moiety. The experimental data supports the model that has been theoretically established by Ratner et al., i.e. for the difluorinated TPF2T unit the fluorine atoms on the phenyl ring point towards the hydrogen atoms of the adjacent thiophene units.14 This experimental evidence does not support the proposed S⋯F interactions in TPF2T, as reported in literature.9
GIWAXS
Crystalline packing within the polymer thin films was investigated with Grazing Incidence Wide Angle X-ray Scattering (GIWAXS), see Fig. 5. Exposures were taken at incident angles between 0.05 and 0.4 degrees at a resolution of 0.01 degrees near the critical angle ∼0.17 degrees, to capture the highest intensity critical angle scattering, as well as some depth sensitive information (as shown in Fig. 6).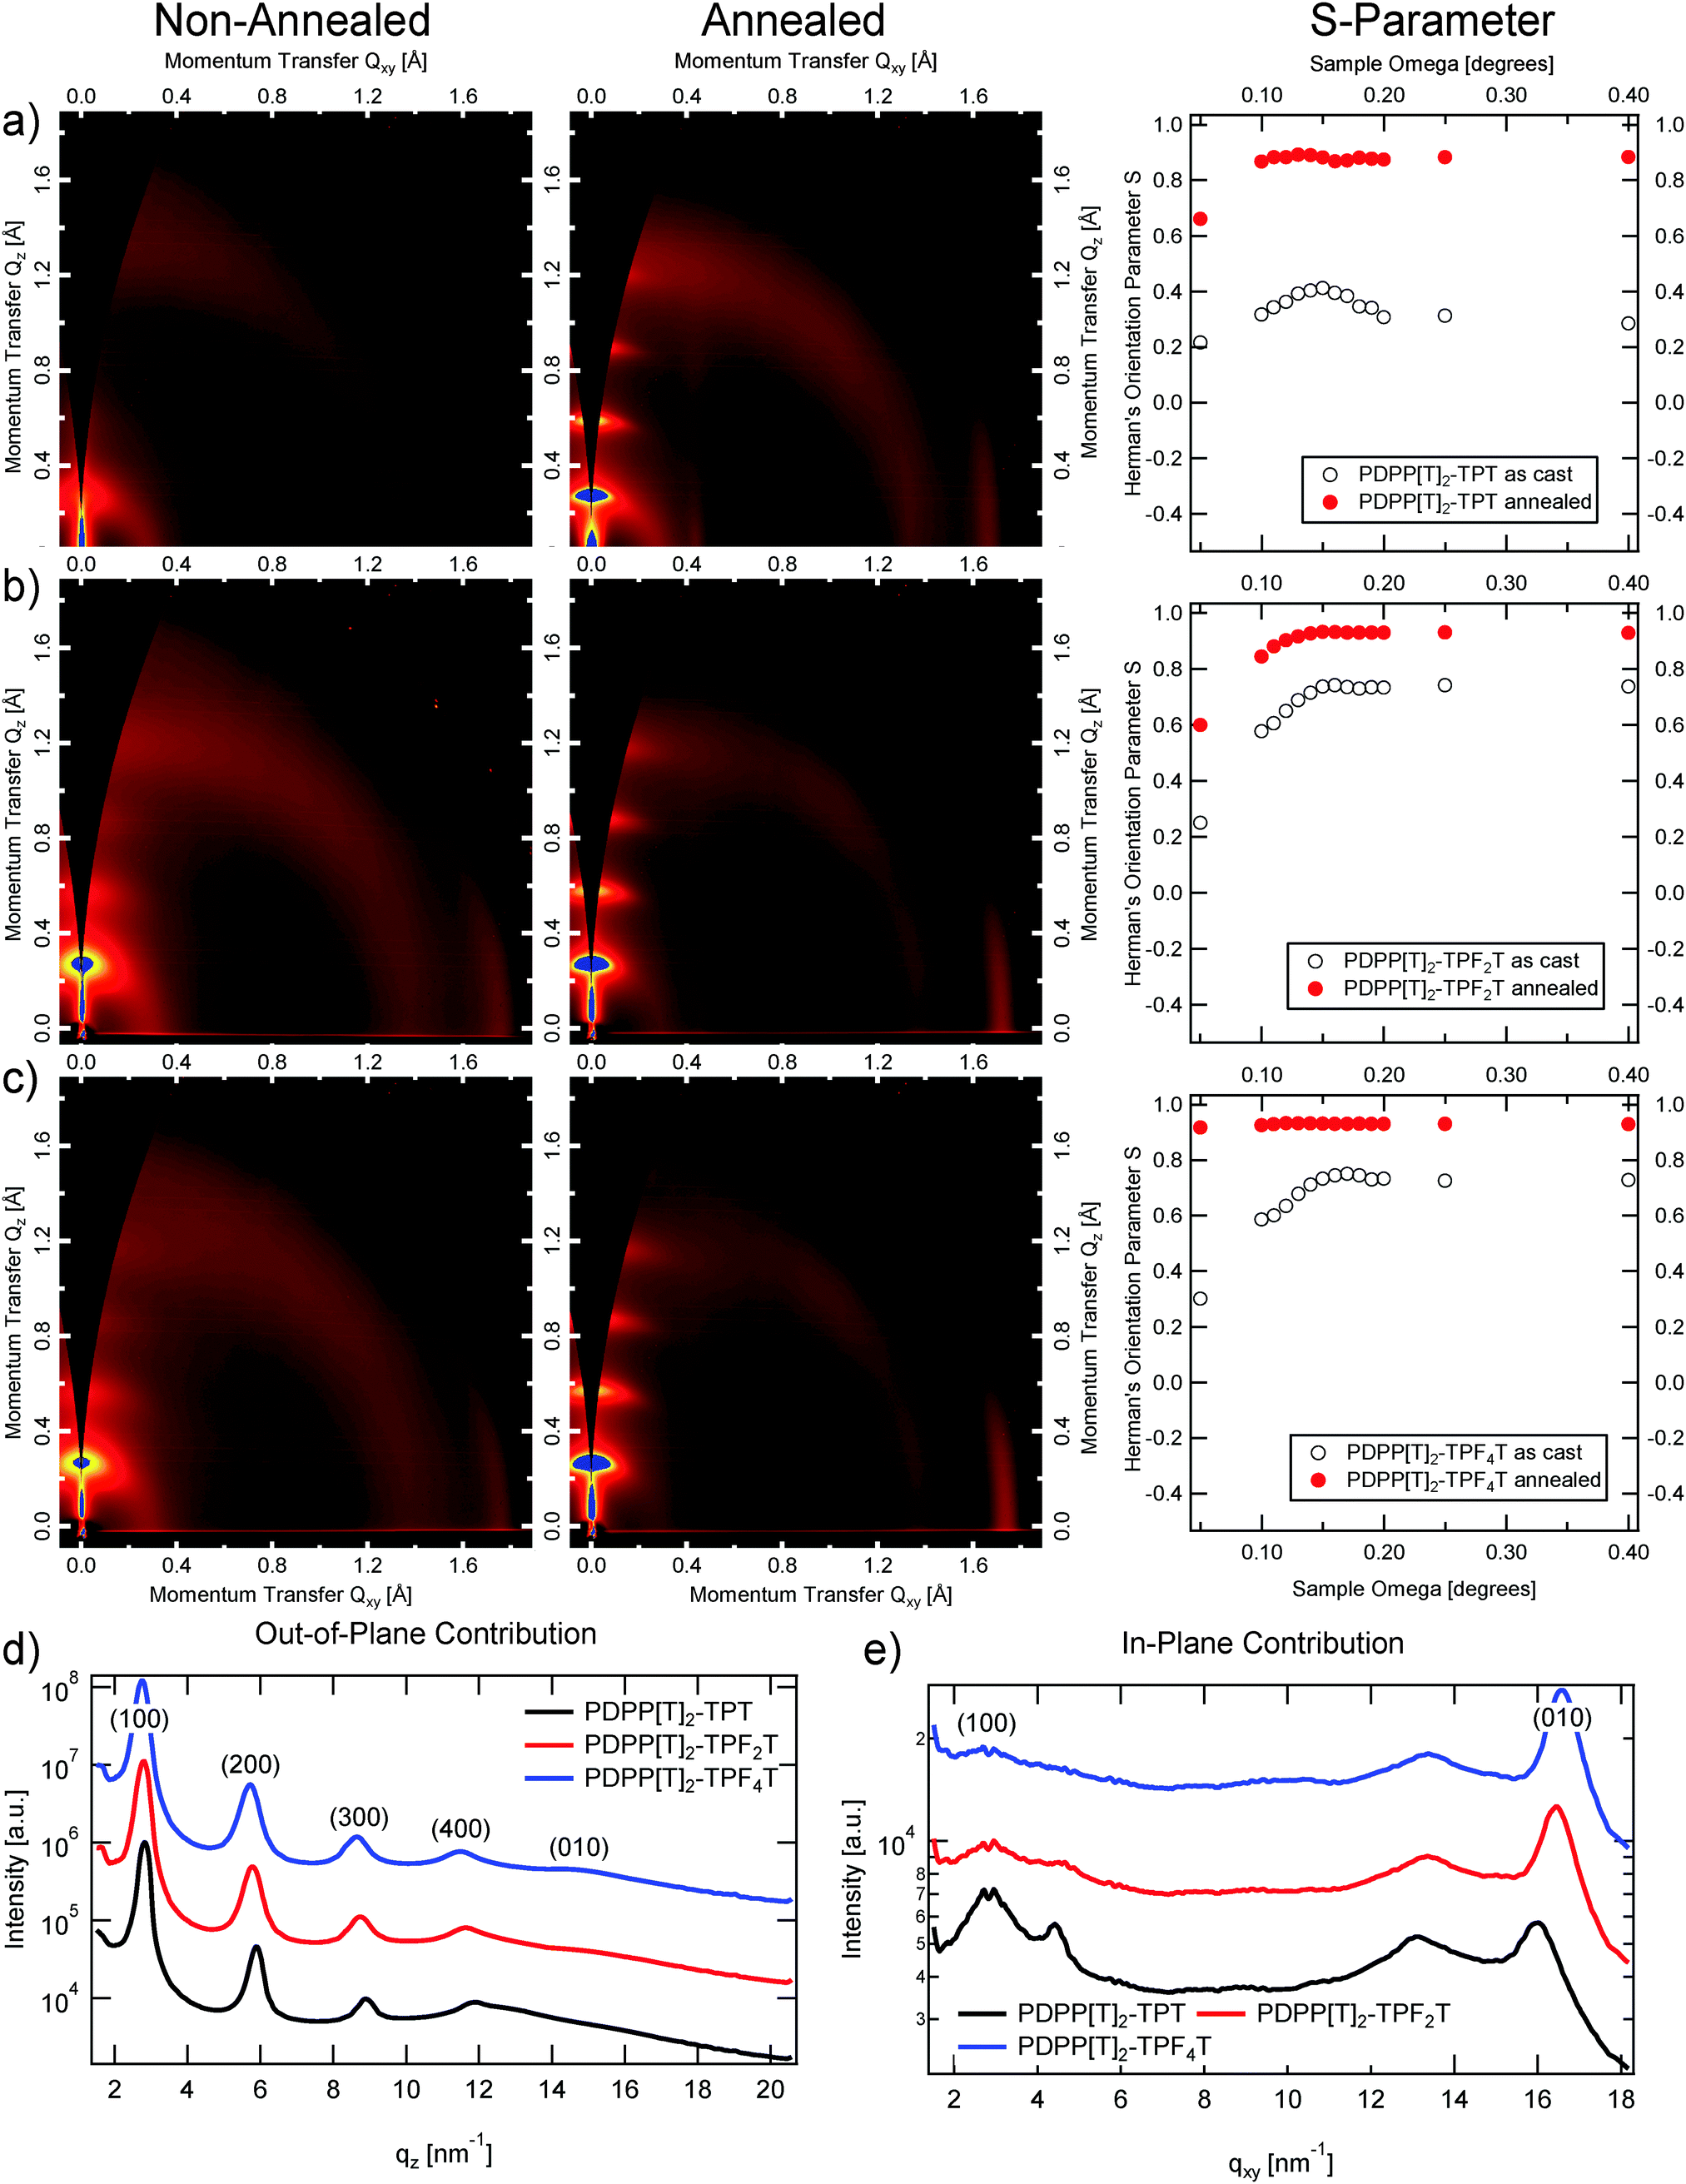 | ||
| Fig. 5 From left to right, the unannealed, and annealed 2D GIWAXS Patterns followed by the Herman's orientation parameter vs. incident angle. From top to bottom: (a) PDPP[T]2–TPT, (b) PDPP[T]2–TPF2T, and (c) PDPP[T]2–TPF4T; (d) out-of-plane contribution for the annealed polymers; (e) in-plane contribution for the annealed polymers. | ||
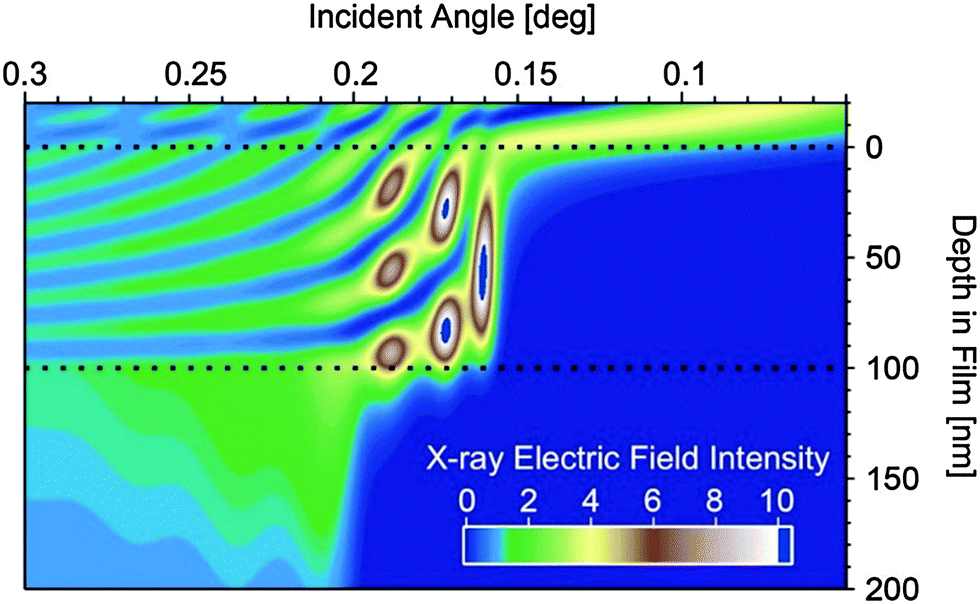 | ||
| Fig. 6 The calculated X-ray electric field intensity for a 100 nm thick film on Si. The area between the dotted black lines represents the polymer film. The critical angle at approximately 0.16–0.17 degrees is seen by the sudden large enhancement of electric field intensity within the polymer film. The critical angle of the lower Si substrate can be seen at ∼0.2 degrees, at which point the X-ray electric field intensity becomes much more uniform throughout the film and substrate. At angles below the critical angle, the electric field intensity within the film is entirely at the surface, within the top ∼10 nm. | ||
All scattering patterns show clear alkyl lamella stacking, that is backbone to backbone across the alkyl side chains, and π–π stacking, from one molecular face to the next. All polymers exhibit liquid crystalline, semi-crystalline diffraction pattern, with little to no mixed index peaks (peaks away from purely out-of-plane or in-plane), indicating that the elements are largely stacking one dimensionally along different directions, and not forming three dimensional crystals. Additionally, all the polymers exhibit a generally edge-on orientation, with alkyl stacking largely out-of-plane and π–π stacking in-plane.
We can see that the effect of annealing in all cases is the intensification and sharpening of the peaks, with several orders of alkyl lamella stacking apparent, indicating increased crystallinity and larger crystalline domains present within the annealed films. The degree of orientational alignment is quantified by the Herman's orientation parameter28 which runs from −0.5 (face-on orientation) to 1 (edge on orientation), of the first order alkyl stacking peak, plotted in the right most column of Fig. 5(a–c). We can see at once that the unannealed films are less well oriented, however all films still have an average edge-on structure. Upon annealing, the orientation is strengthened in all cases towards almost perfect edge on orientation.
To understand the angular dependence of the Hermans parameter vs. angle, the electric field intensity of the X-ray beam is calculated vs. angle and depth within a 100 nm thick polymer film as shown in Fig. 6. Depths greater than 100 nm represent the silicon substrate, while depths less than 0 represent the ambient environment. Scattering from any depth within the film is proportional to the X-ray electric field intensity at that depth. Thus, at incident angles less than the critical angle (∼0.16 degrees in the simulation) X-rays scatter exclusively from the upper ∼10 nm of the surface of the polymer film, while between the critical angle of the polymer film and the critical angle of the silicon substrate (∼0.2 degrees) the location and intensity of scattering originates from deeper within the film. Finally, above the critical angle of the substrate, the electric field intensity becomes much more even throughout the entire system, averaging out to an intensity of 1 at very high angles. Thus looking at the angular dependence of the Herman's orientation parameter in Fig. 5, we can conclude that for all of the unannealed films, as well as for the annealed PDPP[T]2–TPT and PDPP[T]2–TPF2T films, the surface region of the samples are less well oriented than the bulk of the film. For PDPP[T]2–TPF4T, on the other hand, the exceptionally high degree of edge-on alignment extends all through the surface upon annealing. Sector averages of the out-of-plane (vertical, Qz) and in-plane (horizontal, Qxy) directions of the annealed polymer films are shown in Fig. 5d, and the results of fitting the alkyl stacking lamella peaks and π–π stacking peaks is shown in Table 2.
| Polymer | T | d alkyl [nm] | ζ alkyl , [nm] | d π–π [nm] | ζ π–π , [nm] |
|---|---|---|---|---|---|
| a Annealing process. b Alkyl spacing. c Alkyl stacking coherence length. d π–π stacking spacing. e π–π stacking coherence length. f The crystal coherence length ζ gives information about the distance over which order is maintained and is defined as ζ = 2π/FWHM, where FWHM is the full width at half maximum of the first order lamellar stacking or π–π stacking peak, respectively. It is related to the Scherrer equation, which connects the width of a peak to the crystal size. | |||||
| PDPP[T]2–TPT | As cast | 2.3(1) | 5.1(1) | 0.395(3) | 2.6(5) |
| PDPP[T]2–TPT | 250 °C | 2.15(5) | 22.3(1) | 0.392(1) | 5.2(1) |
| PDPP[T]2–TPF2T | As cast | 2.2(1) | 8.25(5) | 0.375(1) | 5.4(1) |
| PDPP[T]2–TPF2T | 250 °C | 2.2(1) | 19.3(1) | 0.381(1) | 7.6(1) |
| PDPP[T]2–TPF4T | As cast | 2.22(5) | 7.82(3) | 0.377(1) | 5.3(1) |
| PDPP[T]2–TPF4T | 250 °C | 2.2(1) | 18.9(1) | 0.378(1) | 8.1(1) |
We can see that the process of annealing increases the coherence lengths of both types of stacking, but particularly in the alkyl stacking direction, where the coherence length increases by a factor of 4 in the case of PDPP[T]2–TPT, whereas the increase is only by a bit more than a factor of 2 for both fluorinated polymers. It is clear that the addition of fluorine to the backbone decreases the stacking distance, with the annealed PDPP[T]2–TPF4T film having the smallest of the annealed π–π stacking distances. In the case of the unannealed films, fluorination yields distinctly smaller π–π stacking values. With the alkyl lamella stacking stretching out at the same time upon fluorination, a general flattening of the unit cell can be deduced.
Charge carrier mobilities
To investigate the influence of the degree of fluorination on the charge carrier mobilities, the polymers were investigated in organic field effect transistor (OFET) devices using a bottom gate/bottom contact (BGBC) configuration. Details on the device preparation and charge carrier mobility determination are given in the Experimental section.As typical examples, the I–V transfer as well as output curves for the non-fluorinated PDPP[T]2–TPT and the tetrafluorinated PDPP[T]2–TPF4T are shown in Fig. 7 and the mobility values are summarized for different annealing conditions in Table 3. The I–V curves for PDPP[T]2–TPF2T are given in the ESI† (Fig. S9). A comparison of the output curves for all polymers in n-channel operation can also be found in the ESI† (Fig. S10), giving an overview of the output currents in different scales. For the as cast films as well as for annealed films up to 250 °C, no n-channel behavior was observable. For the p-type devices, the threshold voltage was 0 V for all devices and the non-fluorinated PDPP[T]2–TPT shows the highest hole mobility (μh = 2.3 × 10⁻² cm2 V−1 s−1). Difluorination leads to a fivefold decrease in hole mobility whereas tetrafluorination in PDPP[T]2–TPF4T results in a decrease of one order of magnitude in hole mobility (2.6 × 10⁻³ cm2 V−1 s−1). This decrease in μh stands in contrast to the alignment of the as cast films which is much higher for the fluorinated derivatives as discussed in the GIWAXS section. Although surface alignment plays a crucial role in OFET devices, it is important to note that high hole mobilities are influenced by the electron-richness of the polymer as well as the quality of the dielectric–semiconductor interface. As already discussed, the S⋯F interaction in general is supposed to help planarization of the polymer backbone11 which is also in agreement with the structural data from single crystals of the incorporated oligomers.14,15,29–31 In a series of fluorinated DPP copolymers, we have earlier shown that fluorination mainly improves the n-type character of semiconducting polymers or leads to ambipolarity in otherwise exclusively p-type materials.23
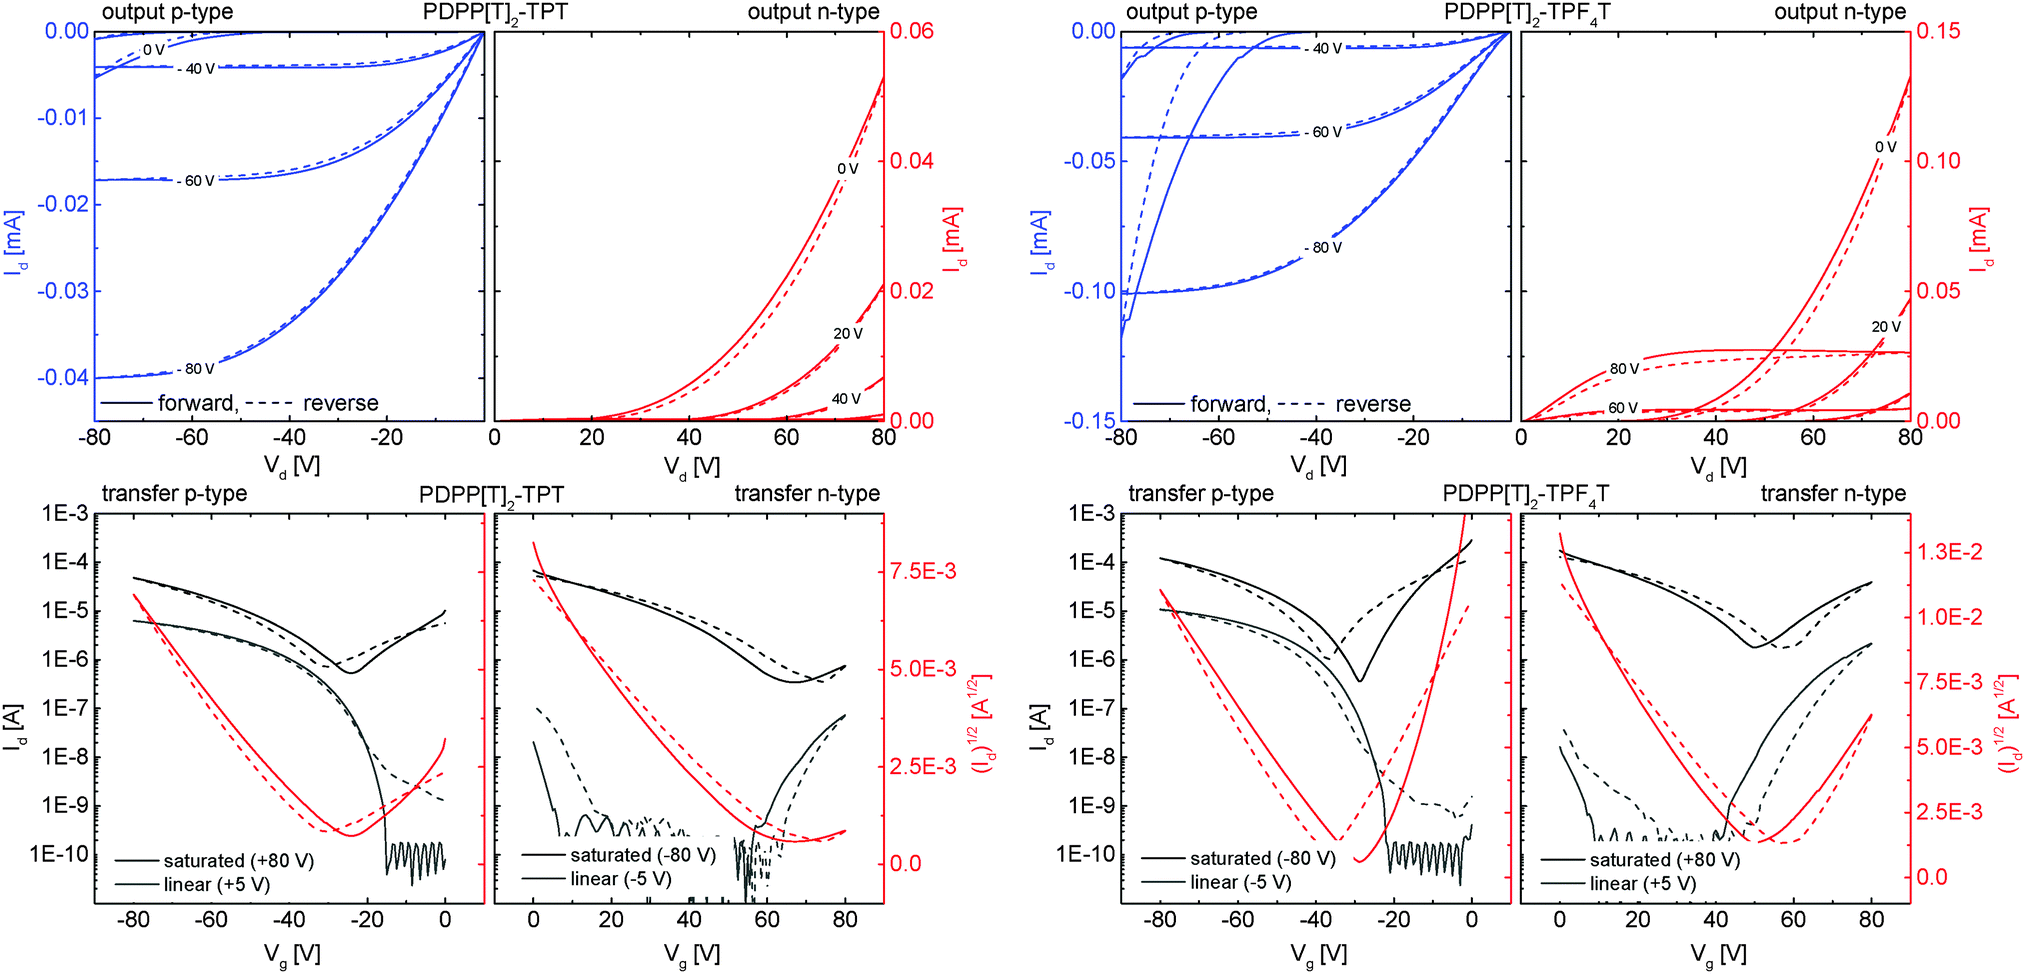 | ||
| Fig. 7 Representative OFET I–V curves in p-channel (blue output) and n-channel (red output) operation for the non-fluorinated PDPP[T]2–TPT (left) and the tetrafluorinated PDPP[T]2–TPF4T (right) after annealing at 350 °C. Solid lines represent forward scans, dashed lines the reverse scans in all graphs. In transfer curves (bottom), the black and gray plots indicate the transfer characteristics in the saturation and linear operation regime, respectively. I–V curves for the difluorinated PDPP[T]2–TPF2T as well as a scaled comparison of the n-output characteristics for all three polymers are given in the ESI† (Fig. S9 and S10). | ||
| Polymer | As cast | Annealedb 200 °C | Annealedb 250 °C | Annealedb 300 °C | Annealedb 350 °C | |
|---|---|---|---|---|---|---|
| μ h [cm2 V−1 s−1] | μ h [cm2 V−1 s−1] | μ h [cm2 V−1 s−1] | μ h [cm2 V−1 s−1] | μ h [cm2 V−1 s−1] | μ e [cm2 V−1 s−1] | |
| a Hole (μh)/electron (μe) mobilities determined from saturated operation regime. All values were averaged over a minimum of 10 devices. b Annealing was performed for 15 min in a nitrogen atmosphere. See ESI (Table S2) for threshold voltages and on/off ratios. | ||||||
| PDPP[T]2–TPT | (2.3 ± 0.4) × 10−2 | (4.1 ± 1.2) × 10−2 | (2.6 ± 0.9) × 10−2 | (5.8 ± 0.7) × 10−2 | (3.7 ± 3.4) × 10−3 | (2.0 ± 0.9) × 10−4 |
| PDPP[T]2–TPF2T | (5.7 ± 0.9) × 10−3 | (2.0 ± 0.4) × 10−2 | (1.5 ± 0.5) × 10−2 | (1.9 ± 0.8) × 10−2 | (2.5 ± 0.9) × 10−2 | (8.0 ± 3.4) × 10−3 |
| PDPP[T]2–TPF4T | (2.6 ± 0.5) × 10−3 | (1.3 ± 0.2) × 10−2 | (1.1 ± 0.3) × 10−2 | (1.4 ± 0.4) × 10−2 | (1.5 ± 0.8) × 10−2 | (1.3 ± 0.5) × 10−2 |
Annealing leads to an increased hole mobility at the cost of higher threshold voltages around 30 V for the non-fluorinated PDPP[T]2–TPT reaching a maximum of 5.8 × 10⁻² cm2 V−1 s−1 after annealing at 300 °C. This increase can be explained by the higher degree of edge-on alignment as evidenced by the GIWAXS experiments and an S-parameter close to 0.9 after annealing. In the fluorinated polymer films, the hole mobility is increased by one order of magnitude upon annealing at temperatures between 200 °C and 300 °C to give values in the range of 1–2 × 10⁻² cm2 V−1 s−1.
Upon annealing at 350 °C, the non-fluorinated PDPP[T]2–TPT shows an onset of a weak n-type character with a rather low electron mobility value of 2.0 × 10⁻⁴ cm2 V−1 s−1 and a high threshold voltage of 54 V, leading to barely visible output even when operated at a high gate voltage of 80 V. Even though it is a weak n-type behaviour, it clearly indicates the onset of ambipolar behaviour. On the other hand, for the fluorinated derivatives, annealing at 350 °C improves the n-channel performance considerably. Thus, electron mobilities of 8.0 × 10⁻³ cm2 V−1 s−1 for PDPP[T]2–TPF2T and 1.3 × 10⁻² cm2 V−1 s−1 for PDPP[T]2–TPF4T respectively, could be obtained. The threshold voltage for n-channel operation is also decreased with respect to the non-fluorinated polymer and remains at around 50 V. Additionally, in these polymers, the hole-mobility is not negatively influenced by this high-temperature annealing step and remains in the range of 10−2 cm2 V−1 s−1. The origin of the high threshold voltages could be related to electron trapping at the dielectric/polymer interface.32
Experimental section
Materials and methods
All reagents were used without further purification unless otherwise noted. Microwave reactions were conducted in sealed containers using a Biotage Initiator Eight+ microwave. All polymer 1H and 19F NMR spectra were recorded on a Varian INOVA 300 spectrometer at 393 K in 1,1,2,2-tetrachloroethane (TCE) as solvent. The 1H spectra were referenced internally by using the residual solvent resonances. Deuterated solvents were obtained from Deutero. Gel permeation chromatography (GPC) analysis was carried out on an Agilent (Polymer Laboratories Ltd) PL-GPC 220 high temperature chromatographic unit equipped with DP, RI and LS (15° and 90°) detectors and three linear mixed bed columns of PLgel 13 μm (Olexis) with a linear Mw operating range: 500–15000000 g mol−1. GPC analysis was performed at 150 °C using 1,2,4-trichlorobenzene as the mobile phase. The samples were prepared by dissolving the polymer (0.1 wt%) in the mobile phase solvent in an external oven and the solutions were run without filtration. The molecular weights of the samples were referenced to linear polystyrene (Mw = 162–6000000 g mol−1, K = 12.100 and Alpha = 0.707) and were not corrected with K and Alpha values for the measured sample. Cyclic voltammetry was performed under moisture- and oxygen-free conditions using a 0.1 M tetra-n-butylammonium hexafluorophosphate in acetonitrile electrolyte solution. A standard three-electrode assembly connected to a potentiostat (model 263A, EG&G Princeton Applied Research) was used at a scanning rate of 100 mV s−1. The working electrode was a 10 Ω □−1 ITO coated glass substrate. The polymers were spincoated onto the ITO substrates from chloroform at 3 mg mL−1 and 1500 rpm to obtain thicknesses of 10–20 nm. A platinum wire in acetonitrile was used as counter electrode and the quasi-reference electrode consisted of an Ag wire in an AgNO3/acetonitrile solution (0.1 M). The measurements were calibrated with an external ferrocence/ferrocenium standard, IP and EA values were calculated considering the solvent effects as per a published procedure33 using eqn (1) and (2) where the workfunction of Fc/Fc+ is taken to be −5.23 eV. The reduction half-step potential Ered1/2(vs. Fc/Fc+) is negative whereas the oxidation half-step potential Eox1/2(vs. Fc/Fc+) is positive.| EA ≈ −5.23 eV − Ered1/2(vs. Fc/Fc+) | (1) |
| IP ≈ −5.23 eV − Eox1/2(vs. Fc/Fc+) | (2) |
GIWAXS measurements were conducted at the SAXS/WAXS beamline of the Australian Synchrotron.35 Samples were prepared by spincoating a polymer film onto an octyltrichlorosilane/SiO2 modified silicon wafer from a 6 mg mL−1 solution at 2000 rpm. Highly collimated 9 keV X-rays were calibrated to be at a tilt angle of 0 ± 0.01 degrees when parallel to the surface of each sample by use of a Silicon crystal analyzer. A Dectris Pilatus 1M detector collected 2D scattering patterns, including those shown in Fig. 5. Each scattering pattern was tiled together from three 1 second images with the detector slightly moved between exposures, such that the resulting image removes gaps between the detector modules. The sample to detector distance was measured using a silver behenate scattering standard. Data was analysed using a modified version of the NIKA small angle scattering analysis package.36
Device preparation and characterization
Organic thin film transistors substrates in bottom gate/bottom contact configuration were bought from Fraunhofer IPMS (OFET Gen. 4). Heavily n-doped silicon (doping at wafer surface: n ∼ 3 × 1017 cm−3) was used as substrate and gate electrode. Thermally grown silicon oxide (230 nm ± 10 nm) was used as the gate dielectric. Gold electrodes (30 nm on 10 nm ITO as adhesion layer) were used as source and drain contacts. The channel width was 10 mm for all devices and channel lengths of 10 μm and 20 μm were used. The substrates were cleaned subsequently in acetone and 2-propanol in an ultrasonic bath for 10 minutes each. Treatment in an ozone oven at 50 °C for 20 min was followed by immersion in a 1 wt% solution of octyltrichlorosilane in toluene at 60 °C for 60 min. After rinsing with toluene and 2-propanol the substrates were dried in a nitrogen stream and the polymer was spincoated from a 6 mg mL−1 chloroform solution at 2000 rpm under ambient conditions. Devices were measured in a nitrogen atmosphere using an Agilent B1500 Semiconductor Parameter Analyzer. The devices were annealed in a nitrogen atmosphere at a maximum of 0.9 ppm O2 for 15 minutes consecutively at the temperatures given in the main text. Mobilities were calculated from the slopes in the (Id)0.5–Vg plots in the saturation regime using eqn (3) where Id is the drain current, W the channel width, L the channel length, Ci the capacitance, Vg the gate voltage and VT the threshold voltage, respectively.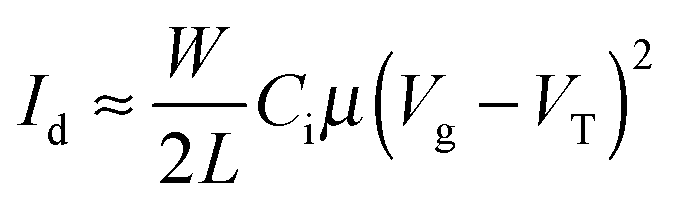 | (3) |
Synthesis procedures for the DPP compounds
All syntheses were conducted under argon using a double manifold Schlenk line. Glasware was severely dried under high vacuum. Solvents were degassed by three freeze–pump–thaw cycles. Monomers used for polymerization were recrystallized freshly on the same day.Conclusions
Diketopyrrolo[3,4-c]pyrrole copolymers incorporating an extended thiophene–phenylene–thiophene moiety with varying degrees of fluorination have been successfully synthesized. The concept of fluorination was evaluated in terms of alignment and solid state packing. As evident from GIWAXS, fluorination has a small influence on the alkyl spacing distance as well as the π–π stacking distance. However, the crystal coherence length can be significantly improved upon fluorination. Furthermore, we showed that upon gradual increase of fluorination and annealing the edge-on alignment of the polymer chains improves significantly, resulting in almost perfect edge-on alignment throughout the complete bulk of the film in the tetrafluorinated derivative. Whereas alignment is improved, fluorination does not necessarily lead to improved hole transport, but is a good approach to achieve ambipolar character in otherwise p-type materials. From our results we are able to draw concrete structure property relationships and their interplay regarding the degree of fluorination on alignment and charge carrier transport.Acknowledgements
We acknowledge financial support from DFG (SFB 840) and the Bavarian State Ministry of Education, Science and the Arts (Solar technologies go hybrid). C.J.M. thanks the Fonds der Chemischen Industrie for funding the PhD with a Kekulé scholarship and the German National Academic Foundation for other support during the PhD. Support from the Elitenetzwerk Bayern (ENB), Macromolecular Science is also kindly acknowledged. Work in Australia was supported by the Australian Research Council (grant DP13012616). This research was undertaken in part on the SAXS/WAXS beamline at the Australian Synchrotron, Victoria, Australia.35References
- X. Zhang, L. J. Richter, D. M. DeLongchamp, R. J. Kline, M. R. Hammond, I. McCulloch, M. Heeney, R. S. Ashraf, J. N. Smith, T. D. Anthopoulos, B. Schroeder, Y. H. Geerts, D. A. Fischer and M. F. Toney, J. Am. Chem. Soc., 2011, 133, 15073–15084 CrossRef CAS PubMed.
- Z. Yi, S. Wang and Y. Liu, Adv. Mater., 2015, 27, 3589–3606 CrossRef CAS PubMed.
- Z. Chen, M. J. Lee, R. Shahid Ashraf, Y. Gu, S. Albert-Seifried, M. Meedom Nielsen, B. Schroeder, T. D. Anthopoulos, M. Heeney, I. McCulloch and H. Sirringhaus, Adv. Mater., 2012, 24, 647–652 CrossRef CAS PubMed.
- I. Kang, H. J. Yun, D. S. Chung, S. K. Kwon and Y. H. Kim, J. Am. Chem. Soc., 2013, 135, 14896–14899 CrossRef CAS PubMed.
- W. Li, K. H. Hendriks, A. Furlan, W. S. Roelofs, S. C. Meskers, M. M. Wienk and R. A. Janssen, Adv. Mater., 2014, 26, 1565–1570 CrossRef CAS PubMed.
- W. Li, K. H. Hendriks, A. Furlan, W. S. C. Roelofs, M. M. Wienk and R. A. J. Janssen, J. Am. Chem. Soc., 2013, 135, 18942–18948 CrossRef CAS PubMed.
- Z. Yi, L. Ma, B. Chen, D. Chen, X. Chen, J. Qin, X. Zhan, Y. Liu, W. J. Ong and J. Li, Chem. Mater., 2013, 25, 4290–4296 CrossRef CAS.
- M. J. Cho, J. Shin, T. R. Hong, H. A. Um, T. W. Lee, G. W. Kim, J. H. Kwon and D. H. Choi, Polym. Chem., 2014, 6, 150–159 RSC.
- H. G. Kim, B. Kang, H. Ko, J. Lee, J. Shin and K. Cho, Chem. Mater., 2015, 27, 829–838 CrossRef CAS.
- J. D. Yuen, J. Fan, J. Seifter, B. Lim, R. Hufschmid, A. J. Heeger and F. Wudl, J. Am. Chem. Soc., 2011, 133, 20799–20807 CrossRef CAS PubMed.
- N. E. Jackson, B. M. Savoie, K. L. Kohlstedt, M. Olvera de la Cruz, G. C. Schatz, L. X. Chen and M. A. Ratner, J. Am. Chem. Soc., 2013, 135, 10475–10483 CrossRef CAS PubMed.
- H. Zhong, C. Z. Li, J. Carpenter, H. Ade and A. K. Jen, J. Am. Chem. Soc., 2015, 137, 7616–7619 CrossRef CAS PubMed.
- J. H. Park, E. H. Jung, J. W. Jung and W. H. Jo, Adv. Mater., 2013, 25, 2583–2588 CrossRef CAS PubMed.
- D. J. Crouch, P. J. Skabara, J. E. Lohr, J. J. W. McDouall, M. Heeney, I. McCulloch, D. Sparrowe, M. Shkunov, S. J. Coles, P. N. Horton and M. B. Hursthouse, Chem. Mater., 2005, 17, 6567–6578 CrossRef CAS.
- D. J. Crouch, P. J. Skabara, M. Heeney, I. McCulloch, S. J. Coles and M. B. Hursthouse, Chem. Commun., 2005, 1465–1467, 10.1039/b417642a.
- P. M. Sonar, J. Chang, Z. Shi, J. Wu and J. Li, J. Mater. Chem. C, 2015, 3, 2080–2085 RSC.
- A. Luzio, D. Fazzi, F. Nübling, R. Matsidik, A. Straub, H. Komber, E. Giussani, S. E. Watkins, M. Barbatti, W. Thiel, E. Gann, L. Thomsen, C. R. McNeill, M. Caironi and M. Sommer, Chem. Mater., 2014, 26, 6233–6240 CrossRef CAS.
- A. de Bettencourt-Dias and A. Poloukhtine, J. Phys. Chem. B, 2006, 110, 25638–25645 CrossRef CAS PubMed.
- D. A. Guthrie and J. D. Tovar, Org. Lett., 2008, 10, 4323–4326 CrossRef CAS PubMed.
- B. G. Kim, E. J. Jeong, J. W. Chung, S. Seo, B. Koo and J. Kim, Nat. Mater., 2013, 12, 659–664 CrossRef CAS PubMed.
- A. K. Palai, S. P. Mishra, A. Kumar, R. Srivastava, M. N. Kamalasanan and M. Patri, Macromol. Chem. Phys., 2010, 211, 1043–1053 CrossRef CAS.
- C. B. Nielsen, R. S. Ashraf, B. C. Schroeder, P. D'Angelo, S. E. Watkins, K. Song, T. D. Anthopoulos and I. McCulloch, Chem. Commun., 2012, 48, 5832–5834 RSC.
- C. J. Mueller, C. R. Singh, M. Fried, S. Huettner and M. Thelakkat, Adv. Funct. Mater., 2015, 25, 2725–2736 CrossRef CAS.
- H. Bronstein, J. M. Frost, A. Hadipour, Y. Kim, C. B. Nielsen, R. S. Ashraf, B. P. Rand, S. Watkins and I. McCulloch, Chem. Mater., 2013, 25, 277–285 CrossRef CAS.
- K. H. Hendriks, W. Li, M. M. Wienk and R. A. J. Janssen, Adv. Energy Mater., 2013, 3, 674–679 CrossRef CAS.
- J.-L. Bredas, Mater. Horiz., 2014, 1, 17 RSC.
- C. B. Nielsen, M. Turbiez and I. McCulloch, Adv. Mater., 2012, 25, 1859–1880 CrossRef PubMed.
- L. A. Perez, P. Zalar, L. Ying, K. Schmidt, M. F. Toney, T.-Q. Nguyen, G. C. Bazan and E. J. Kramer, Macromolecules, 2014, 47, 1403–1410 CrossRef CAS.
- A. Facchetti, M. H. Yoon, C. L. Stern, H. E. Katz and T. J. Marks, Angew. Chem., Int. Ed., 2003, 42, 3900–3903 CrossRef CAS PubMed.
- M. H. Yoon, A. Facchetti, C. E. Stern and T. J. Marks, J. Am. Chem. Soc., 2006, 128, 5792–5801 CrossRef CAS PubMed.
- T. Yamao, Y. Taniguchi, K. Yamamoto, T. Miki, S. Ota, S. Hotta, M. Goto and R. Azumi, Jpn. J. Appl. Phys., 2007, 46, 7478–7482 CrossRef CAS.
- L. L. Chua, J. Zaumseil, J. F. Chang, E. C. Ou, P. K. Ho, H. Sirringhaus and R. H. Friend, Nature, 2005, 434, 194–199 CrossRef CAS PubMed.
- K. Gräf, M. A. Rahim, S. Das and M. Thelakkat, Dyes Pigm., 2013, 99, 1101–1106 CrossRef.
- V. Mathot, M. Pyda, T. Pijpers, G. Vanden Poel, E. van de Kerkhof, S. van Herwaarden, F. van Herwaarden and A. Leenaers, Thermochim. Acta, 2011, 522, 36–45 CrossRef CAS.
- N. M. Kirby, S. T. Mudie, A. M. Hawley, D. J. Cookson, H. D. T. Mertens, N. Cowieson and V. Samardzic-Boban, J. Appl. Crystallogr., 2013, 46, 1670–1680 CrossRef CAS.
- J. Ilavsky, J. Appl. Crystallogr., 2012, 45, 324–328 CrossRef CAS.
Footnote |
| † Electronic supplementary information (ESI) available: Synthesis and characterization of all monomers, detailed characterization of polymers including NMR, TGA, GPC, cyclic voltammetry and Flash-DSC. See DOI: 10.1039/c5tc01948f |
| This journal is © The Royal Society of Chemistry 2015 |