Applying a new interatomic potential for the modelling of hexagonal and orthorhombic YMnO3
Received
2nd December 2014
, Accepted 1st April 2015
First published on 3rd April 2015
Abstract
We develop and apply an interatomic potential for YMnO3, based on the shell model together with the angular overlap model, which can model ligand field effects. The potential parameters accurately reproduce the complex structure of both hexagonal and orthorhombic phases of YMnO3. The rotation of the MnO6 octahedra in o-YMnO3 suggests the E-type AFM order. The potential is further employed to investigate the energies of intrinsic defects in the material. Lower defect energies were found in o-YMnO3. Oxygen Frenkel and Y2O3 partial Schottky are the most favourable defects in h-YMnO3 and o-YMnO3, respectively. The defect models proposed have implications for the properties of the related non-stoichiometric phases.
Introduction
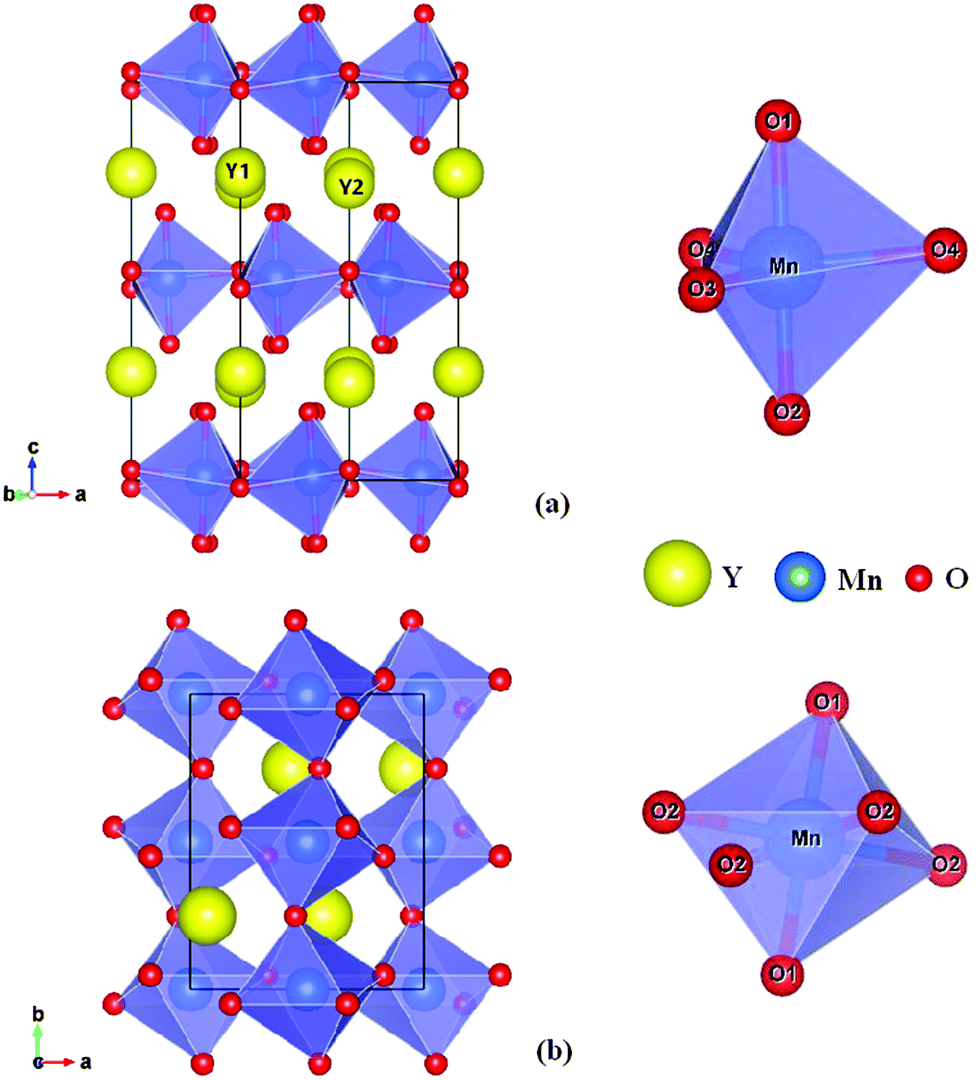
The rare-earth manganite, YMnO3, is a well-known example of a multiferroic which possesses magnetism and ferroelectricity simultaneously and thus has attracted considerable attention in recent years due to its multiferroic and magnetoelectric properties and potential interest.1–3 YMnO3 prepared under ordinary synthetic conditions crystallizes in a hexagonal structure, which belongs to the space group P63cm, and can be considered as alternating ab-layers of Y3+ ions and corner-sharing MnO5 trigonal bipyramids, as shown in Fig. 1(a). Each MnO5 bipyramid is formed of a central Mn3+ ion surrounded by three planar oxygen (O3 and O4) atoms and two apical oxygen (O1 and O2) atoms. Whilst there is one unique site for manganese atoms and four for oxygen atoms, there are two inequivalent sites for yttrium atoms.4 By means of soft-chemistry synthesis, applying pressure, or epitaxial strain in thin films, the hexagonal structure can be converted into the more dense, albeit metastable orthorhombic structure (Pnma space group),5–13 which contains two distinct oxygen sites (four planar O1 sites and two apical O2 sites), while there is only one inequivalent site for Y atoms and likewise for Mn atoms.7 The orthorhombic structure is composed of corner-sharing MnO6 octahedra with one yttrium cation occupying each hole; see Fig. 1(b). Compared to the cubic phase, the unit cell of which is composed of just one regular octahedron, the MnO6 octahedra are both rotated (Mn–O bonds originally align parallel with the crystallographic axes) and distorted (the six equivalent Mn–O bond distances become three degenerate pairs) as a result of steric and Jahn–Teller effects.25
 |
| | Fig. 1 The crystal structure (right panels) of YMnO3 and the corresponding secondary building units, MnO5 trigonal bipyramid and MnO6 octahedron, (left panels) in (a) the hexagonal phase and (b) the orthorhombic phase, respectively. | |
Both the hexagonal and orthorhombic phases of YMnO3 have been subjected to theoretical studies based on Density Functional Theory.2,6,14–17 Many questions, however, remain unsolved that lie beyond the computational limits of applying purely quantum mechanical approaches, especially problems related to complex defect structures, and other configurations that require the inclusion and relaxation of a large number of ions. Atomistic modelling techniques – employing interatomic potentials based on the ionic model which has already been successfully employed to a range of oxide-based materials18,19 – have been applied to the study of YMnO320,21 but, due to the purely radial feature of the potentials, the calculations showed major limitations in accurately modelling its structure which has a substantial distortion of the MnO5 polyhedron in the hexagonal phase and the MnO6 polyhedron in the orthorhombic phase.
In the present paper, we employed a semi-empirical force field approach, which includes the angular overlap model (AOM).22 The AOM model has been successfully applied to modelling the Jahn–Teller distortions within and the rotations of the MnO6 octahedra in the orthorhombic perovskite LaMnO3,23 oxygen anion migration in LaMnO3−δ,24 and the changes in the structure that occur across the series of lanthanide manganates.25 Here, we develop a set of potential parameters that accurately reproduce the structure of YMnO3 in both the hexagonal phase and metastable orthorhombic phase and, moreover, successfully model the thermodynamic parameters relating to the phase transition. For h-YMnO3, the lattice distortions are associated with its ferroelectric properties3,4 and the strong interactions between Mn trimers, which dominate the magnetic and magnetodielectric coupling.26 For o-YMnO3, the magnetic ordering and, consequently, the multiferroic and magnetoelectric properties of this phase depend on the bond angle.9,27–31 Thus, the capability of the present method to predict accurately the bond length, bond angle, atomic displacement and distortion features of YMnO3 under hydrostatic pressure and chemical doping is of great interest in the multifunctional properties of RMnO3 based materials, where R is a rare earth element. Additionally, considering that the large leakage currents with a small quantity of defects induced by the low band gap of YMnO3 hamper their application,32–35 it is of great importance to know the origin of the defects in the material, especially for h-YMnO3, which is ferroelectric at room temperature. Consequently, we also perform a detailed investigation of the intrinsic defect properties which also relate to the properties of the related non-stoichiometric phases.
Simulation method
Our calculations are based on the Born model, using interatomic potentials that have been modified by the addition of a ligand field term. The contribution from “spherical” forces between ions to the lattice energy is described by the standard Coulomb–Buckingham expression:| | 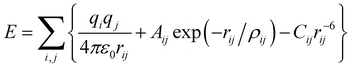 | (1) |
where the summation over i and j includes unique pairs of atoms and parameters q, A, ρ and C are species dependent parameters. Three-dimensional periodic boundary conditions were applied to the unit cell, i restricted to atoms within this unit cell and contributions to the energy reduced by a half when atom j is a periodic image so that eqn (1) gives energy per unit cell. The Ewald summation36,37 was employed to compute the Coulomb term, using formal charges, q, on the ions. The remaining terms constitute the short-range Buckingham potential representing the cation–anion and anion–anion short-range interactions; a cut off of 12 Å was applied. The shell model38,39 is employed to describe the polarizability of individual ions. In this model, each ion is divided into two coupled parts: a core with mass m and charge X and a massless shell with charge Y (we constrained X + Y to be the formal charge of ion). The interaction between the core and corresponding shell is described by an harmonic function with a spring constant k. In our calculations, A, ρ, C, k and Y were fitted empirically so that the structural parameters of the appropriate phases for YMnO3 were reproduced.
To model the irregular coordination geometry associated with Mn3+ ions, we add a contribution to the lattice energy that corresponds to the Jahn–Teller driving force for the distortions and removal of degeneracy in electronic energy:40
| | 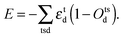 | (2) |
Here,
εtd and
Otsd are the energy changes and occupations of the d-orbitals for each transition metal, t, respectively, and s is the spin of an electron. An adaptation of the angular overlap model (AOM) is used to obtain
εtd. In this model we compute the eigenvalues,
εd, of a 5 × 5 overlap matrix,
Hdd′ for each transition metal ion.
Hdd′ is formed by taking the products of the angular contributions to the overlap integrals,
Γd,
41 between the d-orbital of transition metal ion and the orbitals of any surrounding ligand (l),
| | 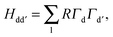 | (3) |
where the Born–Mayer interaction is used to model the radial dependence of the interaction between transition metal ion and its ligand:
| | R = ALF![[thin space (1/6-em)]](https://www.rsc.org/images/entities/char_2009.gif) exp(−rtl/ρLF). exp(−rtl/ρLF). | (4) |
The two new parameters,
ALF and
ρLF, depend on ligand type and can be empirically fitted. Upon optimization of the lattice energy with respect to the cell parameters and ionic coordinates, the energy levels may become degenerate and the order of the energy levels may also change. To prevent the energy landscape becoming discontinuous, we employ partial occupancies (or a nonzero probability that an electron can occupy a higher energy state)
via the implementation of a Fermi function. The theory of the AOM and its successful application in modelling compounds containing “non-spherical” transition metal ions,
i.e. manganites with distortions, are reviewed in detail elsewhere.
40
The lattice-energy is minimized by relaxing both cell dimensions and atomic coordinates at constant pressure using a quasi Newton–Raphson procedure together with the BFGS method42 for updating the Hessian. All our calculations employed the General Utility Lattice Program (GULP).43,44 The potential parameters derived in our fitting procedure are reported in Table 1.
Table 1 Buckingham parameters for the interaction between the shells of the ions; the force field parameters for radial part of the AOM that acts between each manganese core and the surrounding oxygen cores; and the parameters for the shell model. Subscripts s and c indicate shell and core, respectively. The cut-off radius for all short range potentials is 12 Å
| Interaction |
A (eV) |
ρ (Å) |
C (eV Å6) |
| Short-range Buckingham potentials |
| Ys3+–Os2− |
26384.018 |
0.2270 |
0.0 |
| Mns3+–Os2− |
835.222 |
0.3654 |
0.0 |
| Os2−–Os2− |
22764.300 |
0.1490 |
46.0 |
|
|
| Radial force field parameters |
| Mnc3+–Oc2− |
2.0109 |
0.7005 |
|
| Species |
Y (e) |
k (eV Å−2) |
| Shell model |
| Y3+ |
4.6575 |
88 |
| Mn3+ |
3 |
98.4 |
| O2− |
−2.389 |
42.00 |
Results and discussion
Lattice calculations
The first challenge, for our newly derived potential model, is to reproduce the crystal structures of both the hexagonal and orthorhombic structures with the same set of potential parameters. The energy minimised structural parameters and experimental data are listed in Table 2. Results calculated from previously published force field parameters are also presented for comparison. We note that the differences between experimental5,45 and our calculated lattice parameters and bond lengths are all within 2%, and in most cases less than 1%. Hence, our potential parameters reproduced the complex crystal structure of YMnO3 for both the hexagonal and orthorhombic phases, which is in stark contrast to previous results.20,21 For example, the largest bond length error was reduced from 4.6% and 6.98% to 1.56% for the hexagonal phase, and from 9% and 7.98% to 2.38% for the orthorhombic phase. It is noteworthy that the bond angle in the orthorhombic phase is now within 2.04% (cf. 3.5% and 4.42% for ref. 20 and 21, respectively). According to the magnetic phase diagram for orthorhombic RMnO3 as a function of Mn–O–Mn bond angle,27–31 our results show the E-type AFM order of o-YMnO3, while other results20 determine the magnetic phase to be A-type. Moreover, comparing the predicted structural data obtained from potentials with and without the AOM ligand field term, we note that the ligand term effectively reproduces the asymmetry of the Mn3+ ions, i.e. the distortion and rotation of both MnO5 bipyramid in h-YMnO3 and MnO6 Jahn–Teller octahedron in o-YMnO3.
Table 2 Structural data of YMnO3
| Structural parameter |
Experimental5,45 |
Including AOM |
Excluding AOM |
Previously calculated20 |
| Hexagonal phase |
|
a/Å |
6.1382 |
6.1604 |
6.115 |
6.1203 |
|
c/Å |
11.3958 |
11.2341 |
11.632 |
11.4316 |
| Y1–O1/Å |
2.2676 |
2.2491 |
2.2334 |
2.2682 |
| Y1–O2/Å |
2.3099 |
2.3105 |
2.2958 |
2.2923 |
| Y1–O3/Å |
2.3163 |
2.3525 |
2.3462 |
2.4229 |
| Y2–O1/Å |
2.2720 |
2.2747 |
2.2539 |
2.2670 |
| Y2–O2/Å |
2.2974 |
2.2750 |
2.2616 |
2.2800 |
| Y2–O4/Å |
2.4581 |
2.4708 |
2.4779 |
2.5647 |
| Mn–O1/Å |
1.8584 |
1.8421 |
1.9580 |
1.8637 |
| Mn–O2/Å |
1.8755 |
1.8506 |
1.9630 |
1.8714 |
| Mn–O3/Å |
2.0632 |
2.0743 |
2.0699 |
2.0488 |
| Mn–O4/Å |
2.0555 |
2.0639 |
2.0564 |
2.0558 |
| O1–Mn–O2/° |
179.994 |
179.984 |
179.972 |
179.950 |
| O3–Mn–O4/° |
120.382 |
120.410 |
120.713 |
120.338 |
|
|
| Orthorhombic phase |
|
a/Å |
5.8029 |
5.741 |
5.543 |
5.5572 |
|
b/Å |
7.3643 |
7.2614 |
7.876 |
7.4050 |
|
c/Å |
5.2418 |
5.3664 |
5.336 |
5.3142 |
| Mn–O1/Å |
1.9036 |
1.9225 |
2.1260 |
1.9337 |
| Mn–O2(s)/Å |
1.9382 |
1.9476 |
2.0295 |
1.9910 |
| Mn–O2(l)/Å |
2.2007 |
2.1806 |
2.0363 |
2.0027 |
| Mn–O1–Mn/° |
144.442 |
141.503 |
135.686 |
146.307 |
| Mn–O2–Mn/° |
143.591 |
144.219 |
142.219 |
148.601 |
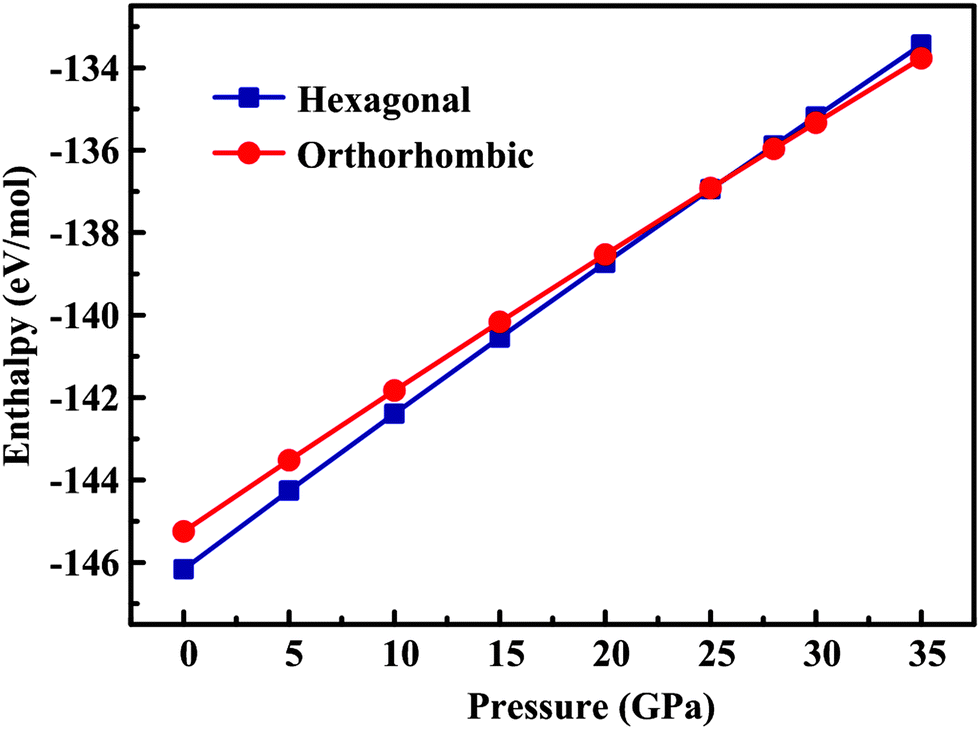
The robustness of the proposed potential set is further checked through investigation of the pressure dependence of both the orthorhombic and hexagonal structures (Fig. 2). Our calculations showed that the orthorhombic phase became more stable at the pressure of 25.8 GPa, which accords well with the experimental observation that, at room temperature, a pressure-induced hexagonal–orthorhombic phase transition requires a pressure above ∼22 GPa for YMnO3.46 This result is gratifying in view of the considerable sensitivity to details of the potential model of the thermodynamic parameters associated with this kind of phase transition.
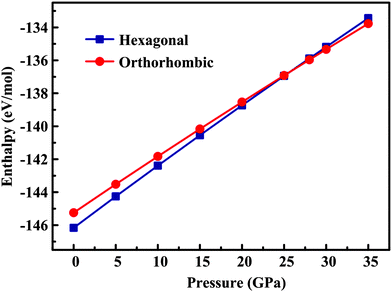 |
| | Fig. 2 Lattice energies (eV mol−1) of orthorhombic and hexagonal YMnO3 as a function of pressure calculated using our new potentials. Squares and circles show the values obtained by relaxing the h-YMnO3 structure and the o-YMnO3 structure, respectively. | |
Frenkel and Schottky disorder
We next present results of our defect calculations for YMnO3. We use the supercell method rather than the Mott–Littleton approach in our study of defects within both the hexagonal and orthorhombic structure as the use of potential functions needed to describe Mn3+–O2− interactions in the non-cubic phase is not currently implemented in the latter.
Supercells were generated from the relaxed cell parameters and ionic coordinates of bulk YMnO3. After removing or adding one ion from or into the supercell, we added a neutralizing uniform charge background. These structures were then optimized with the cell parameters being fixed, since one isolated defect should not change the bulk lattice constants. To obtain the energy required to form an isolated defect, Ef, we first calculate the energy difference, ΔE, between the lowest local energy minimum obtained from the optimization of the defect containing cell and the lattice energy of the perfect crystal. We require this energy to be converged with respect to the size of the supercell, or shortest distance between the defect and the unwanted images of this defect. In order to speed up this convergence, we reduce the unwanted long-range interactions between the defect (vacancy and local distortions) and its images, by adding a correction term Ec to ΔE.24,47
| |  | (5) |
where
α is the Madelung constant and
εr the dielectric constant of the perfect crystal. This term refers to the Coulomb energy of a point charge
Q (charged defect) immersed in a structureless dielectric, within a cubic unit cell of length
L with a neutralizing uniform charge background.
47 With increasing size of the supercell, the contribution given by
Ec will dominate the energy difference between the lattice with a periodic array of defects and that with an isolated defect,
i.e. the energy difference caused by the unwanted interaction mentioned above.
In order to estimate Ec, we first compute
| |  | (6) |
For a single point charge
Q,
ED is very straight forward to obtain from GULP as it is the lattice energy of the cation or anion, which was removed in order to create the defect, in an empty unit cell that has the same dimensions as the supercell it was removed from. Note that a charged uniform neutralizing background is also required. This procedure can be generalised to include more point charges, and will be discussed elsewhere. The interactions of the charge associated with the defect and that of its images will be reduced by the screening effect of the remaining ions, and so the correction term,
Ec, is estimated as:
| |  | (7) |
where
εr is the average of the diagonal components of the diagonalized static dielectric constant tensor. The defect formation energy,
Ef, is therefore
| |  | (8) |
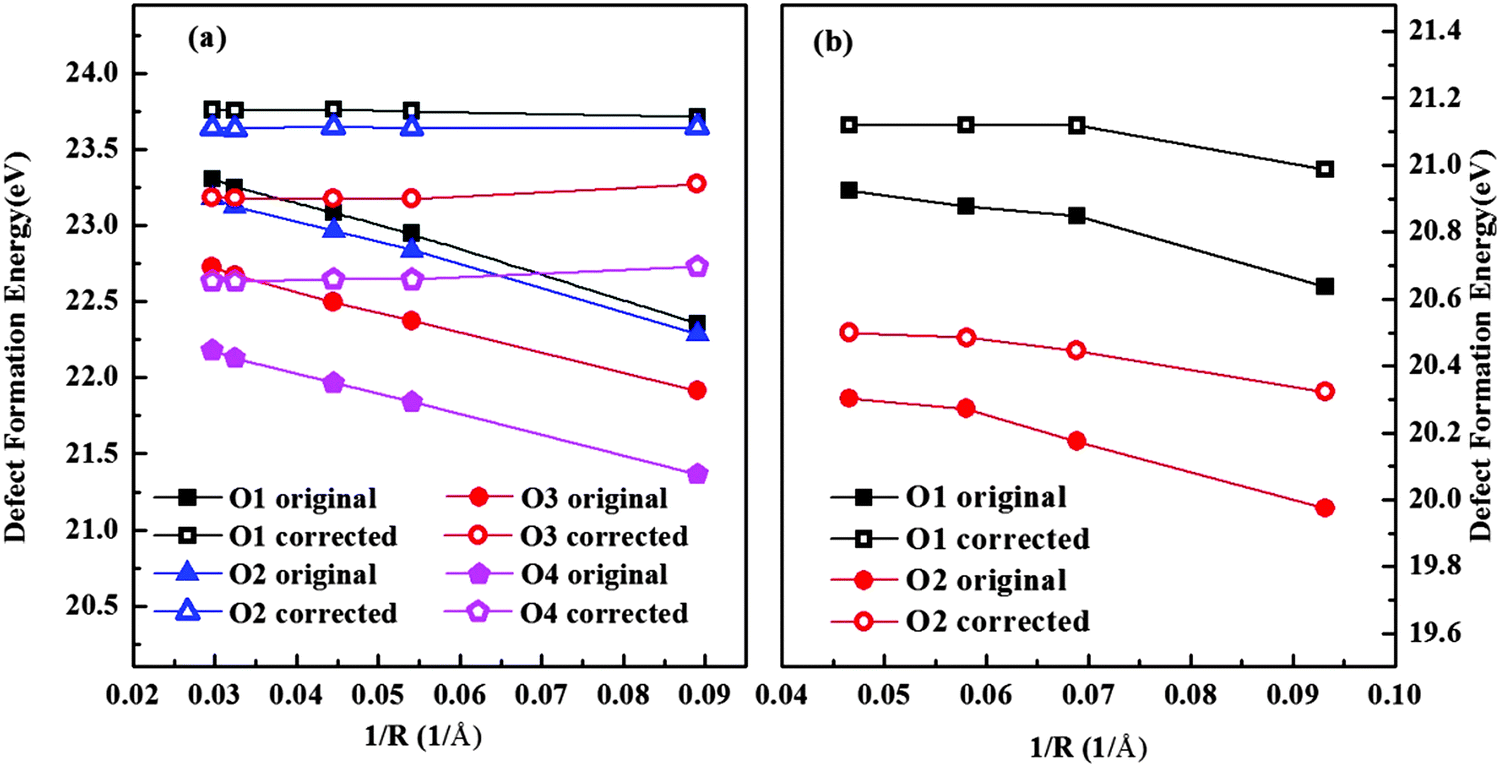
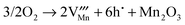
Fig. 3 shows the results of isolated oxygen vacancy formation energy of hexagonal and orthorhombic YMnO
3. We investigated all unique oxygen sites. By adding
Ec, the term in
eqn (7), the convergence of
Ef was improved considerably in both phases. In our final results, we extrapolate the value for
Ef at 1/
R = 0. This supercell method has also been compared with the Mott–Littleton approach before and proved to be reliable and effective.
24
 |
| | Fig. 3 Calculated energy of formation for an isolated oxygen vacancy in (a) hexagonal and (b) orthorhombic YMnO3 as a function of the reciprocal of the distance between a defect and its nearest image without (solid symbol) and with (hollow symbol) the correction term. | |
The energies of isolated vacancy and interstitial defects were calculated first for both the hexagonal and orthorhombic structures. Regarding the vacancies, we calculated both the yttrium sites and the four oxygen sites in the hexagonal structure and the two oxygen sites in the orthorhombic structure. For h-YMnO3, the planar oxygen O3 and O4 sites have a lower energy – about 1 eV lower than the apical sites, which is consistent with experimental observation.48 It is reported that the host h-YMnO3 shows a preference for removing the equatorial oxide anions (at O3 and O4) to yield phases of composition YMnO3−δ, which may be rationalized by considering the coordination requirement of cations.49 The formation energy of the Y2 vacancy is slightly lower than Y1 by 0.25 eV. For the orthorhombic phase, the difference in Ef between different sites is much smaller. The O2 vacancy is a little more energetically favourable by 0.65 eV. Only the lowest energies were used in the following calculations.
As to interstitial defects, for the hexagonal structure, we tested several possible positions to confirm the optimal position of the interstitial site; for the orthorhombic phase, we considered two possible sites: the octahedral interstice at (0, 1/2, 0) and the tetrahedral interstice at (1/4, 1/4, 1/4), and lower energies were found for interstitials placed at the octahedral site. Only the lowest formation energies were employed in the calculations below.
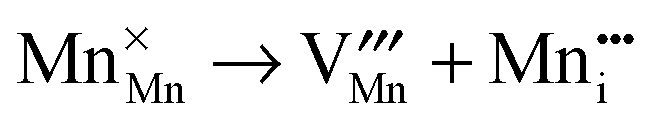
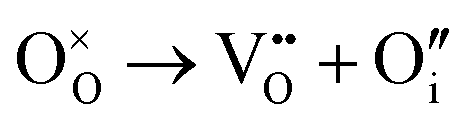
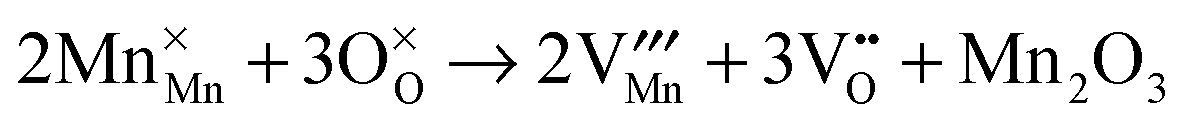
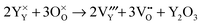
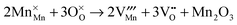
Then, Frenkel disorder, full Schottky disorder and partial Schottky disorder energies were calculated by combining individual defect energies and lattice energies. These defect reactions are described by the following equations, where Kröger–Vink notation is used.
Yttrium Frenkel disorder:
| |  | (9) |
Manganese Frenkel disorder:
| | 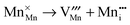 | (10) |
Oxygen Frenkel disorder:
| |  | (11) |
YMnO
3 full Schottky disorder:
| |  | (12) |
Y
2O
3 partial Schottky disorder:
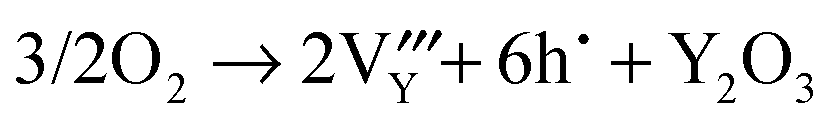
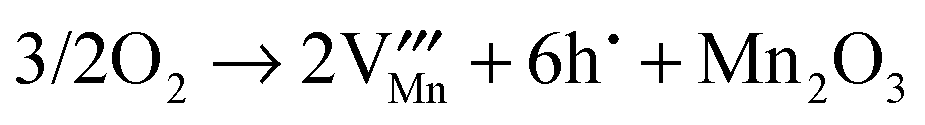
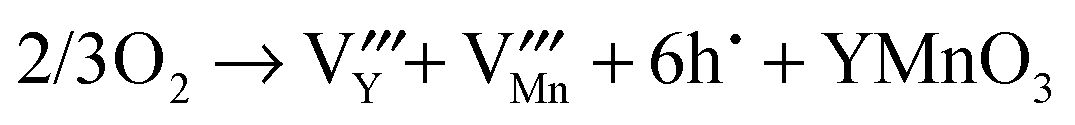
| |  | (13) |
Mn
2O
3 partial Schottky disorder:
| |  | (14) |
The corresponding energies for all these types of intrinsic defects are listed in
Table 3. In order to enable comparisons between different types of disorder reactions, the energies are given as defect formation energies per defect,
i.e. EF/2 for Frenkel disorder and
ES/5 for Schottky disorder.
Table 3 Calculated energies for Frenkel disorder, partial Schottky disorder and full Schottky disorder in YMnO3 crystals
| Reaction |
Eqn |
Energy/eV per defect |
|
|
Hexagonal |
Orthorhombic |
| Y Frenkel |
(9)
|
11.46 |
6.40 |
| Mn Frenkel |
(10)
|
10.83 |
7.69 |
| O Frenkel |
(11)
|
5.01 |
3.65 |
| YMnO3 full Schottky |
(12)
|
6.61 |
3.40 |
| Y2O3 partial Schottky |
(13)
|
6.91 |
2.85 |
| Mn2O3 partial Schottky |
(14)
|
6.73 |
4.01 |
For both systems, the cation Frenkel disorder energies are much higher than other disorder energies. However, in the hexagonal structure, the oxygen Frenkel energy is the lowest defect type; while in orthorhombic structure, it is slightly higher than but comparable to Schottky disorder energies, which indicates that vacancies, not interstitials, will be the dominant structural defects. For both structures, however, defect energies are so high that intrinsic disorder would not be expected to dominate the defect chemistry, although we find that very significantly lower energies were obtained for the orthorhombic structure.
Essentially, from our results obtained using the supercell method, it is predicted that the oxygen Frenkel disorder and Schottky disorder involving Y are found to be the most energetically favourable intrinsic defect in h-MnO3 and o-YMnO3, respectively, although the defect energies are still high. The greatest significance of our calculations is perhaps not in the low levels expected for intrinsic disorder, but their predictions for related non-stoichiometric phases. The variable valence of Mn should result in both oxygen deficient and oxygen excess phases depending on the oxygen partial pressure. Our calculations predict that for oxygen deficient phases the reduction of Mn should, as expected, lead to oxygen vacancy formation. The results for oxidation are more interesting as there are more possibilities. And we will discuss this in more details below.
Oxidative nonstoichiometry
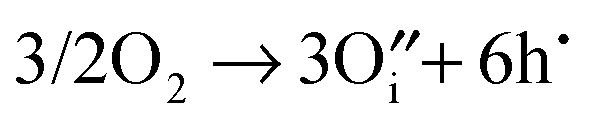
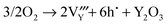
As mentioned earlier, oxidation in the hexagonal phase and orthorhombic phase might happen via different mechanisms, consequently we have examined the energetics of four different oxidation reactions (eqn (15)–(18)):| | 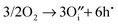 | (15) |
| |  | (16) |
| |  | (17) |
| |  | (18) |
The hole state in both phases was modelled as a Mn4+ ion (i.e. as a small polaron), as observed in oxygen excess systems5 and hole doped systems.50 In addition to the individual defect energies and the lattice energies, we also included the dissociation energy of an oxygen molecule (5.16 eV), the first and second electron affinities of oxygen (−1.46 and +8.75 eV respectively) and the fourth ionisation energy of manganese (52 eV).51 This is clearly an approximate approach but should still provide useful comparisons between the different processes listed above.
The calculated reaction energies are listed in Table 4. For the hexagonal phase, the results show that the energy for reaction (15) is the lowest, which suggests that oxidation will result in the formation of oxygen interstitials. This prediction is in agreement with experiment studies in which hexagonal YMnO3+δ was observed to accommodate interstitial oxygen.52,53 Moreover, h-Dy1−xYxMnO3+δ has been investigated as a possible material for storing/releasing oxygen; as high as 2000 μmol-O per g in air is observed when cycling between stoichiometric and interstitial oxygen rich structures by changing temperature between 250 and 350 °C.54
Table 4 Calculated energies for oxidation reactions in YMnO3 crystals
| Eqn |
Energy/eV per hole |
| Hexagonal |
Orthorhombic |
|
(15)
|
4.17 |
1.54 |
|
(16)
|
5.25 |
0.36 |
|
(17)
|
5.11 |
1.34 |
|
(18)
|
5.01 |
0.83 |
For the orthorhombic system, we predict yttrium vacancy formation during oxidative reactions. The difficulty of preparation of YMnO3 in its perovskite form results in the relative scarcity of reports devoted to the description of its basic properties. Insight perhaps can be gained from studies of its larger A-site cation isomorphous LaMnO3 counterpart, which have reported that LaMnO3 has the ability to accommodate oxidative nonstoichiometry via cation vacancies.55,56 There is some disagreement, however, in the literature concerning whether A-site or B-site cation vacancies dominate in oxygen excess compositions. Mitchell et al.56 used NPD methods and found that there was a tendency towards more A-site lanthanum vacancies present in orthorhombic LaMnO3 structures, which accords with our calculations.
Importantly, the lower reaction energies for the orthorhombic phase would lead us to expect greater non-stoichiometry than for the hexagonal phases. It would be interesting to see whether this prediction can be verified experimentally.
To summarise, the oxidation reaction is found to occur via oxygen interstitial and yttrium vacancy formation for h-MnO3 and o-YMnO3, respectively, and their ability to accommodate oxidative nonstoichiometry is to be expected.
Conclusions
In conclusion, we have developed a new set of interatomic potential parameters based on the AOM model,23 which successfully reproduces the structure of both hexagonal and orthorhombic structure of YMnO3. Furthermore, we have used this potential to examine basic defect energies. In the hexagonal structure, the oxygen Frenkel defect is the most energetically favourable, while Schottky defects involving Y ion have the lowest energies in the orthorhombic phase. Significant intrinsic disorder of either Frenkel or Schottky type is, however, unlikely, but the results have considerable significance for the nature of related non-stoichiometric phases. The capability of the proposed method to estimate accurately the structural properties of both h-YMnO3 and o-YMnO3, and the detailed investigation of the defects in the present work have implications for modified RMnO3 based multifunctional materials.
Acknowledgements
We would like to acknowledge the financial support by The National Science Foundation of China (11174169, 11234007, 51471093). We thank EPSRC for financial support (grants EP/I03014X, EP/K038958 and EP/L000202). We also thank Alexey A. Sokol for useful discussions of this work.
References
- W. Eerenstein, N. D. Mathur and J. F. Scott, Nature, 2006, 442, 759 CrossRef CAS PubMed.
- B. B. Van Aken, T. T. M. Palstra, A. Filippetti and N. A. Spaldin, Nat. Mater., 2004, 3, 164 CrossRef CAS PubMed.
- S. Lee, A. Pirogov, M. Kang, K.-H. Jang, M. Yonemura, T. Kamiyama, S.-W. Cheong, F. Gozzo, N. Shin, H. Kimura, Y. Noda and J.-G. Park, Nature, 2008, 451, 805 CrossRef CAS PubMed.
- T. Katsufuji, M. Masaki, A. Machida, M. Moritomo, K. Kato, E. Nishibori, M. Takata, M. Sakata, K. Ohoyama, K. Kitazawa and H. Takag, Phys. Rev. B: Condens. Matter Mater. Phys., 2002, 66, 134434 CrossRef.
- J. A. Alonso, M. J. Martínez-Lope, M. T. Casais and M. T. Fernández-Díaz, Inorg. Chem., 2000, 39, 917 CrossRef CAS.
- D. Okuyama, S. Ishiwata, Y. Takahashi, K. Yamauchi, S. Picozzi, K. Sugimoto, H. Sakai, M. Takata, R. Shimano, Y. Taguchi, T. Arima and Y. Tokura, Phys. Rev. B: Condens. Matter Mater. Phys., 2011, 84, 054440 CrossRef.
- I. Fina, L. Fabrega, X. Marti, F. Sánchez and J. Fontcuberta, Appl. Phys. Lett., 2010, 97, 232905 CrossRef PubMed.
- X. Martí, F. Sánchez, V. Skumryev, V. Laukhin, C. Ferrater, M. V. García-Cuenca, M. Varela and J. Fontcuberta, Thin Solid Films, 2008, 516, 4899 CrossRef PubMed.
- J. Fontcuberta, I. Fina, L. Fàbrega, F. Sánchez, X. Martí and V. Skumryev, Phase Transitions, 2011, 84, 555 CrossRef CAS.
- Y. S. Chai, Y. S. Oh, L. J. Wang, N. Manivannan, S. M. Feng, Y. S. Yang, L. Q. Yan, C. Q. Jin and K. H. Kim, Phys. Rev. B: Condens. Matter Mater. Phys., 2012, 85, 184406 CrossRef.
- J. Hemberger, F. Schrettle, A. Pimenov, P. Lunkenheimer, V. Yu. Ivanov, A. A. Mukhin, A. M. Balbashov and A. Loidl, Phys. Rev. B: Condens. Matter Mater. Phys., 2007, 75, 035118 CrossRef.
- M. Nakamura, Y. Tokunaga, M. Kawasaki and Y. Tokura, Appl. Phys. Lett., 2011, 98, 082902 CrossRef PubMed.
- M. N. Iliev, A. P. Litvinchuk, Y.-Q. Wang, Y. Y. Sun and C. W. Chu, Physica B, 2005, 358, 138 CrossRef CAS PubMed.
- M. Qian, J. Dong and D. Y. Xing, Phys. Rev. B: Condens. Matter Mater. Phys., 2000, 63, 155101 CrossRef.
- C. J. Fennie and K. M. Rabe, Phys. Rev. B: Condens. Matter Mater. Phys., 2005, 72, 100103(R) CrossRef.
- S. Picozzi, K. Yamauchi, B. Sanyal, I. A. Sergienko and E. Dagotto, Phys. Rev. Lett., 2007, 99, 227201 CrossRef CAS.
- K. Yamauchi, F. Freimuth, S. Blügel and S. Picozzi, Phys. Rev. B: Condens. Matter Mater. Phys., 2008, 78, 014403 CrossRef.
- X. Z. Zhang and C. R. A. Catlow, J. Mater. Chem., 1991, 1, 233 RSC.
- X. Zhang, C. K. Ong and A. M. Stoneham, J. Phys.: Condens. Matter, 1994, 6, 5647 CrossRef CAS.
- C. Zhang, X. Zhang, Y. Sun and S. Liu, Phys. Rev. B: Condens. Matter Mater. Phys., 2011, 83, 054104 CrossRef.
- M. Zaghrioui, V. Ta Phuoc, R. A. Souza and M. Gervais, Phys. Rev. B: Condens. Matter Mater. Phys., 2008, 78, 184305 CrossRef.
- M. Gerloch, J. H. Harding and R. G. Woolley, Struct. Bonding, 1981, 46, 1 CrossRef CAS.
- S. M. Woodley, C. R. A. Catlow, J. D. Gale and P. D. Battle, Chem. Commun., 2000, 1879 RSC.
- S. M. Woodley, J. D. Gale, P. D. Battle and C. R. A. Catlow, J. Chem. Phys., 2003, 119(18), 9737 CrossRef CAS PubMed.
- S. M. Woodley, P. D. Battle, J. D. Gale and C. R. A. Catlow, Chem. Mater., 2003, 15, 1669 CrossRef CAS.
- Y. Aikawa, T. Katsufuji, T. Arima and K. Kato, Phys. Rev. B: Condens. Matter Mater. Phys., 2005, 71, 184418 CrossRef.
- T. Goto, T. Kimura, G. Lawes, A. P. Ramirez and Y. Tokura, Phys. Rev. Lett., 2004, 92, 257201 CrossRef CAS.
- T. Kimura,
et al.
, Phys. Rev. B: Condens. Matter Mater. Phys., 2003, 68, 060403(R) CrossRef.
- F. Jiménez-Villacorta, J. A. Gallastegui, I. Fina, X. Marti and J. Fontcuberta, Phys. Rev. B: Condens. Matter Mater. Phys., 2012, 86, 024420 CrossRef.
- S. Ishiwata, Y. Kaneko, Y. Tokunaga, Y. Taguchi, T.-h. Arima and Y. Tokura, Phys. Rev. B: Condens. Matter Mater. Phys., 2010, 81, 100411(R) CrossRef.
- A. Muñoz, M. T. Casáis, J. A. Alonso, M. J. Martínez-Lope, J. L. Martínez and M. T. Fernández-Díaz, Inorg. Chem., 2001, 40, 1020 CrossRef.
- T. Choi and J. Lee, Appl. Phys. Lett., 2004, 84, 5043 CrossRef CAS PubMed.
- T. Yoshimura, N. Fujimura, D. Ito and T. Ito, J. Appl. Phys., 2000, 87, 3444 CrossRef CAS PubMed.
- D. Ito, N. Fujimura, T. Yoshimura and T. Ito, J. Appl. Phys., 2003, 93, 5563 CrossRef CAS PubMed.
- A. Sundaresan, A. Maignan and B. Raveau, Phys. Rev. B: Condens. Matter Mater. Phys., 1997, 56, 5092 CrossRef CAS.
- M. P. Tosi, Solid State Phys., 1964, 16, 1 CAS.
- R. A. Jackson and C. R. A. Catlow, Mol. Simul., 1988, 1, 207 CrossRef.
- B. G. Dick and A. W. Overhauser, Phys. Rev., 1958, 112, 90 CrossRef.
-
M. T. Dove, Introduction to Lattice Dynamics, Cambridge Press, Cambridge, UK, 1993 Search PubMed.
- S. M. Woodley, P. D. Battle, C. R. A. Catlow and J. D. Gale, J. Phys. Chem. B, 2001, 105, 6824 CrossRef CAS.
- A. J. Bridgeman and M. Gerloch, Prog. Inorg. Chem., 1997, 45, 179 CrossRef CAS PubMed.
-
W. H. Press, S. A. Teukolsky, W. T. Vetterling and B. P. Flannery, Numerical Recipes, Cambridge University Press, Cambridge, UK, 2nd edn, 1992 Search PubMed.
- J. D. Gale, Philos. Mag. B, 1996, 73, 3 CrossRef CAS.
- J. D. Gale, J. Chem. Soc., Faraday Trans., 1997, 93, 629 RSC.
- S. Lee, A. Pirogov, J. H. Han, J.-G. Park, A. Hoshikawa and T. Kamiyama, Phys. Rev. B: Condens. Matter Mater. Phys., 2005, 71, 180413 CrossRef.
- P. Gao, Z. Chen, T. A. Tyson, T. Wu, K. H. Ahn, Z. Liu, R. Tappero, S. B. Kim and S.-W. Cheong, Phys. Rev. B: Condens. Matter Mater. Phys., 2011, 83, 224113 CrossRef.
- M. Leslie and M. Gillan, J. Phys. C: Solid State Phys., 1985, 18, 973 CrossRef CAS.
- A. J. Overton, J. L. Best, I. Saratovsky and M. A. Hayward, Chem. Mater., 2009, 21, 4940 CrossRef CAS.
- M. O'Malley, M. A. Lockett and M. A. Hayward, J. Solid State Chem., 2007, 180, 2851 CrossRef PubMed.
- K.-J. Choi, W.-C. Shin and S.-G. Yoon, Thin Solid Films, 2001, 384, 146 CrossRef CAS.
-
CRC Handbook of Chemistry and Physics, ed. R. C. Weast, M. J. Astle and W. H. Beyer, CRC Press, Boca Raton, Florida, 64th edn, 1983–1984 Search PubMed.
- T.-J. Huang and Y.-S. Huang, Mater. Sci. Eng., B, 2003, 103, 207 CrossRef.
-
M. M. Frydenlund, MPhil thesis, Institutt for materialteknologi, 2014.
- B. Dabrowski, S. Remsen, J. Mais and S. Kolesnik, Funct. Mater. Lett., 2011, 04, 147 CrossRef CAS.
- B. C. Tofield and W. R. Scott, J. Solid State Chem., 1974, 10, 183 CrossRef CAS.
- J. F. Mitchell, D. N. Argyriou, C. D. Potter, D. G. Hinks, J. D. Jorgensen and S. D. Bader, Phys. Rev. B: Condens. Matter Mater. Phys., 1996, 54, 6172 CrossRef CAS.
|
| This journal is © The Royal Society of Chemistry 2015 |
Click here to see how this site uses Cookies. View our privacy policy here. 
 Open Access Article
 This Open Access Article is licensed under a