
Silver chlorobromide nanocubes with significantly improved uniformity: synthesis and assembly into photonic crystals†
Zheng
Li
a,
John S.
Okasinski
*b,
David J.
Gosztola
a,
Yang
Ren
b and
Yugang
Sun
*a
aCenter for Nanoscale Materials, Argonne National Laboratory, 9700 South Cass Avenue, Argonne, Illinois 60439, USA. E-mail: ygsun@anl.gov
bX-Ray Science Division, Advanced Photon Source, Argonne National Laboratory, 9700 South Cass Avenue, Argonne, Illinois 60439, USA. E-mail: okasinski@aps.anl.gov
First published on 27th October 2014
Abstract
Silver chlorobromide (AgClxBr1−x, 0 < x < 1) nanocubes with a highly uniform size, morphology, and crystallinity have been successfully synthesized through a co-precipitation of Ag+ ions with both Cl− and Br− ions in ethylene glycol containing polyvinyl pyrrolidone at mild temperatures. Compositions of the synthesized nanocubes can be easily tuned by controlling the molar ratio of Cl− to Br− ions in the reaction solutions. The size of the nanocubes is determined by varying a number of parameters including the molar ratio of Cl− to Br− ions, injection rate of Ag+ ions, and reaction temperature. The real-time formation of colloidal AgClxBr1−x nanocubes has been monitored, for the first time, by in situ high-energy synchrotron X-ray diffraction. The time-resolved results reveal that a fast injection rate of Ag+ ions is critical for the formation of AgClxBr1−x nanocubes with a highly pure face-centered cubic crystalline phase. The improved uniformity of the AgClxBr1−x nanocubes is beneficial for assembling them into order superlattices (e.g., photonic crystals) even by simply applying centrifugation forces. The stop band of the resulting photonic crystals can be easily tuned from the ultraviolet to the infrared region by using AgClxBr1−x nanocubes with different sizes. The variation of the dielectric constant of AgClxBr1−x associated with the change of the relative concentration of halide ions provides an additional knob to tune the optical properties of photonic crystals.
Introduction
Nanoparticles of silver halides have attracted tremendous attention in the past several years due to their potential applications in high-efficiency photocatalysis,1–8 biosensing,9,10 and disinfection of microbacteria.11–13 For instance, silver chloride (AgCl) nanocrystals have been hybridized with platinum electrodes,14 zeolites,15 and colloidal gold16 to provide the capability for oxidizing water to generate oxygen under light irradiation. Performance of the silver halide nanoparticles in these applications is usually dependent on their morphology, size, composition, and crystal structure. We recently reported the successful synthesis of highly pure silver chlorobromide nanoparticles through a co-precipitation of hexadecyltrimethylammonium chloride (CTAC) and hexadecyltrimethylammonium bromide (CTAB) with silver nitrate (AgNO3) in aqueous solutions.17 Cai reported similar results with CTAC/CTAB in a microemulsion system.18 Such ternary AgClxBr1−x nanoparticles exhibited higher photocatalytic activity than their counterpart binary AgBr and AgCl nanoparticles. However, the as-synthesized AgClxBr1−x nanoparticles exhibited random morphologies or relatively broad size distributions possibly due to the lack of ligand preference on selective crystal surfaces and the lack of control over reaction kinetics. In addition, silver halides (including the ternary AgClxBr1−x) have high refractive indexes that can aid in the fabrication of photonic crystals with broad band gaps. Although they are promising to serve as a high-efficiency waveguide,19–25 only a few groups reported the use of high refractive index materials (e.g., ZnS)26,27 for this purpose. Therefore, synthesis of silver chlorobromide nanoparticles with high uniformity in size, morphology, and composition is important to fabricate hierarchical superstructures of these nanoparticles, enabling the exploration of more applications and elucidation of the structure–performance relationship.In this paper, we report a controlled co-precipitation approach for the synthesis of AgClxBr1−x nanocubes with a well-defined cubic morphology, highly uniform sizes, and finely tuned compositions. Real-time monitoring of the precipitation reactions with in situ time-resolved, high-energy synchrotron X-ray diffraction28 reveals that the nucleation and growth steps involved in the formation of AgClxBr1−x nanocubes can be separated and kinetically controlled in ethylene glycol with high viscosity that can be tuned by controlling the temperature to determine the solubility of precursors and AgClxBr1−x and the diffusion rate of ionic species. The good separation and controllability over the nucleation and growth is critical for the production of AgClxBr1−x nanocubes with significantly improved uniformity. The sizes and compositions of AgClxBr1−x nanocubes can be precisely tuned by carefully controlling the reaction conditions including reaction temperatures, composition of precursors, and injection rate of precursors. Due to the high quality of the synthesized AgClxBr1−x nanocubes, they can be assembled to form photonic bandgap crystals even through a simple and fast centrifugation.
Experimental
Synthesis of AgClxBr1−x nanoparticles was carried out through co-precipitation reactions in ethylene glycol solutions in the dark and under a nitrogen atmosphere. In a typical reaction, 0.35 mmol of NaCl (Fisher Chemicals) and KBr (Sigma-Aldrich) with varying ratios of ([KBr]/[NaCl]) and 2.5 g of PVP (MW ∼ 55![[thin space (1/6-em)]](https://www.rsc.org/images/entities/char_2009.gif) 000, Sigma-Aldrich) were dissolved in 12 mL ethylene glycol (J. T. Baker) assisted by heating the solution to 60 °C. To this solution 1 mL ethylene glycol solution of AgNO3 (0.34 M, Sigma-Aldrich) was injected at an injection rate of 1 mL min−1 with the assistance of a syringe pump (KDS-200, KD Scientific, Holliston, MA). The reaction lasted another 2 hours while the temperature was maintained at 60 °C. All the reaction conditions present in the article could be found in the details listed in Table S1.†
000, Sigma-Aldrich) were dissolved in 12 mL ethylene glycol (J. T. Baker) assisted by heating the solution to 60 °C. To this solution 1 mL ethylene glycol solution of AgNO3 (0.34 M, Sigma-Aldrich) was injected at an injection rate of 1 mL min−1 with the assistance of a syringe pump (KDS-200, KD Scientific, Holliston, MA). The reaction lasted another 2 hours while the temperature was maintained at 60 °C. All the reaction conditions present in the article could be found in the details listed in Table S1.†
X-ray diffraction patterns of dry powders were collected at beamline 11-ID-C of the Advanced Photon Source (APS). For the time-resolved XRD measurement, the reaction was performed similarly as described in the previous paragraph with the use of custom-made glassware specifically designed for in situ experiments.29,30 When the AgNO3 solution was injected into the reaction solution, the high-energy (70 keV) synchrotron X-ray beam at beamline 1-ID-C of the APS was simultaneously opened to probe the reaction and XRD patterns were continuously recorded at a frequency of 1 pattern per min. In order to minimize the possible influence of X-ray irradiation on the reaction, the exposure time for collecting a single pattern was only 1 s. The X-ray beam size was 0.30 mm × 0.30 mm. The XRD patterns were recorded with four well-aligned GE 41RT area detectors. The position and orientation of the detectors with respect to the sample were calibrated using LaB6 powders dispersed in ethanol in the same reaction vessel. The two-dimensional diffraction patterns were reduced with the fit2d program and with a correction for dark current, gain, and dead pixels. The background scattering was determined from an ethylene glycol solution of PVP with the same concentration as the reaction solution and was subtracted from all diffraction patterns.
Scanning electron microscopy (SEM) images were recorded with a JEOL JSM-7500F field emission scanning electron microscope and an FEI Quanta 400F ESEM operating at high vacuum mode. The samples were prepared according to the following procedure. A 0.5 mL dispersion of the synthesized nanoparticles was mixed with 1.5 mL of ethanol (Fisher). The diluted dispersion was then centrifuged at 14000g for 5 min and the supernatant was decanted. The nanoparticles at the bottom of the centrifuge tube were re-dispersed with 2 mL of ethanol followed by centrifugation at 14000g for 5 min. After the supernatant was decanted, the precipitated nanoparticles were re-dispersed into an appropriate amount of ethanol depending on the concentration we anticipated. A drop of the nanoparticle dispersion was delivered to a small piece of silicon wafer followed by drying in a vacuum desiccator in the dark.
Assembly of the synthesized AgClxBr1−x nanocubes into photonic bandgap crystals was performed via centrifugation of nanocube dispersions in centrifuge tubes. In a typical experiment, 0.3 mL original dispersion of nanocubes was mixed with 1.5 mL ethanol followed by centrifugation at 2900g for 5 min. The supernatant was discarded and the precipitated nanoparticles were re-dispersed with 1.8 mL ethanol to form a dispersion that was then centrifuged at 2900g for 5 min. After the supernatant was decanted, the precipitated nanoparticles were dispersed again with 1.8 mL ethanol. The resulting ethanol dispersion of clean nanocubes was centrifuged at 14000g for 10 min, resulting in the formation of a colorful precipitate corresponding to the formation of a photonic bandgap crystal. After the supernatant was carefully removed from the centrifuge tube, the precipitated photonic crystal was removed with double-sided tape for characterization. The reflection spectra of the photonic crystals formed from the assembly of different nanocubes were recorded with a home-built Visible/Near-IR Microscope operating at reflection mode. A silver-coated mirror (Thorlabs) was used as a reference for calibration.
Results and discussion
Silver chlorobromide (AgClxBr1−x, 0 < x < 1) nanoparticles were synthesized through the precipitation of Ag+ ions in the presence of both Cl− and Br− ions in warm ethylene glycol solutions:| Ag+ + xCl− + (1 − x)Br− → AgClxBr1−x↓ | (1) |
In a typical synthesis, an ethylene glycol solution of AgNO3 is added at a controlled injection rate to an ethylene glycol solution containing NaCl, KBr, and poly(vinyl pyrrolidone) (PVP) that is preheated at 60 °C. Mixing AgNO3 with NaCl and/or KBr in the ethylene glycol solution can quickly form a dispersion of solid particles. The colors of the resulting dispersions vary from milky white to milky light yellow when the molar ratio of KBr to NaCl increases. The change in color is mainly ascribed to the difference in the composition of the synthesized AgClxBr1−x particles, in which x varies in the range of 0–1 depending on the synthesis recipe. PVP molecules serve as the surfactant coating on the synthesized nanoparticles to prevent them from aggregation during growth and post-treatments.
Characterization of AgClxBr1−x nanoparticles
Fig. 1 presents typical scanning electron microscopy (SEM) images of the nanoparticles obtained from the reactions with different molar ratios of NaCl to KBr when the overall concentration of NaCl and KBr remains constant. The reaction involving only NaCl leads to the formation of a product containing a majority of small nanoparticles and a small portion of large nanocubes (Fig. 1a). The bimodal size distribution might be ascribed to the possible occurrence of two separated self-nucleation processes. The synthesized nanoparticles are highly uniform in terms of both size and shape (i.e., cube) when a certain amount of NaCl is replaced with KBr (Fig. 1b–f). As the concentration of KBr increases, the size of the nanocubes decreases accordingly. The nanoparticles become relatively small in size when the molar ratio of KBr to NaCl reaches a high value (e.g., 3:1 and 1:0 as shown in Fig. 1g and h, respectively). Although their size distributions are still narrow, their morphologies cannot be well defined.
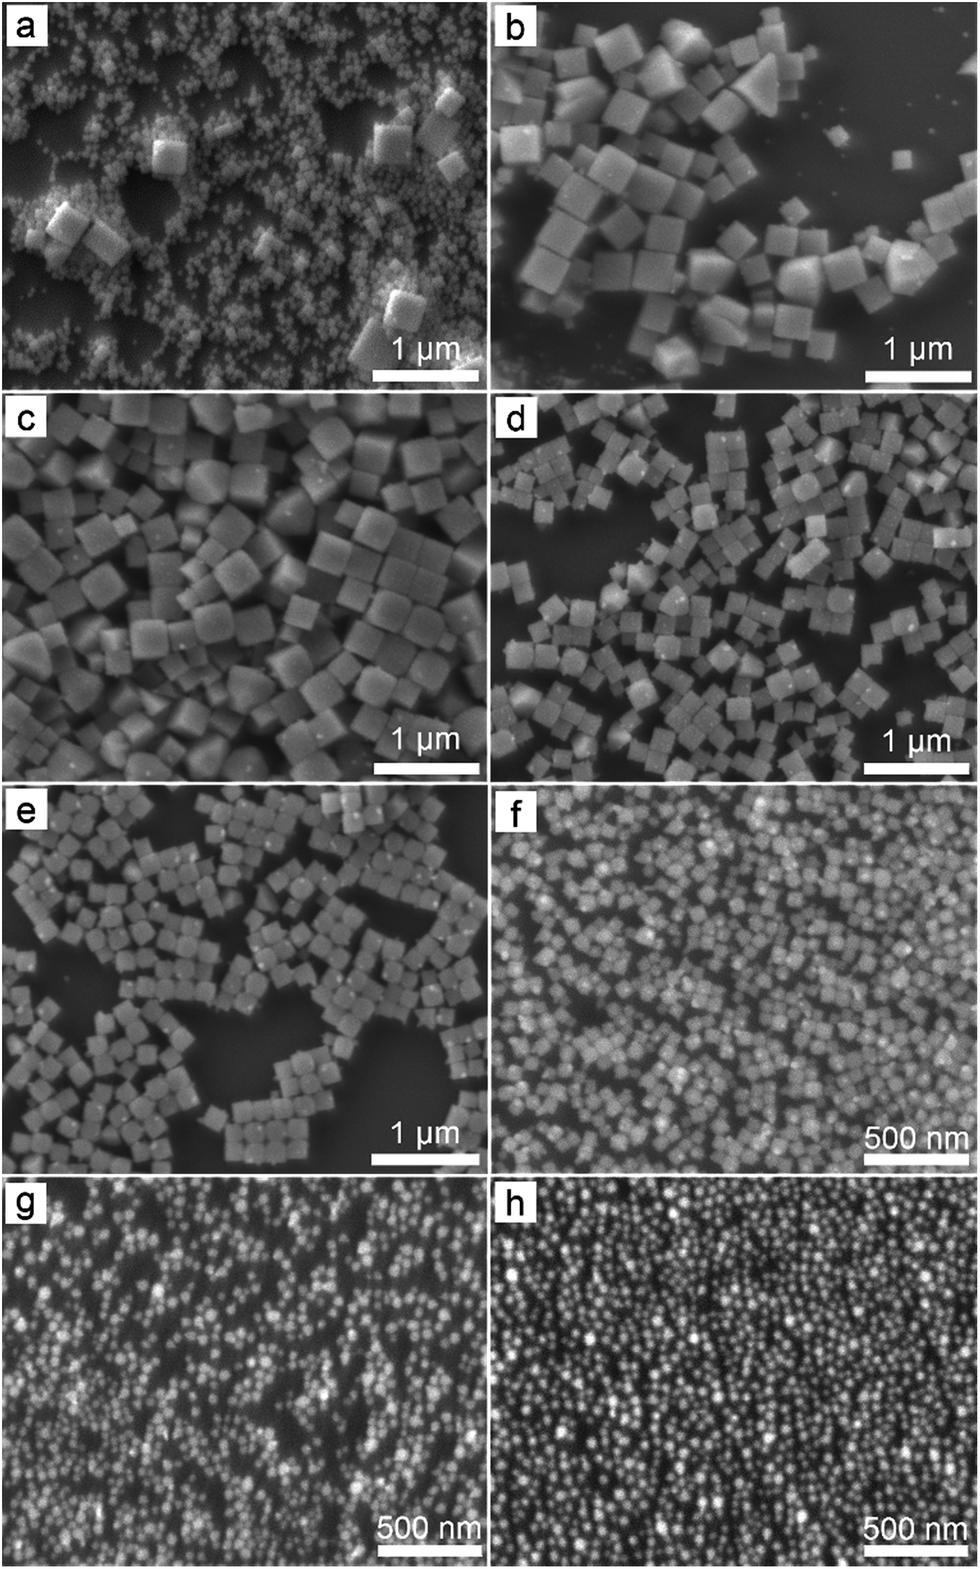 | ||
| Fig. 1 SEM images of the AgClxBr1−x nanoparticles synthesized from the solutions containing KBr and NaCl with different molar ratios [KBr]/([NaCl] + [KBr]): (a) 0/8, (b) 1/8, (c) 2/8, (d) 3/8, (e) 4/8, (f) 5/8, (g) 6/8, and (h) 8/8. The overall concentration of KBr and NaCl in the reaction solution was 26.9 mM. The final concentration of AgNO3 in the reaction solution was 26.2 mM. The slightly reduced concentration of AgNO3 in comparison with the total concentration of KBr and NaCl was chosen to ensure the complete precipitation of Ag+ ions. The injection rate of the AgNO3 solution (0.34 M, 1 mL) was 1 mL min−1 and the reaction temperature was 60 °C. | ||
Variation of the molar ratio of anions (i.e., [Br−]/[Cl−]) in the reaction solutions results in the formation of AgClxBr1−x nanocubes (or small nanoparticles with an undefined morphology) with tunable compositions that is responsible for the different colors of different products. The crystallographic phases of the synthesized nanoparticles shown in Fig. 1 have been characterized by X-ray diffraction (XRD) using highly monochromic synchrotron X-rays. As shown in Fig. 2a, the XRD pattern of each sample is consistent with a pure face-centered cubic crystalline lattice (Fm![[3 with combining macron]](https://www.rsc.org/images/entities/char_0033_0304.gif) m space group) regardless of the [Br−]/[Cl−] ratio in the reaction solution. The highly crystalline purity indicates that both Br− and Cl− homogeneously distribute in the crystalline lattices of the synthesized nanoparticles. From the top to bottom in Fig. 2a, the nanoparticles correspond to the reaction conditions with the decreasing molar ratio of KBr to NaCl. The XRD pattern (green curve, bottom) of the nanoparticles formed from the reaction solution containing only NaCl matches perfectly with the standard diffraction pattern of AgCl as highlighted by the sticks attached to the bottom axis. Similarly, the XRD pattern (orange curve, top) of the nanoparticles synthesized from the solution containing only KBr agrees well with pure AgBr that exhibits a standard diffraction pattern as highlighted by the sticks attached to the top axis. The XRD patterns of the samples synthesized using the mixtures of NaCl and KBr do not show signals corresponding to either AgCl or AgBr, indicating that no binary products (i.e., AgCl or AgBr) are formed. Instead, each sample exhibits similar XRD patterns, except the peak positions and relatively peak intensities differ. The peak positions gradually shift from high to low diffraction angles with an increase of the molar ratio of KBr to NaCl, corresponding to the XRD patterns from the bottom to top in Fig. 2. This is in accordance with the fact that Br− ions are larger than Cl− ions, which results in larger unit cells in AgClxBr1−x with a smaller x value. This dependence of the diffraction peak position on the reaction conditions can be appreciated more obviously by plotting the enlarged (200) peaks in Fig. 2b. The compositions of the synthesized nanoparticles could be estimated by following Vegard's law:31
m space group) regardless of the [Br−]/[Cl−] ratio in the reaction solution. The highly crystalline purity indicates that both Br− and Cl− homogeneously distribute in the crystalline lattices of the synthesized nanoparticles. From the top to bottom in Fig. 2a, the nanoparticles correspond to the reaction conditions with the decreasing molar ratio of KBr to NaCl. The XRD pattern (green curve, bottom) of the nanoparticles formed from the reaction solution containing only NaCl matches perfectly with the standard diffraction pattern of AgCl as highlighted by the sticks attached to the bottom axis. Similarly, the XRD pattern (orange curve, top) of the nanoparticles synthesized from the solution containing only KBr agrees well with pure AgBr that exhibits a standard diffraction pattern as highlighted by the sticks attached to the top axis. The XRD patterns of the samples synthesized using the mixtures of NaCl and KBr do not show signals corresponding to either AgCl or AgBr, indicating that no binary products (i.e., AgCl or AgBr) are formed. Instead, each sample exhibits similar XRD patterns, except the peak positions and relatively peak intensities differ. The peak positions gradually shift from high to low diffraction angles with an increase of the molar ratio of KBr to NaCl, corresponding to the XRD patterns from the bottom to top in Fig. 2. This is in accordance with the fact that Br− ions are larger than Cl− ions, which results in larger unit cells in AgClxBr1−x with a smaller x value. This dependence of the diffraction peak position on the reaction conditions can be appreciated more obviously by plotting the enlarged (200) peaks in Fig. 2b. The compositions of the synthesized nanoparticles could be estimated by following Vegard's law:31
| aAgClxBr1−x = xaAgCl + (1 − x)aAgBr, | (2) |
 | ||
| Fig. 2 XRD patterns of silver chlorobromide nanoparticles synthesized from the reaction solutions containing NaCl and KBr with increasing molar ratios of [KBr]/([NaCl] + [KBr]): 0/8, 1/8, 2/8, 3/8, 4/8, 5/8, 6/8, 7/8, and 8/8 (from bottom to top). (a) XRD patterns in the range of 1.8°–5.6° and (b) in the range of 2.05°–2.3° highlighting the (200) peaks. The sticks attached to the bottom and top axes in (a) correspond to the positions and relative intensities of the standard XRD patterns of AgCl (JCPDS no. 85-1355) and AgBr (JCPDS no. 79-0149), respectively. The x values in (b) are calculated from the Vegard's law to highlight the compositions of the synthesized nanoparticles. The wavelength of the X-ray used for collecting the XRD patterns was 0.1080 Å. These ex situ XRD patterns were measured at 11-ID-C of APS. | ||
In situ probing of the formation of colloidal AgClxBr1−x nanoparticles
The formation of AgClxBr1−x nanoparticles with pure crystalline phases has been probed in real time by using the in situ, time-resolved, high-energy synchrotron XRD technique that has been developed recently.28–30,32 The use of high-energy, high-flux, synchrotron X-rays as the probe is critical for realizing the real-time monitoring because of their strong penetration power in large-volume reaction solutions. The XRD patterns taken from the reaction solution that is used for the synthesis of nanoparticles shown in Fig. 1e are plotted in Fig. S1.† In this synthesis, the AgNO3 solution (1 mL) is injected at a rate of 1 mL min−1 to the reaction solution containing anions ([Cl−]/[Br−] = 1:1) with an overall amount similar to that of the Ag+ cation. The XRD patterns clearly show that the nanoparticles start to generate detectable diffraction signals only after the AgNO3 solution has been completely added to the reaction solution (i.e., at time >60 s normalized against the time at which the injection of AgNO3 solution starts). The representative XRD patterns at some reaction times are plotted in Fig. 3, highlighting the major changes involved in the formation of nanoparticles. Although the precipitation reaction of Ag+ and Cl− (Br−) ions is very fast in aqueous solution, the reaction is significantly slowed in ethylene glycol solutions due to the increased solvent viscosity that can reduce the diffusion coefficient of ionic species. The slowed reaction rate is consistent with that no significant signal could be discerned at 60 s. The major (200) peak is still barely identifiable at a time of 61 s although the diffraction signals increase. At 65 s, both (200) and (220) peaks are well developed and exhibit symmetric profiles. The intensity of the peaks continuously increases with the increase in the reaction time, indicating the formation of more AgClxBr1−x. Meanwhile more diffraction peaks become observable and the positions of these diffraction peaks remain unchanged throughout the synthesis. These results indicate that the formation of crystalline pure AgClxBr1−x nanoparticles initiates from the formation of nuclei with the same pure crystalline phase followed by continuous growth with the same composition.
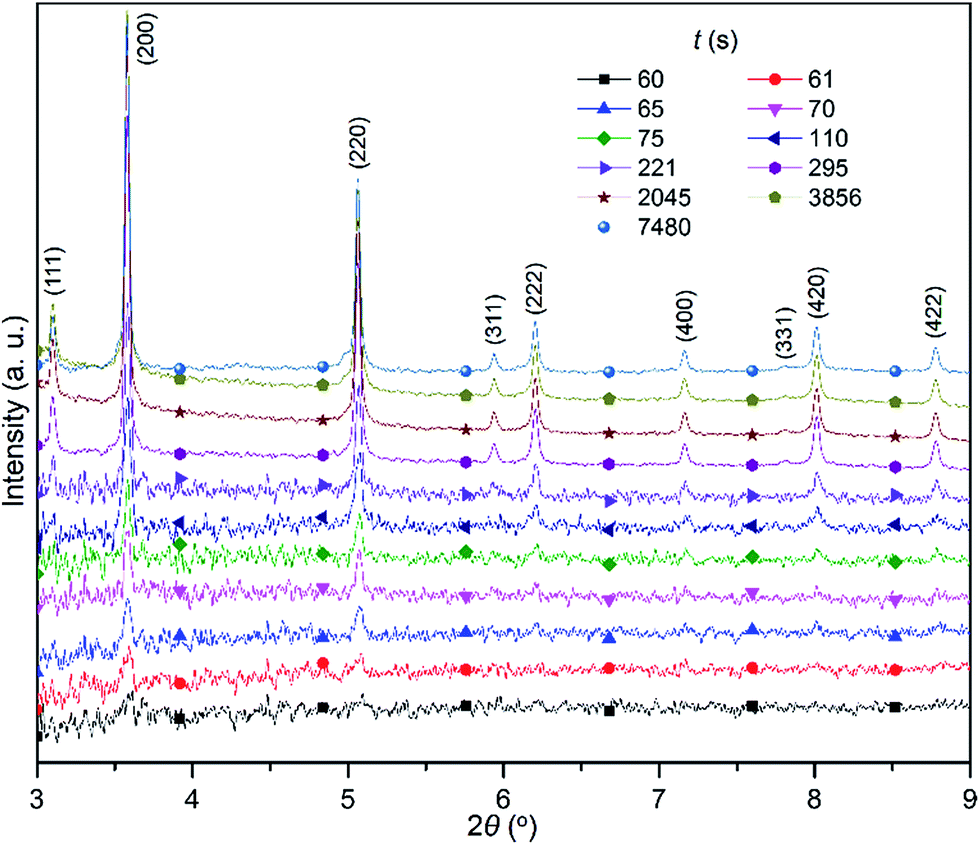 | ||
| Fig. 3 XRD patterns taken from the reaction solution that was used for the synthesis of AgClxBr1−x nanocubes shown in Fig. 1e. Different patterns were recorded at different times (t) normalized against time when the AgNO3 solution was injected into the reaction solution. The wavelength of the X-ray was 0.1771 Å. | ||
It has been found that the compositional and crystalline purity of the products can be influenced by the injection rate of the AgNO3 solution. For example, decreasing the injection rate by 5 fold to 0.2 mL min−1 leads to the formation of two types of AgClxBr1−x nanoparticles with different compositions (Fig. S2 and S3†). Formation of nanoparticles begins to be detected by XRD until ∼140 s when only 47% of the AgNO3 solution is added to the reaction solution. The delayed observation of XRD signals indicates that formation of silver halide nanoparticles in the viscous ethylene glycol solution containing halide anions requires the concentration of Ag+ to be higher than a critical value and a period of time to allow the condensation of the solid phase from the homogeneous liquid environment. The XRD patterns at short reaction times (<240 s at which 80% of the AgNO3 solution has been added to the reaction solution) correspond to a crystalline phase of AgClxBr1−x with a much higher concentration of Br− (i.e., x = 0.07) in comparison with that shown in Fig. 3. The compositional difference between the nanoparticles formed at short times in Fig. S3† and those shown in Fig. 3 is ascribed to the fact that the concentration of Ag+ ions is much less than the halide anions in the reaction solution of Fig. S3† at short times. The solubility product constant of AgBr is over two orders of magnitude smaller than AgCl in H2O (KAgBrsp = 5.35 × 10⁻¹³, KAgClsp = 1.77 × 10⁻¹⁰ at 25 °C).17 Although there are no precise values, it is believed that the relative solubility of both AgBr and AgCl in ethylene glycol is similar to that in water, and the relative order of solubility is the same.33 As a result, the Ag+ ions prefer to precipitate with Br− ions at a low concentration of Ag+ ions, leading to the formation of AgClxBr1−x nanoparticles with a significantly enriched bromide concentration. Such a preferential precipitation reaction leads to the consumption of more Br− in comparison with Cl− ions, resulting in an enrichment of Cl− in the reaction solution. Once the concentration of Cl− in the reaction solution is high enough, formation of AgClxBr1−x nanoparticles with enriched chloride concentration starts to occur after 240 s. The XRD patterns in Fig. S2 and S3† clearly show the formation of AgClxBr1−x nanoparticles with two different compositions (i.e., x = 0.07 and 0.57). Apparently the formation of two types of AgClxBr1−x nanoparticles is associated with two sequential nucleation/growth processes and the resulting nanocubes exhibit a bimodal size distribution (Fig. S4†). The in situ characterization clearly indicates that the size uniformity and compositional purity of the AgClxBr1−x nanocubes can be significantly influenced by the injection rate of AgNO3 solution (see the examples shown in Fig. 1e and S4†). The comparison of different reactions implies that complete addition of the AgNO3 solution to a reaction solution before the formation of nanoparticles starts is critical for the formation of uniform AgClxBr1−x nanocubes with a pure composition.
Size control over the AgClxBr1−x nanocubes
In a reaction solution containing a fixed concentration of Ag+ ions and halide anions, the average size of nanoparticles is determined by the number of nanoparticles, i.e., the number of corresponding nuclei formed at the nucleation step. More nuclei are formed in a reaction solution, so the size of the resulting AgClxBr1−x nanocubes becomes smaller. According to the LaMer's nucleation model, formation of solid nuclei in the homogeneous reaction solutions is determined by how fast the critical supersaturation can be reached.34,35 In general, quickly reaching the critical supersaturation condition is beneficial for the formation of a high concentration of nuclei. As shown in the reaction (eqn (1)), increasing the concentration of Ag+ in a short time and/or reducing the solubility of the resulting AgClxBr1−x can help establishing the critical supersaturation required for nucleation, and thus increasing the concentration of nuclei and decreasing the size of final nanoparticles accordingly. This argument is consistent with the results shown in Fig. 1. The only difference of the reaction conditions is the molar ratio of Br− to Cl− ions for the synthesis of differently sized nanocubes shown in Fig. 1. The higher the concentration of Br− in AgClxBr1−x, the lower the solubility of AgClxBr1−x is because of the lower solubility of AgBr than AgCl. Therefore more nuclei are formed in the reaction solution containing a higher concentration of Br− ions. The average size of the corresponding nanocubes is smaller (Fig. 4). Since each nanocube is a single crystal, the dimensional difference of these nanocubes can also be reflected from the variations of peak width of the XRD patterns shown in Fig. 2, i.e., the XRD patterns of smaller nanocubes exhibit broader diffraction peaks.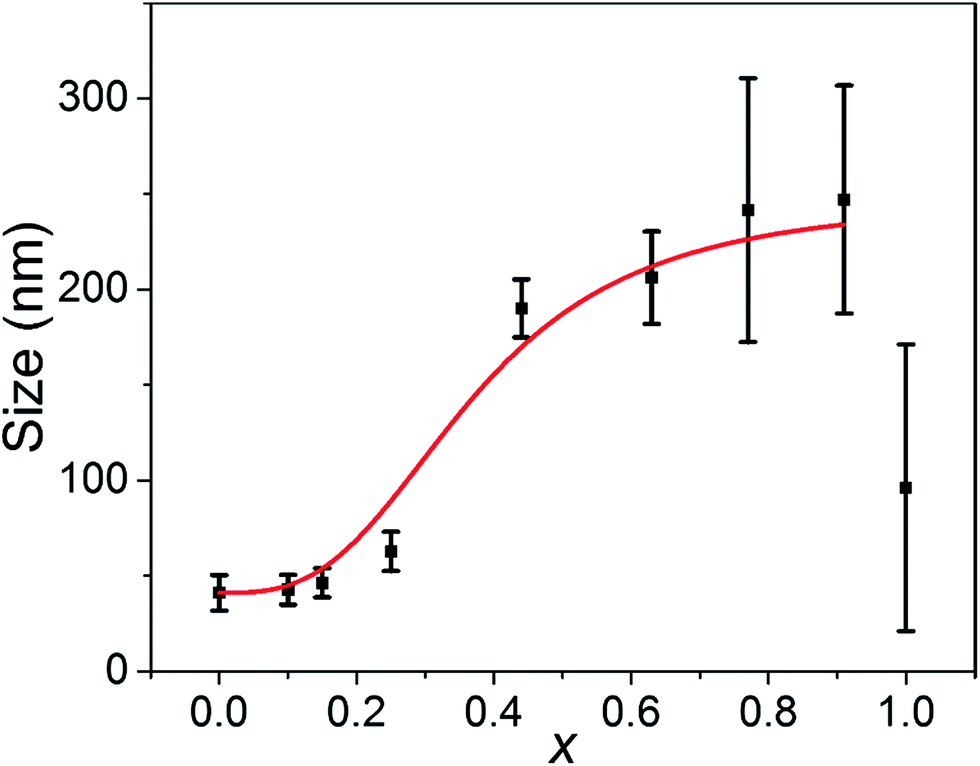 | ||
| Fig. 4 Dependence of the size of the synthesized AgClxBr1−x nanoparticles on their compositions. Their sizes were determined from the SEM images. The error bars represent the statistic deviation of σ highlighted in Fig. S6.† The reaction conditions were the same as in Fig. 1. The red curve is for guidance only. | ||
The relative concentration of anions (i.e., Cl−versus Br−) is critical to control the size and quality of the synthesized nanocubes. In contrast, the type of cations (e.g., K+, Na+) does not show influence on the synthesized nanocubes. For instance, nanocubes synthesized by using the same concentration of KBr and NaBr, clearly show similarity in the cubic morphology, size (i.e., 146 nm for KBr reaction versus 145 nm for NaBr reaction), and narrow size distribution.
The critical supersaturation condition for nucleation can also be quickly reached by adding the AgNO3 solution at a high rate. A high concentration of nuclei (and thus small nanocubes) is expected for the reaction occurring at a high injection rate of the AgNO3 solution while other reaction conditions are constant. The SEM images in Fig. 5 represent the nanocubes synthesized at different rates of injecting the AgNO3 solution. The average sizes of the nanocubes at the injection rate of 1.5 mL min−1, 2 mL min−1, and 60 mL min−1 are 146 nm, 132 nm, and 82 nm, respectively. The nanocubes shown in Fig. 1e are synthesized at an even slower injection rate of 1 mL min−1 and exhibit an average size of 190 nm. The comparisons clearly indicate that the size of the AgClxBr1−x nanocubes decreases with the increase of the injection rate of the AgNO3 solution (Fig. 5d).
 | ||
| Fig. 5 (a–c) SEM images of the AgClxBr1−x nanocubes synthesized by injecting the AgNO3 solution (1 mL) at different injection rates: (a) 1.5, (b) 2, and (c) 60 mL min−1. (d) Dependence of the average size of the AgClxBr1−x nanocubes on the injection rate of the AgNO3 solution. Other reaction conditions are the same as those of Fig. 1e. The scale bar in (a) also applies to (b) and (c). | ||
In addition, reaction temperature can also influence the nucleation process. For instance, increasing the reaction temperature can increase the solubility of AgClxBr1−x and slow the speed required to reach the supersaturation condition for nucleation. As a result, nuclei with a lower concentration are expected to form in a reaction solution at a higher temperature while other reaction conditions are maintained. Accordingly, the size of nanocubes formed at a higher temperature would be larger, which is consistent with the results shown in Fig. 6. The average size of the nanocubes increases from 190 nm to 203 nm when the reaction temperature increases from 60 °C to 80 °C. Increasing temperature can activate the reducing ability of ethylene glycol that might be able to reduce AgClxBr1−x to form metallic Ag components in the nanocubes. We avoid further increasing the reaction temperature in this work in order to maintain the compositional purity of the synthesized AgClxBr1−x nanocubes.
 | ||
| Fig. 6 SEM images of the AgClxBr1−x nanocubes synthesized at different reaction temperatures: (a) 60 °C and (b) 80 °C. Other reaction conditions are the same as those of Fig. 1e. | ||
Assembly of the AgClxBr1−x nanocubes and their photonic properties
The synthesized AgClxBr1−x nanocubes exhibit high uniformity in terms of both morphology and size, which are beneficial for them to be assembled into superlattices. For example, the AgCl0.44Br0.56 nanocubes shown in Fig. 7 can be easily assembled to form ordered superlattices through centrifugation in a centrifuge tube. The dispersion of the nanocubes in ethanol is a turbid solution with a milky color (left inset). Centrifuging the dispersion at 14000g for 5 minutes forces all the nanocubes to settle down at the bottom of the centrifuge tube, leaving a transparent supernatant (middle inset). It is very interesting to note that the nanocubes form a precipitated solid with a greenish-blue color (right inset). This significant difference in colors of the dispersed nanocubes and settled nanocubes indicates that the highly uniform AgCl0.44Br0.56 nanocubes are assembled to form a superlatticed structure similar to a photonic bandgap crystal that is usually colorful even when the corresponding nanoscale building blocks are colorless or opaque.
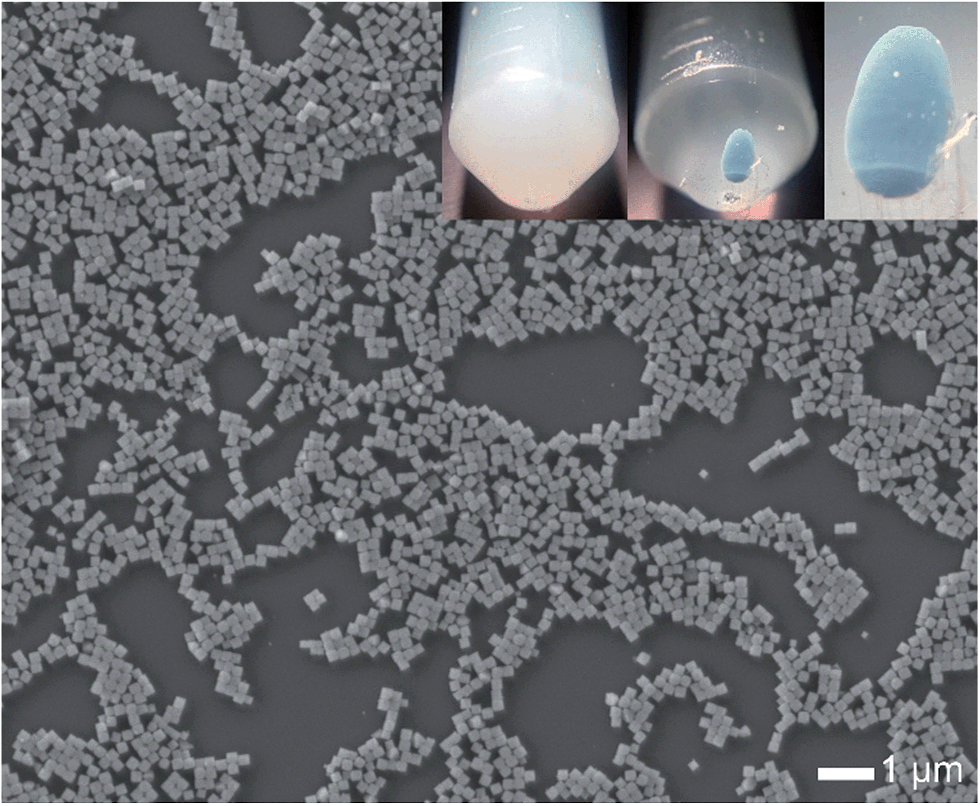 | ||
| Fig. 7 A typical large-area SEM image of the synthesized AgCl0.44Br0.56 nanocubes as shown in Fig. 1e, further confirming their morphological and dimensional uniformity. The insets represent the photographs of an ethanol dispersion of the nanocubes before (left) and after (middle) centrifugation. The image of the right inset corresponds to the enlargement of the colorful nanocube assembly in the middle inset. | ||
AgClxBr1−x nanocubes with varying sizes can be synthesized while the high uniformity is maintained. Centrifuging dispersions of the differently sized nanocubes results in the formation of precipitated solids with different colors. For example, Fig. 8 presents the SEM images of the ordered superlattices formed from different nanocubes through centrifugation, clearly showing the closely packed assemblies with cubic symmetries. The sizes of ordered domains are up to tens of micrometers and may be limited by the curved surface at the bottom of the centrifuge tubes, where the superlattices are formed, and by the cracks formed during the drying of assemblies. The superlattices assembled from the nanocubes with sizes of 82 nm, 132 nm, 146 nm, and 203 nm exhibit violet, greenish-yellow, red, and black colors, respectively (from Fig. 8a–d). These colors are consistent with the stop bands of photonic crystals highlighted in the reflection spectra that are recorded under an optical microscope with a white light probe of 0.5 × 4 μm in size. The probe beam is perpendicular to the surfaces of the photonic crystals. Due to the limitations of the spectrometer equipped on the optical microscope, the reflection spectra have been recorded only in the visible and near-infrared range (420–950 nm). The stop band positions of the photonic crystals shown in Fig. 8 are estimated at <420 nm, 608 ± 11 nm, 650 ± 3 nm, and 938 nm (or 463 ± 6 nm for the secondary ordered reflection) by analyzing the reflection spectra obtained from multiple spots of each sample. According to the Bragg condition:36
| mλ = 2ndhklsinθ, | (3) |
 | ||
| Fig. 8 SEM images (top) and reflectivity spectra (bottom) of the photonic bandgap crystals that were assembled from AgCl0.44Br0.56 nanocubes with different sizes: (a) 82 nm, (b) 132 nm, (c) 146 nm, and (d) 203 nm. The scale bar in (a) also applies to (b–d). The spectra shown in each frame were acquired from multiple random spots on the same photonic bandgap crystal. | ||
| Size of nanocubes (nm) | Observed color | Reflection peak position λ (nm) | Calculated stop band position (nm) |
|---|---|---|---|
| 82 | Violet | <420 | 375 |
| 132 | Greenish yellow | 608 ± 11 | 593 |
| 146 | Red | 650 ± 3 | 654 |
| 203 | Black | 938 (m = 1), 463 ± 6 (m = 2) | 903 (m = 1), 451 (m = 2) |
Conclusions
Co-precipitation of Ag+ with Br− and Cl− ions in ethylene glycol solution with high viscosity tunable upon temperature change has been carried out for the synthesis of ternary silver chlorobromide nanocubes with high uniformity in terms of morphology, size, crystallinity, and composition. In situ, time-resolved, high-energy synchrotron X-ray diffraction has been used for the first time to monitor the formation of AgClxBr1−x nanocubes in real time, revealing that the feeding speed of AgNO3 solution and reaction temperature represent the most critical parameters for realizing uniformity and dimensional tunability of the synthesized nanocubes. For instance, the high injection rate of the AgNO3 solution promotes the uniformity and decreases the size of the AgClxBr1−x nanocubes. The high uniformity of the synthesized AgClxBr1−x nanocubes is beneficial for assembling these nanocubes to form ordered superlattices, such as photonic bandgap crystals through simple centrifugation. Nanocubes with sizes ranging from 82 to 203 nm have been assembled into photonic crystals with stop band positions covering from the ultraviolet (below 420 nm) to near-infrared range (938 nm). In addition, the refractive index of the AgClxBr1−x nanocubes can be tuned by varying the composition (i.e., the ratio of Br− to Cl−), adding another dimension for controlling the stop band of the corresponding photonic crystals to explore more potential applications.Acknowledgements
This work was performed at the Center for Nanoscale Materials, U.S. Department of Energy, Office of Science, Office of Basic Energy Sciences User Facility under Contract no. DE-AC02-06CH11357. Use of the Advanced Photon Source (1-ID-C, 11-ID-C) and the Electron Microscopy Center for Materials Research at Argonne National Laboratory was supported by the U.S. Department of Energy, Office of Science, Office of Basic Energy Sciences, under contract no. DE-AC02-06CH11357.Notes and references
- K. Chandrasekaran and J. K. Thomas, Chem. Phys. Lett., 1983, 97, 357 CrossRef CAS.
- P. Wang, B. Huang, X. Qin, X. Zhang, Y. Dai, J. Wei and M. H. Whangbo, Angew. Chem., Int. Ed., 2008, 47, 7931 CrossRef CAS PubMed.
- C. An, S. Peng and Y. Sun, Adv. Mater., 2010, 22, 2570 CrossRef CAS PubMed.
- Y. Sun, J. Phys. Chem. C, 2010, 114, 2127 CAS.
- S. Peng and Y. Sun, J. Mater. Chem., 2011, 21, 11644 RSC.
- X. Ma, Y. Dai, J. Lu, M. Guo and B. Huang, J. Phys. Chem. C, 2012, 116, 19372 CAS.
- L. Ye, J. Liu, C. Gong, L. Tian, T. Peng and L. Zan, ACS Catal., 2012, 2, 1677 CrossRef CAS.
- C. An, J. Wang, J. Liu, S. Wang and Y. Sun, ChemSusChem, 2013, 6, 1931 CrossRef CAS PubMed.
- W. Yan, X. Feng, X. Chen, X. Li and J.-J. Zhu, Bioelectrochemistry, 2008, 72, 21 CrossRef CAS PubMed.
- W. Yan, X. Feng, X. Chen, W. Hou and J.-J. Zhu, Biosens. Bioelectron., 2008, 23, 925 CrossRef CAS PubMed.
- B. Tomsic, B. Simoncic, B. Orel, M. Zerjav, H. Schroers, A. Simoncic and Z. Samardzija, Carbohydr. Polym., 2009, 75, 618 CrossRef CAS PubMed.
- S. H. Min, J. H. Yang, J. Y. Kim and Y. U. Kwon, Microporous Mesoporous Mater., 2010, 128, 19 CrossRef CAS PubMed.
- Y. Li, L. Yang, Y. Zhao, B. Li, L. Sun and H. Luo, Mater. Sci. Eng., C, 2013, 33, 1808 CrossRef CAS PubMed.
- M. Lanz, D. Schurch and G. Calzaferri, J. Photochem. Photobiol., A, 1999, 120, 105 CrossRef CAS.
- V. R. Reddy, A. Currao and G. Calzaferri, J. Mater. Chem., 2007, 17, 3603 RSC.
- A. Currao, V. R. Reddy and G. Calzaferri, ChemPhysChem, 2004, 5, 720 CrossRef CAS PubMed.
- Z. Li and Y. Sun, J. Mater. Chem. A, 2013, 1, 6786 CAS.
- B. Cai, J. Wang, D. Han, S. Gan, Q. Zhang, Z. Wu and L. Niu, Nanoscale, 2013, 5, 10989 RSC.
- E. Rave, L. Nagli and A. Katzir, Opt. Lett., 2000, 25, 1237 CrossRef CAS.
- B. Dekel and A. Katzir, Opt. Lett., 2001, 26, 1553 CrossRef CAS.
- J. Calcines, H. M. Dolan, K. R. Falkenstern, C. D. Kelly, E. P. Murphy, R. L. Klinger, B. E. Kahn, A. G. DiFrancesco and R. K. Hailstone, J. Imaging Sci. Technol., 2002, 46, 101 CAS.
- P. Ephrat, K. Roodenko, L. Nagli and A. Katzir, Appl. Phys. Lett., 2004, 84, 637 CrossRef CAS PubMed.
- B. Z. Dekel and A. Katzir, Appl. Opt., 2005, 44, 3343 CrossRef CAS.
- M. Platkov, A. Tsun, L. Nagli and A. Katzir, Rev. Sci. Instrum., 2006, 77, 126103 CrossRef PubMed.
- T. Lewi, S. Shalem, A. Tsun and A. Katzir, Appl. Phys. Lett., 2007, 91, 251112 CrossRef PubMed.
- J. Luo, D. Qu, A. Tikhonov, J. Bohn and S. A. Asher, J. Colloid Interface Sci., 2010, 345, 131 CrossRef CAS PubMed.
- M. G. Han, C. G. Shin, S. J. Jeon, H. Shim, C. J. Heo, H. Jin, J. W. Kim and S. Lee, Adv. Mater., 2012, 24, 6438 CrossRef CAS PubMed.
- Y. Sun and Y. Ren, Part. Part. Syst. Charact., 2013, 30, 399 CrossRef CAS.
- S. Peng, J. S. Okasinski, J. D. Almer, Y. Ren, L. Wang, W. Yang and Y. Sun, J. Phys. Chem. C, 2012, 116, 11842 CAS.
- Z. Li, J. S. Okasinski, J. D. Almer, Y. Ren, X. Zuo and Y. Sun, Nanoscale, 2014, 6, 365 RSC.
- R. S. Eachus, A. P. Marchetti and A. A. Muenter, Annu. Rev. Phys. Chem., 1999, 50, 117 CrossRef CAS PubMed.
- Y. Sun, Y. Ren, D. R. Haeffner, J. D. Almer, L. Wang, W. Yang and T. T. Truong, Nano Lett., 2010, 10, 3747 CrossRef CAS PubMed.
- H. M. Trimble, Ind. Eng. Chem., 1931, 23, 165 CrossRef CAS.
- V. K. LaMer and R. H. Dinegar, J. Am. Chem. Soc., 1950, 72, 4847 CrossRef CAS.
- Y. Yin and A. P. Alivisatos, Nature, 2005, 437, 664 CrossRef CAS PubMed.
- Y. Xia, B. Gates, Y. Yin and Y. Lu, Adv. Mater., 2000, 12, 693 CrossRef CAS.
- A. Millo, I. Naeh, Y. Lavi and A. Katzir, Appl. Phys. Lett., 2006, 88, 3 CrossRef PubMed.
- W. J. Yoo, B. Lee, D. H. Cho, S. C. Chung, G. R. Tack, J. H. Jun and S. Cho, in 2006 Ieee Sensors, Ieee, New York, 2006, vol. 1–3, p. 631 Search PubMed.
- G. Wang, X. Xu, L. Qiu, Y. Dong, Z. Li and C. Zhang, ACS Appl. Mater. Interfaces, 2014, 6, 6434 CAS.
- B. Sagmuller, B. Schwarze, G. Brehm and S. Schneider, Analyst, 2001, 126, 2066 RSC.
Footnote |
| † Electronic supplementary information (ESI) available: Experimental details, in situ time-resolved XRD patterns, TEM image, SEM images, and particle size distribution analysis. See DOI: 10.1039/c4tc02102a |
| This journal is © The Royal Society of Chemistry 2015 |