 Open Access Article
Nanostructure of wet-chemically prepared, polymer-stabilized silver–gold nanoalloys (6 nm) over the entire composition range
S.
Ristig
a,
O.
Prymak
a,
K.
Loza
a,
M.
Gocyla
b,
W.
Meyer-Zaika
a,
M.
Heggen
b,
D.
Raabe
c and
M.
Epple
*a
aInorganic Chemistry and Center for Nanointegration Duisburg-Essen (CeNIDE), Universitaetsstr. 5-7, 45117 Essen, Germany. E-mail: matthias.epple@uni-due.de
bErnst Ruska-Center and Peter Grünberg Institute, Forschungszentrum Jülich GmbH, 52425 Jülich, Germany
cMicrostructure Physics and Alloy Design, Max-Planck-Institut für Eisenforschung, Max-Planck-Str. 1, 40237 Düsseldorf, Germany
First published on 28th April 2015
Abstract
Bimetallic silver–gold nanoparticles were prepared by co-reduction using citrate and tannic acid in aqueous solution and colloidally stabilized with poly(N-vinylpyrrolidone) (PVP). The full composition range of silver![[thin space (1/6-em)]](https://www.rsc.org/images/entities/char_2009.gif) :
:![[thin space (1/6-em)]](https://www.rsc.org/images/entities/char_2009.gif) gold from 0
gold from 0![[thin space (1/6-em)]](https://www.rsc.org/images/entities/char_2009.gif) :
:![[thin space (1/6-em)]](https://www.rsc.org/images/entities/char_2009.gif) 100 to 100
100 to 100![[thin space (1/6-em)]](https://www.rsc.org/images/entities/char_2009.gif) :
:![[thin space (1/6-em)]](https://www.rsc.org/images/entities/char_2009.gif) 0 (n
0 (n![[thin space (1/6-em)]](https://www.rsc.org/images/entities/char_2009.gif) :
:![[thin space (1/6-em)]](https://www.rsc.org/images/entities/char_2009.gif) n) was prepared with steps of 10 mol%. The nanoparticles were spherical, monodispersed, and had a diameter of ∼6 nm, except for Ag
n) was prepared with steps of 10 mol%. The nanoparticles were spherical, monodispersed, and had a diameter of ∼6 nm, except for Ag![[thin space (1/6-em)]](https://www.rsc.org/images/entities/char_2009.gif) :
:![[thin space (1/6-em)]](https://www.rsc.org/images/entities/char_2009.gif) Au 90
Au 90![[thin space (1/6-em)]](https://www.rsc.org/images/entities/char_2009.gif) :
:![[thin space (1/6-em)]](https://www.rsc.org/images/entities/char_2009.gif) 10 nanoparticles and pure Ag nanoparticles which were slightly larger. The size of the nanoalloys was determined by differential centrifugal sedimentation (DCS) and transmission electron microscopy (TEM). By means of X-ray powder diffraction (XRD) together with Rietveld refinement, precise lattice parameters, crystallite size and microstrain were determined. Scanning transmission electron microscopy (STEM) combined with energy-dispersive X-ray spectroscopy (EDX) and electron energy loss spectroscopy (EELS) showed that the particles consisted of a gold-rich core and a silver-rich shell. XRD and DCS indicated that the nanoparticles were not twinned, except for pure Ag and Ag
10 nanoparticles and pure Ag nanoparticles which were slightly larger. The size of the nanoalloys was determined by differential centrifugal sedimentation (DCS) and transmission electron microscopy (TEM). By means of X-ray powder diffraction (XRD) together with Rietveld refinement, precise lattice parameters, crystallite size and microstrain were determined. Scanning transmission electron microscopy (STEM) combined with energy-dispersive X-ray spectroscopy (EDX) and electron energy loss spectroscopy (EELS) showed that the particles consisted of a gold-rich core and a silver-rich shell. XRD and DCS indicated that the nanoparticles were not twinned, except for pure Ag and Ag![[thin space (1/6-em)]](https://www.rsc.org/images/entities/char_2009.gif) :
:![[thin space (1/6-em)]](https://www.rsc.org/images/entities/char_2009.gif) Au 90
Au 90![[thin space (1/6-em)]](https://www.rsc.org/images/entities/char_2009.gif) :
:![[thin space (1/6-em)]](https://www.rsc.org/images/entities/char_2009.gif) 10, although different domains were visible in the TEM. A remarkable negative deviation from Vegard's linear rule of alloy mixtures was observed (isotropic contraction of the cubic unit cell with a minimum at a 50
10, although different domains were visible in the TEM. A remarkable negative deviation from Vegard's linear rule of alloy mixtures was observed (isotropic contraction of the cubic unit cell with a minimum at a 50![[thin space (1/6-em)]](https://www.rsc.org/images/entities/char_2009.gif) :
:![[thin space (1/6-em)]](https://www.rsc.org/images/entities/char_2009.gif) 50 composition). This effect was also found for Ag:Au bulk alloys, but it was much more pronounced for the nanoalloys. Notably, it was much less pronounced for pure silver and gold nanoparticles. The microstrain was increased along with the contraction of the unit cell with a broad maximum at a 50
50 composition). This effect was also found for Ag:Au bulk alloys, but it was much more pronounced for the nanoalloys. Notably, it was much less pronounced for pure silver and gold nanoparticles. The microstrain was increased along with the contraction of the unit cell with a broad maximum at a 50![[thin space (1/6-em)]](https://www.rsc.org/images/entities/char_2009.gif) :
:![[thin space (1/6-em)]](https://www.rsc.org/images/entities/char_2009.gif) 50 composition. The synthesis is based on aqueous solvents and can be easily scaled up to a yield of several mg of a well dispersed nanoalloy with application potential due to its tuneable antibacterial action (silver) and its optical properties for bioimaging.
50 composition. The synthesis is based on aqueous solvents and can be easily scaled up to a yield of several mg of a well dispersed nanoalloy with application potential due to its tuneable antibacterial action (silver) and its optical properties for bioimaging.
Introduction
Metallic nanoparticles represent a well-established part of nanoscience today. Especially noble metals are important, e.g. silver, gold, and platinum.1–3 Alloyed nanoparticles open up new possibilities due to their tuneable properties, e.g. in heterogeneous catalysis, electrocatalysis,4 or imaging.5,6 Especially silver7 and gold8,9 represent the prominent metallic nanoparticles in biomedicine – silver due to its antibacterial effect and gold due to its easy functionalization, e.g. by thiol or phosphane chemistry.8,10 A combination of these metals into one nanoparticle enables the combination of these two aspects. Silver and gold nanoparticles have been proposed for biomedical imaging, including theranostics,11–14 and also as tuneable antibacterial agents.15,16 Their optical properties vary with their composition and internal nanostructure.12,17,18 Note that silver and gold represent a classical system for alloys, given their almost identical metallic radii and chemical similarity. Therefore, they constitute a model system for mixed crystals with complete miscibility.In the case of bimetallic Ag:Au nanoparticles, an important question concerns the actual distribution of the metals inside the nanoparticles, and the resulting effects on their chemical, physical and crystallographic properties. It has been recognized that a nanoparticle is not just a small homogeneous single crystal, and that standard crystallography needs to be extended to map such structural and/or compositional inhomogeneities (“the nanostructure problem”).19 This in turn will determine their chemical and biological effects, e.g. the release of silver ions for antibacterial activity20 and the presence of gold on the nanoparticle surface for a stable subsequent covalent functionalization.
X-ray diffraction is well suited to determine the crystallite size of nanoparticles,21 but additional microscopic, spectroscopic and modelling techniques need to be employed to understand the structure of nanoparticles.4,21–24 The area of nanoalloys has been extensively reviewed by Ferrando et al.25 and also with a special focus on thermodynamics by Calvo.26
The internal structure of nanoalloys strongly depends on the synthesis route and also on their surface functionalization. As a comprehensive experimental study to supplement a variety of theoretical predictions, we have prepared a complete series of monodispersed small Ag:Au nanoalloys, reduced with citrate/tannic acid and stabilized with poly(N-vinyl pyrrolidone), over the entire composition range and analysed their structure using a wide range of methods.
The synthesis is based on aqueous solvents and can be easily scaled up to a yield of several mg of nanoalloys as required for biomedical applications, e.g. as antibacterial agents or for bioimaging.
Experimental section
Synthesis
Prior to use, all glassware was cleaned with boiling aqua regia. The nanoparticles were synthesized by reduction with citrate and tannic acid in aqueous media in analogy with previously described procedures16 with slight modifications. All preparations were carried out with double-distilled water.300 mL of degassed water was heated to 100 °C. A cumulative volume of 3 mL of 10 mM solutions of HAuCl4 and AgNO3 (total metal content 30 μM), depending on the intended composition of the nanoparticles, was added. A mixture of 4.5 mL of a solution of 2 wt% trisodium citrate (77.5 mM) and 4.5 mL of a solution of 5.6 mg mL−1 tannic acid (3.3 mM) was added using a pipette under vigorous stirring. The reaction mixture was then stirred for another 10 min at 100 °C.
Further functionalization was carried out by adding 2 mL of a solution of poly(N-vinylpyrrolidone) (PVP; 30 mg mL−1) to the unpurified dispersion.27 After stirring for at least two more hours, the nanoparticles were separated from the unreacted material by ultracentrifugation (30![[thin space (1/6-em)]](https://www.rsc.org/images/entities/char_2009.gif) 000 rpm, 60
000 rpm, 60![[thin space (1/6-em)]](https://www.rsc.org/images/entities/char_2009.gif) 000g, 30 min) and redispersed in ultrapure water by vortexing. The purification step was repeated twice to remove all synthesis by-products. Prior to powder diffraction analyses and transmission electron microscopy, the samples were freeze-dried.
000g, 30 min) and redispersed in ultrapure water by vortexing. The purification step was repeated twice to remove all synthesis by-products. Prior to powder diffraction analyses and transmission electron microscopy, the samples were freeze-dried.
Analytical methods
Transmission electron microscope (TEM) images were taken using a Philips CM 200 FE instrument. The dispersions were diluted with deionized water, drop-cast onto a carbon-coated copper grid and dried under ambient conditions. Particle sizes were estimated by measuring the maximum diameter of 50 particles and accumulating the data into a histogram.Scanning transmission electron microscopy (STEM) was performed using two FEI Titan microscopes, both equipped with Cs-probe correctors (CEOS Company) and high-angle annular dark field (HAADF) detectors. They were operated at 200 and 300 kV, respectively. “Z-Contrast” conditions were achieved using a probe semi-angle of 25 mrad and an inner collection angle of the detector of 70 mrad. Electron energy loss (EEL) spectra were recorded using a Gatan image filter Tridiem 866ERS system analysing the Au M4,5 and Ag M4,5 edges. The elemental mapping using energy-dispersive X-ray spectroscopy (EDX) was conducted on a probe-corrected FEI Titan 80–200 “ChemiSTEM” electron microscope equipped with four symmetrical SDD detectors.
Differential centrifugal sedimentation (DCS) was performed using a CPS Instruments Disc Centrifuge DC 24![[thin space (1/6-em)]](https://www.rsc.org/images/entities/char_2009.gif) 000 at 24
000 at 24![[thin space (1/6-em)]](https://www.rsc.org/images/entities/char_2009.gif) 000 rpm. Two sucrose solutions (8 wt% and 24 wt%) were used for a density gradient which was supplemented with 0.5 mL of N-dodecane as a stabilizing agent. The calibration standard was a poly(vinylchloride) (PVC) latex in water with a particle size of 476 nm provided by CPS instruments. Calibration was carried out prior to each run. A sample volume of 100 μL was used for each experiment.
000 rpm. Two sucrose solutions (8 wt% and 24 wt%) were used for a density gradient which was supplemented with 0.5 mL of N-dodecane as a stabilizing agent. The calibration standard was a poly(vinylchloride) (PVC) latex in water with a particle size of 476 nm provided by CPS instruments. Calibration was carried out prior to each run. A sample volume of 100 μL was used for each experiment.
Ultraviolet-visible spectroscopy (UV-Vis) was performed on a Varian Cary 300 instrument. Suprasil® cuvettes with a sample volume of 3.5 mL were used.
Atomic absorption spectroscopy for elemental analysis (Ag, Au) was carried out on a Thermo Electron M-Series spectrometer with a graphite tube furnace according to DIN EN ISO/IEC 17025:2005 after dissolving the particles in aqua regia.
X-ray powder diffraction was carried out on a Bruker D8 Advance instrument in Bragg–Brentano mode with Cu Kα radiation (1.54 Å; 40 kV and 40 mA) using a silicon single crystal with a crystallographic (911)-plane as a sample holder to minimize scattering. For better homogenization, the dried powder samples were redispersed with ethanol on the silicon surface and then investigated in the range from 5 to 90° 2θ with a step size of 0.01° 2θ and a counting time of 0.6 s at each step. Rietveld refinement using the program package TOPAS 4.2 from Bruker was performed to determine the average crystallite size, microstrain, and the lattice parameters. The size of the crystallites was calculated using the Scherrer equation:28
with K a constant set to 0.89, λ the wavelength of the X-ray radiation, FWHM the full width at half maximum for the diffraction peaks and θ the diffraction angle.
For each Rietveld refinement, the instrumental correction as determined using a standard powder sample LaB6 obtained by NIST (National Institute of Standards and Technology) as a standard reference material (SRM 660b; a(LaB6) = 4.15689 Å) was taken into account. Each nanoparticle sample was thoroughly mixed with about the same amount of LaB6 for precise determination of the lattice parameters of the nanoparticles, including an exact determination of the sample displacement. The patterns of elemental silver (#4-0783) and gold (#4-0784) as listed in the ICDD database were used as references. As reference materials, we also studied microcrystalline powders of pure silver and gold, respectively (Fluka). The silver powder was annealed for 3 h at 700 °C to ensure microcrystallinity and the absence of microstrain; the gold powder was measured as obtained. All powder diffraction data were recorded at ambient temperature (25 ± 2 °C) to exclude a variable thermal expansion.
Results and discussion
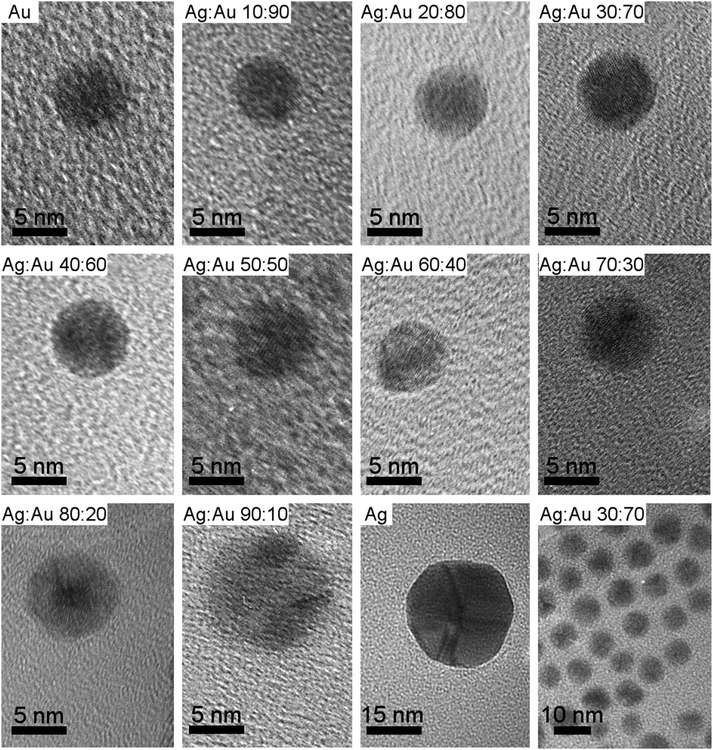
The composition of the nanoalloys was determined by atomic absorption spectroscopy (Table 1). It followed the compositions used in the synthesis. Transmission electron microscopy (TEM) showed spherical particles of almost identical diameter with an average size of 6 to 8 nm (Fig. 1). The particle size was determined manually by measuring the size of 50 nanoparticles and compiling a histogram. Only at a very high silver content of ∼90 mol% and for pure silver, the particles became significantly larger with a mean size of 12 nm and 34 nm respectively. In these cases, i.e. for particle sizes above 11 nm and a silver content at or above 90 mol%, we clearly observed twinning by TEM (Fig. 1). In the case of pure silver, about five domains were clearly identified, whereas for the 90![[thin space (1/6-em)]](https://www.rsc.org/images/entities/char_2009.gif) :
:![[thin space (1/6-em)]](https://www.rsc.org/images/entities/char_2009.gif) 10 nanoparticles, the exact number of domains could not be determined due to the small particle size. The crystallographic orientations of the domains were not determined, therefore, no further conclusions are possible on the order of twinning.
10 nanoparticles, the exact number of domains could not be determined due to the small particle size. The crystallographic orientations of the domains were not determined, therefore, no further conclusions are possible on the order of twinning.
Targeted nominal composition Ag:Au, according to synthesis/mol%![[thin space (1/6-em)]](https://www.rsc.org/images/entities/char_2009.gif) : :![[thin space (1/6-em)]](https://www.rsc.org/images/entities/char_2009.gif) mol% mol% |
Ag/mol% (AAS) | Au/mol% (AAS) |
|---|---|---|
0![[thin space (1/6-em)]](https://www.rsc.org/images/entities/char_2009.gif) : :![[thin space (1/6-em)]](https://www.rsc.org/images/entities/char_2009.gif) 100 100 |
0 | 100 |
10![[thin space (1/6-em)]](https://www.rsc.org/images/entities/char_2009.gif) : :![[thin space (1/6-em)]](https://www.rsc.org/images/entities/char_2009.gif) 90 90 |
8 | 92 |
20![[thin space (1/6-em)]](https://www.rsc.org/images/entities/char_2009.gif) : :![[thin space (1/6-em)]](https://www.rsc.org/images/entities/char_2009.gif) 80 80 |
19 | 80 |
30![[thin space (1/6-em)]](https://www.rsc.org/images/entities/char_2009.gif) : :![[thin space (1/6-em)]](https://www.rsc.org/images/entities/char_2009.gif) 70 70 |
26 | 74 |
40![[thin space (1/6-em)]](https://www.rsc.org/images/entities/char_2009.gif) : :![[thin space (1/6-em)]](https://www.rsc.org/images/entities/char_2009.gif) 60 60 |
37 | 63 |
50![[thin space (1/6-em)]](https://www.rsc.org/images/entities/char_2009.gif) : :![[thin space (1/6-em)]](https://www.rsc.org/images/entities/char_2009.gif) 50 50 |
48 | 52 |
60![[thin space (1/6-em)]](https://www.rsc.org/images/entities/char_2009.gif) : :![[thin space (1/6-em)]](https://www.rsc.org/images/entities/char_2009.gif) 40 40 |
57 | 43 |
70![[thin space (1/6-em)]](https://www.rsc.org/images/entities/char_2009.gif) : :![[thin space (1/6-em)]](https://www.rsc.org/images/entities/char_2009.gif) 30 30 |
66 | 34 |
80![[thin space (1/6-em)]](https://www.rsc.org/images/entities/char_2009.gif) : :![[thin space (1/6-em)]](https://www.rsc.org/images/entities/char_2009.gif) 20 20 |
80 | 20 |
90![[thin space (1/6-em)]](https://www.rsc.org/images/entities/char_2009.gif) : :![[thin space (1/6-em)]](https://www.rsc.org/images/entities/char_2009.gif) 10 10 |
89 | 11 |
100![[thin space (1/6-em)]](https://www.rsc.org/images/entities/char_2009.gif) : :![[thin space (1/6-em)]](https://www.rsc.org/images/entities/char_2009.gif) 0 0 |
100 | 0 |
Differential centrifugal sedimentation gave the average hydrodynamic diameter of the water-dispersed particles which represents the size of the solid nanoparticle core and the hydrated layer of the PVP. The results are in good agreement with the diameter as determined by TEM, confirming that the particles are well dispersed in water and not agglomerated (Table 2).
Ag![[thin space (1/6-em)]](https://www.rsc.org/images/entities/char_2009.gif) : :![[thin space (1/6-em)]](https://www.rsc.org/images/entities/char_2009.gif) Au (n Au (n![[thin space (1/6-em)]](https://www.rsc.org/images/entities/char_2009.gif) : :![[thin space (1/6-em)]](https://www.rsc.org/images/entities/char_2009.gif) n, nominal composition) n, nominal composition) |
D (TEM)/nm | D (DCS)/nm | Crystallite size (XRD)/nm |
|---|---|---|---|
0![[thin space (1/6-em)]](https://www.rsc.org/images/entities/char_2009.gif) : :![[thin space (1/6-em)]](https://www.rsc.org/images/entities/char_2009.gif) 100 100 |
6.0 ± 0.7 | 4.8 | 4.7 ± 0.1 |
10![[thin space (1/6-em)]](https://www.rsc.org/images/entities/char_2009.gif) : :![[thin space (1/6-em)]](https://www.rsc.org/images/entities/char_2009.gif) 90 90 |
6.5 ± 1.1 | 5.5 | 8.3 ± 0.3 |
20![[thin space (1/6-em)]](https://www.rsc.org/images/entities/char_2009.gif) : :![[thin space (1/6-em)]](https://www.rsc.org/images/entities/char_2009.gif) 80 80 |
6.9 ± 1.0 | 5.4 | 8.9 ± 0.9 |
30![[thin space (1/6-em)]](https://www.rsc.org/images/entities/char_2009.gif) : :![[thin space (1/6-em)]](https://www.rsc.org/images/entities/char_2009.gif) 70 70 |
7.1 ± 1.0 | 5.5 | 9.2 ± 0.6 |
40![[thin space (1/6-em)]](https://www.rsc.org/images/entities/char_2009.gif) : :![[thin space (1/6-em)]](https://www.rsc.org/images/entities/char_2009.gif) 60 60 |
7.0 ± 0.5 | 5.6 | 8.3 ± 0.6 |
50![[thin space (1/6-em)]](https://www.rsc.org/images/entities/char_2009.gif) : :![[thin space (1/6-em)]](https://www.rsc.org/images/entities/char_2009.gif) 50 50 |
6.9 ± 0.7 | 5.7 | 6.9 ± 0.6 |
60![[thin space (1/6-em)]](https://www.rsc.org/images/entities/char_2009.gif) : :![[thin space (1/6-em)]](https://www.rsc.org/images/entities/char_2009.gif) 40 40 |
6.9 ± 0.7 | 5.5 | 8.5 ± 0.7 |
70![[thin space (1/6-em)]](https://www.rsc.org/images/entities/char_2009.gif) : :![[thin space (1/6-em)]](https://www.rsc.org/images/entities/char_2009.gif) 30 30 |
7.1 ± 0.9 | 5.3 | 6.6 ± 0.3 |
80![[thin space (1/6-em)]](https://www.rsc.org/images/entities/char_2009.gif) : :![[thin space (1/6-em)]](https://www.rsc.org/images/entities/char_2009.gif) 20 20 |
8.5 ± 1.0 | 6.8 | 8.5 ± 0.4 |
90![[thin space (1/6-em)]](https://www.rsc.org/images/entities/char_2009.gif) : :![[thin space (1/6-em)]](https://www.rsc.org/images/entities/char_2009.gif) 10 10 |
11.5 ± 0.7 | 8.1 | 8.2 ± 0.2 |
100![[thin space (1/6-em)]](https://www.rsc.org/images/entities/char_2009.gif) : :![[thin space (1/6-em)]](https://www.rsc.org/images/entities/char_2009.gif) 0 0 |
33.6 ± 5.7 | 29.4 | 14.0 ± 0.2 |
By X-ray powder diffraction, extended by Rietveld refinement, the average crystallite size of the particles was obtained (Table 2 and Fig. 2). Note that XRD gives the crystallite size, i.e. the average diameter of the coherently scattering domains, which is not necessarily identical with the domain size that is visible in the TEM.21 Starting from pure gold, the crystallite size is almost constant and in good agreement with the particle size obtained from TEM and DCS, respectively. This observation indicates that each particle consists of only one crystallite, i.e. is an individual single crystal. The obvious increase in size of Ag![[thin space (1/6-em)]](https://www.rsc.org/images/entities/char_2009.gif) :
:![[thin space (1/6-em)]](https://www.rsc.org/images/entities/char_2009.gif) Au 90
Au 90![[thin space (1/6-em)]](https://www.rsc.org/images/entities/char_2009.gif) :
:![[thin space (1/6-em)]](https://www.rsc.org/images/entities/char_2009.gif) 10 and pure silver nanoparticles then results from a change in the nucleation and growth mechanism at high silver concentrations. Twinning appears to start at 90 mol% silver, with one particle containing more than one crystallite. For pure silver, it is noteworthy that the particle size increases faster than the crystallite size, underscoring the results of TEM. However, high resolution STEM images also indicate some twinning at a lower silver content (see below).
10 and pure silver nanoparticles then results from a change in the nucleation and growth mechanism at high silver concentrations. Twinning appears to start at 90 mol% silver, with one particle containing more than one crystallite. For pure silver, it is noteworthy that the particle size increases faster than the crystallite size, underscoring the results of TEM. However, high resolution STEM images also indicate some twinning at a lower silver content (see below).
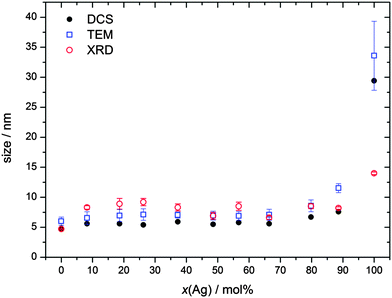 | ||
| Fig. 2 Average particle size obtained from disc centrifugal sedimentation (DCS; hydrodynamic diameter), transmission electron microscopy (TEM; metallic core), and X-ray powder diffraction (XRD; crystallite size) against the silver content from elemental analysis (AAS) (Table 1). | ||
The fact that the hydrodynamic diameter is almost the same as the diameter of the metallic core confirms the dispersed state of the nanoparticles when immersed in water. Note that the hydrodynamic diameter as determined by DCS is systematically underestimated because of the hydration shell.21,30 The fact that the crystallite size determined by XRD is the same as the one observed by TEM or DCS shows that the particles are not twinned up to about 80 mol% Ag, at least based on the results of X-ray powder diffraction. At very high silver content, the crystallite size is smaller than the particle diameter, indicating twinning.
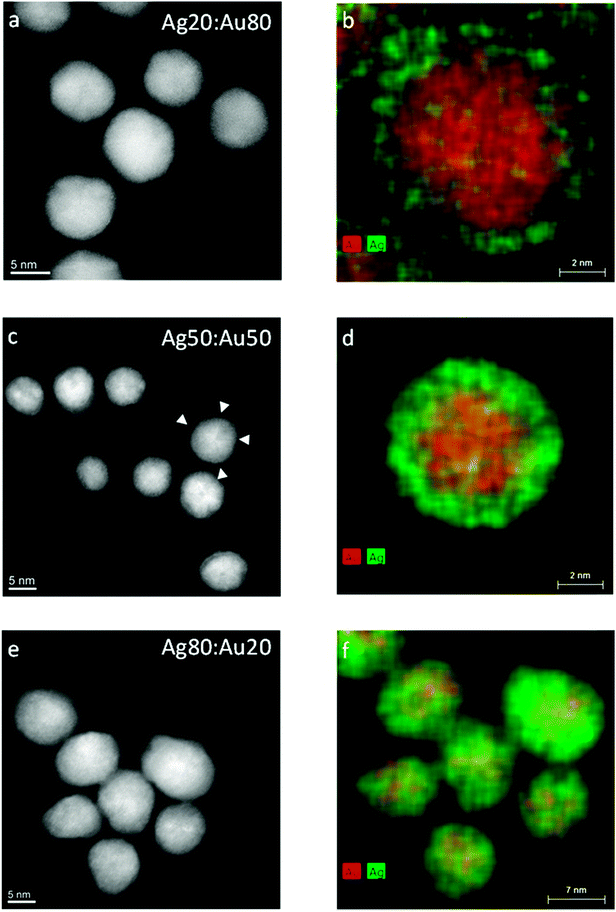
Fig. 3 shows high-resolution HAADF-STEM images of Au–Ag nanoalloys at various compositions and the corresponding EDX maps. Some of the HAADF-STEM images show the atomic lattice of nanoparticles oriented along low indexed lattice orientations with respect to the electron beam and indicate the presence of twin boundaries (e.g. arrowhead in Fig. 3c). Individual particles showing twin boundaries were observed at all compositions. The EDX spectrum maps at Ag![[thin space (1/6-em)]](https://www.rsc.org/images/entities/char_2009.gif) :
:![[thin space (1/6-em)]](https://www.rsc.org/images/entities/char_2009.gif) Au 20
Au 20![[thin space (1/6-em)]](https://www.rsc.org/images/entities/char_2009.gif) :
:![[thin space (1/6-em)]](https://www.rsc.org/images/entities/char_2009.gif) 80 and 50
80 and 50![[thin space (1/6-em)]](https://www.rsc.org/images/entities/char_2009.gif) :
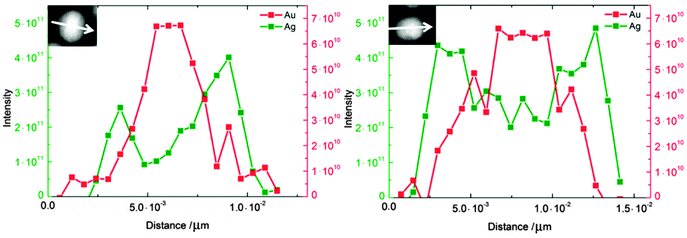
:![[thin space (1/6-em)]](https://www.rsc.org/images/entities/char_2009.gif) 50 show pronounced Au and Ag enrichment in the centre and in the shell of the nanoparticle, respectively (Fig. 3b and d). The EEL spectrum profiles were taken across the nanoparticles (Fig. 4) and show the presence of one strong Au signal around the centre and two pronounced Ag signals at the outermost parts of the particles. The EEL spectrum profiles and the EDX maps clearly demonstrate the presence of a core–shell structure with an Au-rich core and an Ag-rich shell (Fig. 4). Cores and shells are differently pronounced at different compositions of the nanoparticles. According to EDX mapping, the chemical composition is in good agreement with the AAS data (Table 2): Ag
50 show pronounced Au and Ag enrichment in the centre and in the shell of the nanoparticle, respectively (Fig. 3b and d). The EEL spectrum profiles were taken across the nanoparticles (Fig. 4) and show the presence of one strong Au signal around the centre and two pronounced Ag signals at the outermost parts of the particles. The EEL spectrum profiles and the EDX maps clearly demonstrate the presence of a core–shell structure with an Au-rich core and an Ag-rich shell (Fig. 4). Cores and shells are differently pronounced at different compositions of the nanoparticles. According to EDX mapping, the chemical composition is in good agreement with the AAS data (Table 2): Ag![[thin space (1/6-em)]](https://www.rsc.org/images/entities/char_2009.gif) :
:![[thin space (1/6-em)]](https://www.rsc.org/images/entities/char_2009.gif) Au nominal 20
Au nominal 20![[thin space (1/6-em)]](https://www.rsc.org/images/entities/char_2009.gif) :
:![[thin space (1/6-em)]](https://www.rsc.org/images/entities/char_2009.gif) 80, found 19
80, found 19![[thin space (1/6-em)]](https://www.rsc.org/images/entities/char_2009.gif) :
:![[thin space (1/6-em)]](https://www.rsc.org/images/entities/char_2009.gif) 81 (Fig. 3b); Ag
81 (Fig. 3b); Ag![[thin space (1/6-em)]](https://www.rsc.org/images/entities/char_2009.gif) :
:![[thin space (1/6-em)]](https://www.rsc.org/images/entities/char_2009.gif) Au nominal 50
Au nominal 50![[thin space (1/6-em)]](https://www.rsc.org/images/entities/char_2009.gif) :
:![[thin space (1/6-em)]](https://www.rsc.org/images/entities/char_2009.gif) 50, found 58
50, found 58![[thin space (1/6-em)]](https://www.rsc.org/images/entities/char_2009.gif) :
:![[thin space (1/6-em)]](https://www.rsc.org/images/entities/char_2009.gif) 42 (Fig. 3d); and Ag
42 (Fig. 3d); and Ag![[thin space (1/6-em)]](https://www.rsc.org/images/entities/char_2009.gif) :
:![[thin space (1/6-em)]](https://www.rsc.org/images/entities/char_2009.gif) Au nominal 80
Au nominal 80![[thin space (1/6-em)]](https://www.rsc.org/images/entities/char_2009.gif) :
:![[thin space (1/6-em)]](https://www.rsc.org/images/entities/char_2009.gif) 20, found 87
20, found 87![[thin space (1/6-em)]](https://www.rsc.org/images/entities/char_2009.gif) :
:![[thin space (1/6-em)]](https://www.rsc.org/images/entities/char_2009.gif) 13 (Fig. 3f).
13 (Fig. 3f).
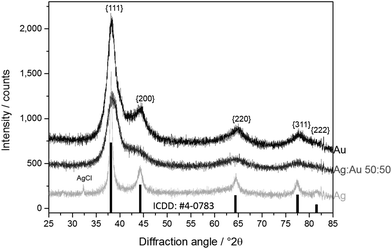
High-precision X-ray diffraction gave the crystallite size and microstrain after Rietveld refinement of peak broadening (Fig. 5 and 6).
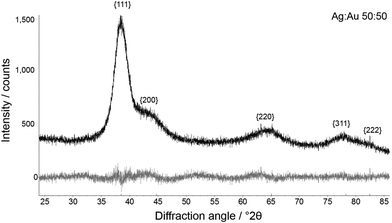 | ||
Fig. 6 Representative Rietveld refinement of Ag![[thin space (1/6-em)]](https://www.rsc.org/images/entities/char_2009.gif) : :![[thin space (1/6-em)]](https://www.rsc.org/images/entities/char_2009.gif) Au 50 Au 50![[thin space (1/6-em)]](https://www.rsc.org/images/entities/char_2009.gif) : :![[thin space (1/6-em)]](https://www.rsc.org/images/entities/char_2009.gif) 50 nanoalloys. Top: experimental curve; bottom: difference plot. 50 nanoalloys. Top: experimental curve; bottom: difference plot. | ||
Additional X-ray measurements were carried out after the addition of LaB6 as an internal standard. This allowed the determination of the lattice parameters of the alloyed Ag:Au with very high precision (Fig. 7; see ref. 21 for a diffractogram of a sample of silver nanoparticles, mixed with LaB6). In the face-centred cubic lattice, there is only the cubic lattice parameter that needs to be determined.
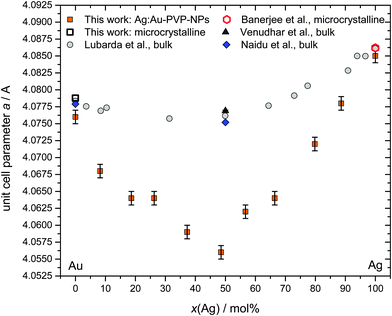 | ||
Fig. 7 Lattice parameter as a function of composition for Ag:Au nanoalloys, including own data and literature data obtained from bulk materials (Lubarda et al., bulk AgAu alloys in 11 compositions and the pure metals;34 Venudhar et al., bulk Ag![[thin space (1/6-em)]](https://www.rsc.org/images/entities/char_2009.gif) : :![[thin space (1/6-em)]](https://www.rsc.org/images/entities/char_2009.gif) Au 50 Au 50![[thin space (1/6-em)]](https://www.rsc.org/images/entities/char_2009.gif) : :![[thin space (1/6-em)]](https://www.rsc.org/images/entities/char_2009.gif) 50 alloys;35 Naidu et al., bulk Ag 50 alloys;35 Naidu et al., bulk Ag![[thin space (1/6-em)]](https://www.rsc.org/images/entities/char_2009.gif) : :![[thin space (1/6-em)]](https://www.rsc.org/images/entities/char_2009.gif) Au 50 Au 50![[thin space (1/6-em)]](https://www.rsc.org/images/entities/char_2009.gif) : :![[thin space (1/6-em)]](https://www.rsc.org/images/entities/char_2009.gif) 50 alloys;36 microcrystalline silver;21 microcrystalline gold, this work). 50 alloys;36 microcrystalline silver;21 microcrystalline gold, this work). | ||
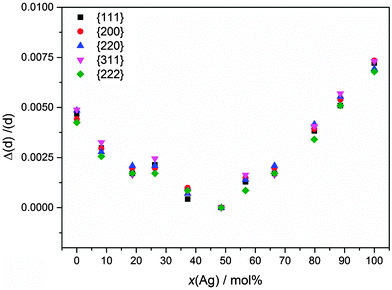
Surprisingly, we found distinct negative deviations from Vegard's linear rule for the lattice parameter a (face-centred cubic crystal system). For Ag![[thin space (1/6-em)]](https://www.rsc.org/images/entities/char_2009.gif) :
:![[thin space (1/6-em)]](https://www.rsc.org/images/entities/char_2009.gif) Au 50
Au 50![[thin space (1/6-em)]](https://www.rsc.org/images/entities/char_2009.gif) :
:![[thin space (1/6-em)]](https://www.rsc.org/images/entities/char_2009.gif) 50 nanoalloys, the difference was the largest (−0.024 Å). In general, the negative deviations were much larger than comparable deviations that were found for the corresponding AuAg bulk alloys (maximum −0.005 Å for Ag
50 nanoalloys, the difference was the largest (−0.024 Å). In general, the negative deviations were much larger than comparable deviations that were found for the corresponding AuAg bulk alloys (maximum −0.005 Å for Ag![[thin space (1/6-em)]](https://www.rsc.org/images/entities/char_2009.gif) :
:![[thin space (1/6-em)]](https://www.rsc.org/images/entities/char_2009.gif) Au 50
Au 50![[thin space (1/6-em)]](https://www.rsc.org/images/entities/char_2009.gif) :
:![[thin space (1/6-em)]](https://www.rsc.org/images/entities/char_2009.gif) 50). This negative deviation cannot be ascribed to the nanoscopic size itself because nanocrystalline silver and gold did not show this effect, i.e. their lattice constants were the same as those of the pure microcrystalline metals (Fig. 7). This effect is clearly present in all Ag:Au alloys, but much more pronounced in the nanostate.
50). This negative deviation cannot be ascribed to the nanoscopic size itself because nanocrystalline silver and gold did not show this effect, i.e. their lattice constants were the same as those of the pure microcrystalline metals (Fig. 7). This effect is clearly present in all Ag:Au alloys, but much more pronounced in the nanostate.
Deviations from Vegard's rule were also reported for PtCo nanoalloys,31 PtNi nanoalloys,32 AuCu nanoalloys,33 and AgAu nanoalloys.33 Notably, in the latter case, the as-prepared nanoparticles followed Vegard's rule, but after annealing them at 240/400 °C, a negative deviation was found.33 This observation points to a metastable crystalline state directly after synthesis and the possible presence of internal stress and strain which are relaxed during annealing, leading to a more stable state. This relaxed phase state seems to be characterized by a contracted lattice parameter in comparison to a linear atomic mixture of the individual atoms.
This lattice contraction is isotropic, as a closer analysis of the individual diffraction peaks clearly shows (Fig. 8).
This lattice contraction is reflected by a corresponding microstrain inside the nanoparticles (Fig. 9).
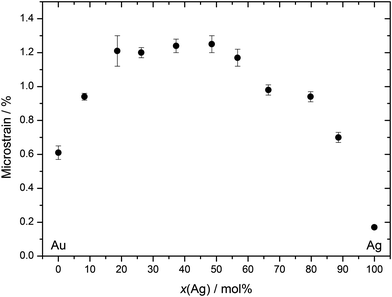 | ||
| Fig. 9 Microstrain inside the Ag:Au nanoalloys as obtained by X-ray diffraction as a function of composition. | ||
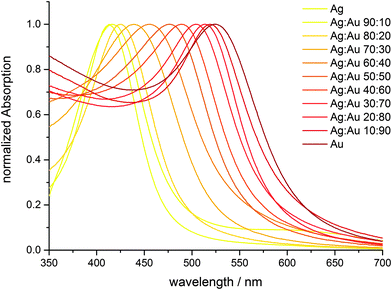
UV-Vis spectroscopy shows that the particles indeed consist of alloyed Ag:Au nanoparticles and are not of a core–shell nature with a sharp border between the gold-rich core and the silver-rich shell (Fig. 8). There is a continuous change in the UV-Vis absorption maximum as a function of the Ag:Au ratio (Fig. 10 and 11), underscoring the alloy character with a gradual radial change in the composition. A core–shell nanoparticle with a sharp change in composition would show two distinct plasmon resonance bands.18,37–40
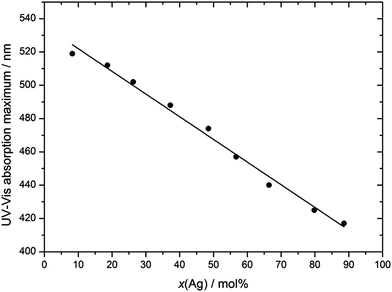 | ||
| Fig. 11 Maximum of the UV-Vis absorption curve (surface plasmon resonance) as a function of particle composition. | ||
Core–shell structures in bimetallic nanoparticles were also found by high resolution transmission electron microscopy, together with element-sensitive techniques like EDX or EELS, e.g., for AgCo nanoalloys (Ag core, Co shell),41 FePt nanoalloys (Fe-rich core, Pt-rich shell),40,42 CoPt nanoalloys (Co core, Pt shell),32 PtNi nanoalloys (Pt core, Ni shell),32 and PdPt nanoalloys (Pd core, Pt shell).21 For Ag:Au nanoalloys, different results were reported. Particles from co-reduction of Ag+ and AuCl4− showed a gold-rich core, as found here.16 In a similar process after annealing at 240/400 °C, a random AgAu alloy was formed.23 Pulsed laser ablation from bulk alloys also led to nanoalloys with a random and uniform distribution of silver and gold.17,43 In the case of a gold seed-induced silver reduction, core (Au)–shell (Ag) nanoalloys were prepared. However, after heating to 930 °C, single-crystalline and homogeneous AgAu nanoalloys were obtained.12 Note that this may not only point to some lattice relaxation but also just represent the equilibrium structure at 930 °C which was frozen during cooling. Similar results were reported by Shore et al. for gold core–silver shell nanoparticles18 and Wang et al. for silver core–gold shell nanoparticles.40 In both cases, core–shell nanoalloys were prepared by reduction in non-aqueous solvents, followed by heating for several hours at 250 and 100 °C, respectively. After heating, homogeneous nanoalloys were formed as derived from UV spectroscopy.18,40 By sequential plasma vapour deposition and subsequent thermal treatment, polycrystalline core (Au)–shell (Ag) nanoparticles were obtained.44
The occurrence of a gold-rich core and a silver-rich shell in the nanoparticles from co-reduction of silver and gold salts indicates a faster reduction of gold due to its more noble character. Silver is reduced later because it is less noble on the surface of a gold core. However, the fact that we did not observe a sharp separation of a gold core and a silver shell but rather a smooth gradient indicates that the reduction of silver and gold is occurring simultaneously, but simply at different rates. The fact that gold and silver form a continuous row of mixed crystals certainly contributes to the formation of this smooth gradient structure. However, this leads to internal stress and a hitherto unknown lattice contraction in the case of alloys.
Theoretical studies have been widely employed to understand and predict the internal structure of nanoalloys. The reason for the deviation in bulk alloys is the fact that the effect of the surface energy cannot be neglected on the nanoscale, and that therefore the structure may deviate from the bulk phase.19,25,26,45 Rossi, Curley et al. found by genetic algorithm simulations that gold tends to enrich the surface of a 34-atom AgAu cluster.46,47 Cerbelaud et al. applied an atomistic DFT model to AgAu clusters with 34 to 201 atoms and derived a number of ordered structures.48 Miotto et al. have shown by DFT calculations in the gas phase for clusters up to 961 atoms that in the case of a bimetallic gold–silver nanoparticle, a silver core is more favourable than a gold core.49
Typically these computations were performed on naked nanoalloys or clusters, i.e. the effect of the ligand shell was not taken into account. This will of course influence the surface energy. Furthermore, modelling techniques typically yield equilibrium structures at a given set of parameters (temperature, pressure) and do not take into account kinetic effects during the synthesis (like nucleation). Nanoparticles also show a distinct reactivity and capacity for internal restructuring due to their small size.50
These differences underscore that the internal order of a bimetallic nanoparticle depends on the synthesis route (e.g. wet-chemical synthesis vs. laser ablation or seeded growth routes) and can also be changed by post-synthetic thermal treatment. This points to the mobility of the atoms in the nanocrystalline lattice in the case of a gold–silver alloy.
Conclusions
Silver and gold form a full row of mixed crystals, both in the bulk as well as in the nanoscopic state. The preparation of a row of Ag:Au nanoparticles (diameter about 6 nm) over the full concentration range showed that the particles consisted of a single crystal domain but with a clear gradient in composition. The core of the nanoparticles was enriched in gold whereas silver was enriched in the shell. This indicates that the crystallographic single-domain particles actually exhibit a gradient in the composition. Notably, the negative deviation from Vegard's rule which is also known for macroscopic (microcrystalline) silver–gold alloys is much stronger in the nanoparticles. We conclude that the internal structure of bimetallic silver–gold nanoalloys is determined by the preparation route and also different from the corresponding silver–gold bulk alloy.As the optical (absorption by plasmon resonance) and biological properties (e.g. the antibacterial action by the release of silver) strongly depend on the nanostructure, these results open a way to better understand the nature and action of custom-made silver–gold nanoalloys.
Acknowledgements
M.E. thanks the Deutsche Forschungsgemeinschaft (DFG) for support within the Priority Program SPP 1313 BioNanoResponses. M.H. gratefully acknowledges financial support from the Deutsche Forschungsgemeinschaft (DFG) through the grant HE 7192/1-1. We are grateful to Karsten Albe (Darmstadt) for helpful discussions.References
- T. L. Doane and C. Burda, Chem. Soc. Rev., 2012, 41, 2885–2911 RSC.
- H. Goesmann and C. Feldmann, Angew. Chem., Int. Ed., 2010, 49, 1362–1395 CrossRef CAS PubMed.
- D. A. Giljohann, D. S. Seferos, W. L. Daniel, M. D. Massich, P. C. Patel and C. A. Mirkin, Angew. Chem., Int. Ed., 2010, 49, 3280–3294 CrossRef CAS PubMed.
- C. Cui, L. Gan, M. Heggen, S. Rudi and P. Strasser, Nat. Mater., 2013, 12, 765–771 CrossRef CAS PubMed.
- Z. Luo, K. Zheng and J. Xie, Chem. Commun., 2014, 50, 5143–5155 RSC.
- L. Shang and G. U. Nienhaus, Mater. Today, 2013, 16, 58–66 CrossRef CAS PubMed.
- S. Chernousova and M. Epple, Angew. Chem., Int. Ed., 2013, 52, 1636–1653 CrossRef CAS PubMed.
- M. Homberger and U. Simon, Philos. Trans. R. Soc., A, 2010, 368, 1405–1453 Search PubMed.
- E. C. Dreaden, A. M. Alkilany, X. Huang, C. J. Murphy and M. A. El-Sayed, Chem. Soc. Rev., 2012, 41, 2740–2779 RSC.
- A. Leifert, Y. Pan-Bartnek, U. Simon and W. Jahnen-Dechent, Nanoscale, 2013, 5, 6224–6242 RSC.
- O. Prymak, S. Ristig, V. Meyer-Zaika, A. Rostek, L. Ruiz, J. M. Gonzalez-Calbet, M. Vallet-Regi and M. Epple, Russ. Phys. J., 2014, 56, 1111–1115 CrossRef CAS.
- C. B. Gao, Y. X. Hu, M. S. Wang, M. F. Chi and Y. D. Yin, J. Am. Chem. Soc., 2014, 136, 7474–7479 CrossRef CAS PubMed.
- T. Y. Zhou, L. P. Lin, M. C. Rong, Y. Q. Jiang and X. Chen, Anal. Chem., 2013, 85, 9839–9844 Search PubMed.
- M. Ganguly, A. Pal, Y. Negishi and T. Pal, Langmuir, 2013, 29, 2033–2043 Search PubMed.
- S. Grade, J. Eberhard, J. Jakobi, A. Winkel, M. Stiesch and S. Barcikowski, Gold Bull., 2014, 47, 83–93 CrossRef CAS PubMed.
- D. Mahl, J. Diendorf, S. Ristig, C. Greulich, Z. A. Li, M. Farle, M. Koeller and M. Epple, J. Nanopart. Res., 2012, 14, 1153 CrossRef.
- A. Neumeister, J. Jakobi, C. Rehbock, J. Moysig and S. Barcikowski, Phys. Chem. Chem. Phys., 2014, 16, 23671–23678 RSC.
- M. S. Shore, J. Wang, A. C. Johnston-Peck, A. L. Oldenburg and J. B. Tracy, Small, 2011, 7, 230–234 CrossRef CAS PubMed.
- S. J. L. Billinge and I. Levin, Science, 2007, 316, 561–565 CrossRef CAS PubMed.
- S. Ristig, S. Chernousova, W. Meyer-Zaika and M. Epple, Beilstein J. Nanotechnol., 2015 Search PubMed , accepted.
- S. Banerjee, K. Loza, W. Meyer-Zaika, O. Prymak and M. Epple, Chem. Mater., 2014, 26, 951–957 CrossRef CAS.
- C. Antoniak, Beilstein J. Nanotechnol., 2011, 2, 237–251 CrossRef CAS PubMed.
- V. Petkov, B. Prasai, Y. Ren, S. Y. Shan, J. Luo, P. Joseph and C. J. Zhong, Nanoscale, 2014, 6, 10048–10061 RSC.
- M. Müller and K. Albe, Beilstein J. Nanotechnol., 2011, 2, 40–46 CrossRef PubMed.
- R. Ferrando, J. Jellinek and R. L. Johnston, Chem. Rev., 2008, 108, 845–910 CrossRef CAS PubMed.
- F. Calvo, Phys. Chem. Chem. Phys., 2015 10.1039/c5cp00274e.
- A. Rostek, D. Mahl and M. Epple, J. Nanopart. Res., 2011, 13, 4809–4814 CrossRef CAS.
- P. Scherrer, Nachr. Ges. Wiss. Göttingen, 1918, 2, 98 Search PubMed.
- A. R. Stokes and A. J. C. Wilson, Proc. Phys. Soc., London, 1944, 56, 174–181 CrossRef CAS.
- D. Mahl, J. Diendorf, W. Meyer-Zaika and M. Epple, Colloids Surf., A, 2011, 377, 386–392 CrossRef CAS PubMed.
- M. Lucariello, N. Penazzi, E. Arca, G. Mulas and S. Enzo, Mater. Chem. Phys., 2009, 114, 227–234 CrossRef CAS PubMed.
- L. Gan, M. Heggen, S. Rudi and P. Strasser, Nano Lett., 2012, 12, 5423–5430 CrossRef CAS PubMed.
- V. Petkov, S. Shastri, S. Shan, P. Joseph, J. Luo, C. J. Zhong, T. Nakamura, Y. Herbani and S. Sato, J. Phys. Chem. C, 2013, 117, 22131–22141 CAS.
- V. A. Lubarda, Mech. Mater., 2003, 35, 53–68 CrossRef.
- Y. C. Venudhar, L. YIyengar and K. K. V. Rao, J. Less-Common Met., 1978, 60, P41–P46 CrossRef CAS.
- S. V. N. Naidu and C. R. Houska, J. Appl. Phys., 1971, 42, 4971–4975 CrossRef PubMed.
- M. P. Mallin and C. J. Murphy, Nano Lett., 2002, 2, 1235–1237 CrossRef CAS.
- P. Raveendran, J. Fu and S. L. Wallen, Green Chem., 2006, 8, 34 RSC.
- I. Srnová-Šloufová, B. Vlčková, Z. Bastl and T. L. Hasslett, Langmuir, 2004, 20, 3407–3415 CrossRef.
- C. Wang, S. Peng, R. Chan and S. Sun, Small, 2009, 5, 567–570 CrossRef CAS PubMed.
- N. S. Sobal, M. Hilgendorff, H. Möhwald, M. Giersig, M. Spasova, T. Radetic and M. Farle, Nano Lett., 2002, 2, 621–624 CrossRef CAS.
- M. C. Y. Chan, L. Chen, F. H. Nan, J. F. Britten, C. Bock and G. A. Botton, Nanoscale, 2012, 4, 7273–7279 RSC.
- U. Taylor, D. Tiedemann, C. Rehbock, W. A. Kues, S. Barcikowski and D. Rath, Beilstein J. Nanotechnol., 2015, 6, 651–664 CrossRef CAS PubMed.
- S. Peglow, M. M. Pohl, A. Kruth and V. Bruser, J. Phys. Chem. C, 2015, 119, 563–572 CAS.
- F. Baletto and R. Ferrando, Rev. Mod. Phys., 2005, 77, 371 CrossRef CAS.
- G. Rossi, R. Ferrando, A. Rapallo, A. Fortunelli, B. C. Curley, L. D. Lloyd and R. L. Johnston, J. Chem. Phys., 2005, 122, 194309 CrossRef PubMed.
- B. C. Curley, G. Rossi, R. Ferrando and R. L. Johnston, Eur. Phys. J. D, 2007, 43, 53–56 CrossRef CAS.
- M. Cerbelaud, R. Ferrando, G. Barcaro and A. Fortunelli, Phys. Chem. Chem. Phys., 2011, 13, 10232–10240 RSC.
- R. Miotto, L. H. Santos, F. D. Kiss and A. C. Ferraz, ICQNM 2014: The Eighth International Conference on Quantum, Nano/Bio, and Micro Technologies, Lisbon, 2014.
- B. D. Anderson and J. B. Tracy, Nanoscale, 2014, 6, 12195–12216 RSC.
| This journal is © The Royal Society of Chemistry 2015 |


