 Open Access Article
A size dependent evaluation of the cytotoxicity and uptake of nanographene oxide†
Rafael Gregorio
Mendes
a,
Britta
Koch
a,
Alicja
Bachmatiuk
abcd,
Xing
Ma
e,
Samuel
Sanchez
efg,
Christine
Damm
a,
Oliver G.
Schmidt
ah,
Thomas
Gemming
a,
Jürgen
Eckert
aij and
Mark H.
Rümmeli
*bd
aInstitute for Solid State and Materials Research Dresden, Helmholtzstr. 20, 01069, Dresden, Germany. E-mail: m.ruemmeli@ifw-dresden.de
bIBS Center for Integrated Nanostructure Physics, Institute for Basic Science (IBS), Daejon 305-701, Republic of Korea
cCentre of Polymer and Carbon Materials, Polish Academy of Sciences, M. Curie-Sklodowskiej 34, Zabrze 41-819, Poland
dDepartment of Energy Science, Department of Physics, Sungkyunkwan University, Suwon 440-746, Republic of Korea
eMax Planck Institute for Intelligent Systems, Heisenbergstr. 3, Dresden, 70569, Stuttgart, Germany
fInstitució Catalana de Recerca i Estudis Avancats (ICREA), Pg. Lluís Companys 23, 08010, Barcelona, Spain
gInstitut de Bioenginyeria de Catalunya (IBEC), Baldiri Reixac 10-12, 08028, Barcelona, Spain
hMaterial Systems for Nanoelectronics, Chemnitz University of Technology, Reichenhainer Str. 70, 09107 Chemnitz, Germany
iInstitute of Materials Science TU Dresden, 01062 Dresden, Germany
jCenter for Advancing Electronics Dresden (cfaed), TU Dresden, 01062 Dresden, Germany
First published on 12th February 2015
Abstract
Graphene oxide (GO) has attracted great interest due to its extraordinary potential for biomedical application. Although it is clear that the naturally occurring morphology of biological structures is crucial to their precise interactions and correct functioning, the geometrical aspects of nanoparticles are often ignored in the design of nanoparticles for biological applications. A few in vitro and in vivo studies have evaluated the cytotoxicity and biodistribution of GO, however very little is known about the influence of flake size and cytotoxicity. Herein, we aim at presenting an initial cytotoxicity evaluation of different nano-sized GO flakes for two different cell lines (HeLa (Kyoto) and macrophage (J7742)) when they are exposed to samples containing different sized nanographene oxide (NGO) flakes (mean diameter of 89 and 277 nm). The obtained data suggests that the larger NGO flakes reduce cell viability as compared to smaller flakes. In addition, the viability reduction correlates with the time and the concentration of the NGO nanoparticles to which the cells are exposed. Uptake studies were also conducted and the data suggests that both cell lines internalize the GO nanoparticles during the incubation periods studied.
1. Introduction
Nanotechnology has provided the means to synthesize different types of nanoparticles from a wide variety of materials, with each pursuing a diverse range of features (e.g. size, shape and surface reactivity). Only after thorough characterization of their morphological features is it possible to individually study what the actual role of the nanoparticles is when in contact with biological systems. This is also crucial to draw accurate correlations between the nanoparticle design and a specific biological response and ultimately use these data to build a database containing information on how specific features of nanoparticles are linked to specific biological responses.1,2The inspiration to create such a database is linked to natural design. Molecules, viruses, bacteria and other biological structures have evolved into precise sizes, shapes and chemistries to mediate specific interactions and functions.2 Viruses, for example, pursue capsids with different symmetries such as icosahedral, bullet-shaped, rod-shaped or can have asymmetric morphologies. These geometries are thought to play an important role in their ability to infect specific cell types and may alter their residence time inside the cell.2–4
To date, the physicochemical properties of naturally occurring nano-sized complexes and structures are far from being understood. However, it is clear that these biological structures follow specific design rules.5 Hence, in order to engineer nanostructures capable of specific functions, such as to circulate in the body, infect and control cells or to detect and repair unhealthy cells, it is crucial to understand how synthetic nano-structured materials interact with biological systems.
The different shapes, sizes and properties of nanostructured materials are not only thought to have many different biomedical applications,6–9 but also present different cytotoxic potential.10,11 A recent study showed that the binding and activation of membrane receptors strongly depend on the size of silver and gold nanoparticles.12 This provides evidence that morphological aspects of nanoparticles can mediate molecular processes that are crucial for regulating the correct function of the cell. Indeed, different diameters of carbon nanotubes show different interactions with proteins, which can disturb vital cellular functions.13
The two dimensional sp2 hybridized carbon structure graphene presents extraordinary properties in the field of material science and physics. It initially attracted interest because of its mechanical, optical and electronic properties,14–17 but graphene is also thought to have biological application in fields such as biosensing.18 However, since graphene is highly hydrophobic, its use for biological purposes is more promising in its oxidized form, namely graphene oxide (GO). The GO provides a better platform for biological purposes because it is hydrophilic due to the presence of different functional groups on its surface and edges. Therefore, GO can be easily dispersed and stabilized in a physiological environment. These functional groups together with the high loading capacity render GO a unique platform for further functionalization with drugs, polymers and other biomolecules.19–21
In fact, it has been already well reported in the literature that the functionalization of graphene and graphene oxide flakes with polymers22,23 and other biomolecules24 increase their dispersion and stability in a wide variety of physiological media as well as render additional properties to the material. Dai et al.25 used polyethylene glycol (PEG) for the first time to functionalize GO, which also served as an anchor for further anticancer drugs such as doxorubicin.25 The conjugation of drug and GO leaded to a significant enhancement of chemotherapy efficacy.26 However, despite the functionalization which yields novel and useful properties it has also been reported that slight changes in the molecules used to functionalize graphene oxide can cause different biological responses, e.g. GO functionalized with the linear PEG is more internalized than a branched version of PEG.22 Moreover, the branched PEG induces more cellular function changes than its linear counterpart. Hence it is firstly of interest to study GO without the influence of extra functionalization and correlate any response with flake size.
Despite the promising potential of GO to be further tailored with specific biomolecules,27 very little is known about the influence and correlation of the NGO size and the different biological responses it might trigger on cells, e.g. toxicity, uptake. De Marzi et al.28 showed recently, evidence that graphene oxide flakes have a high genotoxic response on different cell lines. Flakes with sub 100 nm present the highest genotoxic.
Furthermore, a few in vitro studies have already been conducted to evaluate the biocompatibility of graphene oxide29 in different cell lines. Recently in vivo studies have been conducted to evaluate the biodistribution and of GO in mice,30,31 but none of these studies addressed any possible correlation between the size of the GO flakes with the biological response studied.
Carbon black (CB) nanoparticles are more discussed in the literature. A recent work using CB nanoparticles with different sizes (50 nm and 500 nm) induce inflammatory responses in THP-1 cells. The smaller nanoparticles altered the phagocytic capacity of cells while no significant alteration could be seen for the big nanoparticles.32 Another study with CB nanoparticles showed that large sizes are more internalized by cells.33
Herein, we synthesized two different samples, each containing nano-sized graphene flakes with distinct mean size distributions and investigated the viability of two different cell lines when exposed to these two nanographene oxide (NGO) sizes. The study was conducted for different incubation periods and our results suggest that both the size of the nanographene oxide flakes and the incubation period play a role in the toxic effect triggered by these nanoparticles. The uptake of the nanographene oxide was also investigated and showed that cells can internalize the nanoparticles during the incubation period studied.
2. Materials and methods
2.1. Synthesis
The nanographene oxide (NGO) was produced from commercially available natural graphite and was based on a modified Hummers method.20,34,35 Briefly, 1 g of the commercially available graphite was ground with 50 g of sodium chloride (NaCl) for 15 minutes in order to exfoliate the graphite as well as reduce its size. In order to remove the NaCl mixed with graphite, the contained NaCl was dissolved in distilled water at a temperature of ca. 55 °C and subsequently filtrated using 450 nm porous TEFLON filter paper by suction filtration. The filtrated graphite was mixed in 23 mL 95% sulfuric acid (H2SO4) and left it stirring vigorously overnight. Afterwards, the temperature of the mixture was kept constant at 10 °C in an ice bath while 3 g potassium permanganate (KMnO4) was added gradually over 3 h with constant stirring. Afterwards, the mixture was sonicated for 3 h and continuously stirred for 30 minutes at 35 °C and another 45 minutes at 50 °C. Finally, 46 mL distilled water was added to the mixture and kept stirring at 100 °C for 45 min. The mixture was cooled down to room temperature and stirred with the addition of 140 mL distilled water and 10 mL of 30% hydrogen peroxide (H2O2). The final solution filtrated and washed 10 times with 5% HCl and distilled water to remove any reaction byproducts and the oxidized graphene was collected. In order to further reduce both the width (lateral cracking) and thickness (exfoliation) of the oxidized graphene flakes, distilled water was added and the solution was then subjected to ultrasonication using a horn-tipped ultrasonic probe. In this work two different sizes of NGO were produced (depending on the sonication period). Tip-sonication for 30 minutes produced samples with an average NGO flake size of 277 nm and ∼4 layers (ca. 1.4 nm), while was tip-sonication for 4 hours reduced the average flake size to 89 nm and ∼6 layers (ca. 2.1 nm).2.2. Sample characterization
2.3. Biological characterization
The NPs were suspended in DI water at a stock concentration of 0.5 mg mL−1. To assure a uniform dispersion of the particles the suspensions were vortexed (stirred) on a Vortex Genie 2T for 2 min prior to usage. After incubating the cells at 37 °C and 5% CO2 in the presence of increasing concentrations of NPs (controls with only DI water, 1 μg mL−1, 10 μg mL−1 and 100 μg mL−1) for either 12 or 48 h, 10 μL of the MTT solution (5 mg mL−1 in PBS) was added to the 0.1 mL culture medium per well and the 96 well plates were returned to the incubator for another 4 h. After carefully removing 80 μL of the supernatant the produced formazan crystals were then dissolved in 0.1 mL of the pre-warmed MTT solubilization solution (10% Triton X-100, 0.1 M HCl in anhydrous isopropanol) by gently shaking the plates in an ELISA microplate reader (15 min, 14 Hz, 37 °C, SAFAS MP96). The absorbance of the formazan dye was measured in the SAFASMP96 reader at 550 nm/650 nm within an hour and after having subtracted the background from the sample, the percentage cell viability was calculated. Each of the conducted experiments was repeated three times. Both nanoparticle- and cell-free controls were performed. The statistical analysis was conducted using an ordinary one-way ANOVA followed by Bonferroni multiple comparisons post-test with GraphPad InStat 3 (Version 3.10, 32 bit, GraphPad Software, Inc., La Jolla, USA). A value of p < 0.05 was considered as statistically significant.
3. Results
As illustrated in Fig. 1, two different sizes of NGO flakes were synthesized and characterized prior to the biological evaluation. The size-dependent cytotoxicity was investigated using the MTT assay for 12 and 48 hours incubation periods. Additionally, the cell death was assessed through the trypan blue assay. The uptake was studied using a transmission electron microscope (TEM) of 70 nm thick slices of cells embedded in epoxy resin.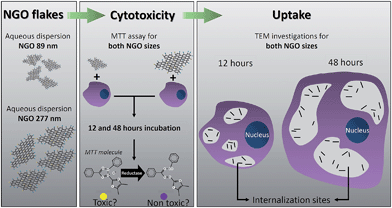 | ||
| Fig. 1 Schematic illustrating the procedure employed to evaluate the size-dependent cytotoxicity and cellular uptake of NGO. | ||
3.1. Nanoparticle synthesis and characterization
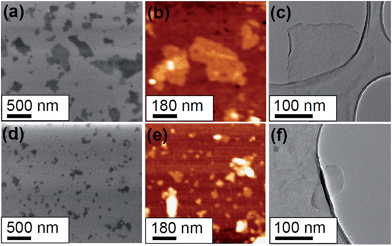
The morphology of the two as-produced nanographene oxide samples was studied using various techniques. In Fig. 2 panel (a) to (c) provide typical SEM, AFM and TEM images of the nanographene sample containing flakes with a mean diameter of 277 nm and ca. 4 graphene layers. In Fig. 2 panel (d) to (f) similar SEM, an AFM and a TEM images of the nanographene sample containing flakes with a mean diameter of 89 nm and ca. 6 graphene layers are provided. Pictures of the solution containing the concentrated nanographene samples in aqueous solution is shown in Fig. S2 in the ESI.† The flake sizes obtained by SEM imaging is in agreement with dynamic light scattering (DLS) data of NGO in aqueous solution. In this case a concentrated solution of NGO was diluted to concentrations of 1, 10 and 100 μg mL−1. The obtained hydrodynamic sizes are higher than those under dried conditions (as expected due to hydration). The DLS results for both samples in aqueous solutions are shown in Table 1.| Sample | Concentration [μg mL−1] | DLS size ± error [nm] |
|---|---|---|
| 1 (277 nm) | 1 | 489.9 ± 34.6 |
| 10 | 394.8 ± 3.8 | |
| 100 | 399.26 ± 10.9 | |
| 2 (89 nm) | 1 | 112.9 ± 1.5 |
| 10 | 107.5 ± 3.6 | |
| 100 | 98.3 ± 2.4 |
The presence of sp2 carbon hybridization was confirmed by Raman spectroscopy as shown in Fig. S3 in the ESI.† The Raman data shows the presence of the D, G and 2D modes at ca. 1350 cm−1, 1600 cm−1 and 2700 cm−1 respectively, which are characteristic signatures for graphene. The presence of a large D mode indicates that the graphene flakes are rather defective. This is expected since the initial graphite was oxidized and different functional groups were inserted both on the basal planes and edges of the nanographene flakes. The presence of functional groups were confirmed using Fourier transform infrared spectroscopy (FTIR). The IR spectra are presented in Fig. S3† and present a variety of functional species. The most characteristic groups show peaks at 750, 1700 and 2225 cm−1, which correspond to C–O, C–H and C![[double bond, length as m-dash]](https://www.rsc.org/images/entities/char_e001.gif) O groups, respectively.
O groups, respectively.
In order to check the presence of contaminants or undesired materials, EDX measurements of individual flakes were performed when observing individual nanographene oxide flakes in the TEM (see Fig. S4 in the ESI†). The EDX data only shows the presence of carbon (C) and oxygen (O). The presence of a copper (Cu) signal is attributed to the TEM Copper grids. XPS investigations were also conducted and are shown in Fig. S5 in the ESI.† It provides typical XPS spectra of the nanographene oxide samples for the C 1s (Fig. S5(a)†) and for the O 1s (Fig. S5(b)†). For the C 1s edge, deconvolution of the peak revealed various components corresponding to different functional groups at 284.4, 285.1, 286.8 and 288.6 eV, which correspond respectively to sp2 carbon, hydroxylic, epoxy, carbonyl and carboxylic functional groups. The O 1s spectra were deconvoluted and showed peaks centered at 531.3, 533.3 and 535.1 eV, which correspond to carboxylic, epoxy and hydroxylic functional groups.
The XPS data shown in Fig. S5† panels (a), (b) and (c) reveal the presence of trace amounts sulfur (S), sodium (Na) and chlorine (Cl), respectively. The presence of these elements is assigned to the initial GO synthesis process, which used acids containing these elements. As mentioned before, the samples were rinsed abundantly with distilled water in order to remove unwanted byproducts from the oxidation reaction. However even with intense rinsing some of these byproducts might penetrate in between the graphene layers, remain trapped inside or be physicochemically absorbed and are difficult to fully avoid. In this case the contaminants offer no risk since they are not free in the solution.
3.2. Toxicity evaluation
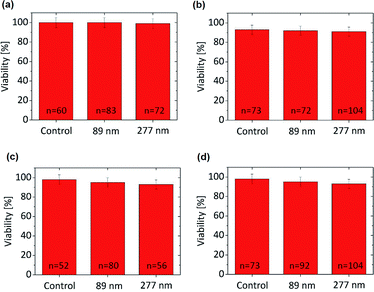
The size dependent cytotoxicity of the nanographene oxide flakes was investigated. Two different cell lines (HeLa Kyoto and macrophages (J7442)) were incubated with the NGO dispersed in water at three distinct concentrations (1, 10 and 100 μg mL−1) for a period of 12 and 48 h. In order to quantify the toxicity of the different NGO, two different approaches were used. Initially, the mitochondrial activity of the cells was assessed with a colorimetric assay that is based on the reduction of yellow MTT (3-[4,5-dimethylthiazol-2-yl]-2,5-diphenyltetrazolium bromide) to purple formazan crystals by mitochondrial dehydrogenase enzymes. The cleavage of MTT occurs only in living cells so that the amount of the produced formazan crystals is proportional to the number of living cells. In addition, to exclude the possible influence of the NPs on the test results, cell-free tests were simultaneously conducted. The MTT assay does not provide any information as to whether the NPs themselves cause cell death or whether they simply reduce the cellular metabolic activity. Hence we implemented a second approach, the dye exclusion method with trypan blue. It is based on the exclusion of the blue dye from healthy cells. In dead cells the membrane is no longer functional (ruptured) and the dye is able to stain the cell interior. Using a visible light microscope, the dead cells are observed to be dark blue instead of bright.3.3. Uptake evaluation
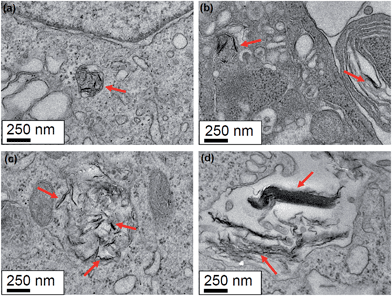
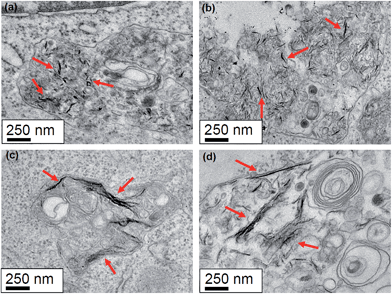
The uptake of the nanographene oxide nanoparticles was investigated using TEM. The TEM studies were conducted for the two cell lines incubated with NPs at a concentration of 10 μg mL−1. Fig. 5(a) and (b) show a HeLa cell incubated with the 89 nm flakes for 12 and 48 hours and Fig. 5(c) and (d) with the 277 nm for 12 and 48 h, respectively. The HeLa cells internalized both samples with no obvious difference in the amount of uptaken material being determined (using TEM). The data clearly shows that the nanoparticles are compartmentalized inside vesicles and are mostly present in a many-particle fashion. This could be the result of the agglomeration of flakes in the culture medium, which is especially the case after long incubation periods as depicted in Fig. 5(d). However, inside the vesicles it is possible to see that the size of both samples match the measured values determined from the SEM images for individual particle sizes.The results presented do not provide information on what endocytic pathway is used by the cell to internalize the NGO flakes and is the scope of the current work. For this purpose, the inhibition of specific pathways of endocytosis is necessary as recently published by Linares et al.36 The influence of flake size on the endocytic pathway was studied by Mu et al.37 and the data suggest that small flakes are internalized by clathrin-mediated endocytosis (CME), whereas big flakes are mainly internalized by phagocytosis and CME.
The same set of uptake studies were also performed for the macrophages. The observed results were similar as the HeLa cells. Fig. 6 panels (a) and (b) show a macrophage cell incubated with the 89 nm flakes for 12 and 48 hours, respectively, whereas in Fig. 6(c) and (d) a macrophage cell incubated with the 277 nm flakes. As with the HeLa cells, the macrophage cells internalized both nanographene sizes, again, with no obvious difference in the quantity of internalized material with respect to NGO flake size. Here again, the uptake happens in a many-particle fashion and inside the vesicles it is possible to see that the size of both samples match the measured values.
A very interesting observation was clearly visible in the morphology of the macrophages after they were incubated with the nanographene oxide for 48 hours. These cells are phagocytic white blood cells, widely distributed in the vertebrate body, and form part of the innate immune system. They are the first cells that respond to infectious agents such as viruses, toxins and most certainly also nanoparticles. These cells are able to ingest and kill harmful microorganisms by producing a variety of toxic chemicals and powerful degradative enzymes, which takes place inside vacuoles (phagosomes).38
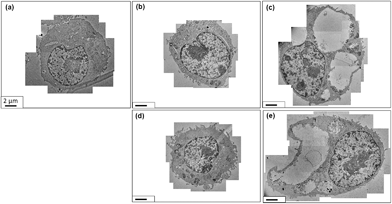
In our observations, the macrophage cell line showed the formation of large vacuoles inside of which resided NGO flakes (Fig. 7). The cells were also found to increase in size. In comparison to the control samples and the 12 hours incubation, none of these changes could be observed. Fig. 7(a) shows the control sample without the presence of NGO. Fig. 7(b) and (c) show the macrophages incubated with the 89 nm nanographene oxide flakes for 12 and 48 hours respectively. The presence of big vacuoles after 48 hours incubation are easily observed and occupy enormous volumes of the cytoplasm. At a higher magnification the nanographene oxide can be identified inside the vacuoles. The same pattern is observed in Fig. 7(d) and (e) where the macrophages were incubated with the 277 nm NGO flakes for 12 and 48 hours incubation periods respectively. No differences in the uptake can be correlated with the size of the nanographene oxide.
The control samples were cultivated for the same time as those incubated with NGO flakes, however only cells who were in an environment with nanographene oxide flakes present showed the formation of vacuoles. These vacuoles only occur after longer exposure times to the nanographene oxide flakes. It is not clear why the macrophages changes the internal structures after 48 hours incubation, none-the-less our data does suggest it is the NGO flakes that trigger this response.
The formation of large vacuoles on macrophages has been observed before when these cells were infected with certain pathogens, however no detailed explanation with regards their initiation was provided.39 It is known that some molecules such as lipopolysaccharide (LPS), which is an integrant of outer membrane of Gram-negative bacteria, is a strong activator of macrophages and can induce the formation of large vacuolar structures.40 To our knowledge the cascade of events responsible to trigger the vacuolization has not been fully clarified yet, but previously published results suggest that its origin is related with other organelles such as plasma membrane, Golgi apparatus and endoplasmic reticulum40 as well as the p38 mitogen-activated protein kinase.41
The formation of vacuoles can be observed only after 48 h incubation and in the macrophage cell line only. The data suggests that both sizes of NGO trigger the formation of vacuoles and no size dependence can be observed in this case. Despite recently published studies investigated the interactions of macrophages with NGO were performed,36,42 no formation of such large vacuoles was observed. In order to obtain further information if the NGO nanoparticles were inducing the formation of the vacuoles, a set of iron oxide nanoparticles at 10 μg mL−1 were incubated with the macrophages for 12, 24 and 48 hours and the cells were imaged. The results shown in Fig. S8 in the ESI,† shows that the iron oxide nanoparticles are internalized and suggest that the nanoparticles are inside membrane-like structures like the NGO nanoparticles. However, the data with the iron oxide nanoparticles do not show cells with large vacuoles in any of the incubation times studied. This also suggests that not all types of nanoparticles trigger the formation of vacuoles. Although more studies must be conducted in order to better understand the processes involved in the observed cellular behavior, our data suggest that the NGO might be responsible for the biological signal which triggers the formation of increased vacuoles after 48 hours incubation.
4. Conclusion
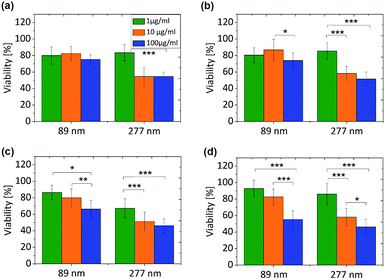
The toxicity data assessed using NGO flakes with two distinct size distributions across two cell lines (HeLa cells and macrophages) suggest size can affect toxicity. For incubation times of 12 hours the small flakes (89 nm) show no difference with respect to concentration (1, 10 and 100 μg mL−1), whereas for the larger flakes (277 nm) a reduction in viability is observed for the highest concentrations used (10 and 100 μg mL−1). After 48 hours incubation a decrease in viability is observed when the NGO flake concentration increased for both cell lines. In the case of a longer incubation period, the sizes of the nanographene oxide seem to have little or no influence in the reduction of cell viability. The TEM investigations confirmed that the NGO flakes are internalized by both cell lines regardless of the incubation period. Moreover, no obvious difference in the uptake could be observed between the different sizes of the NGO. The uptake studies suggests that the macrophage cells undergo a morphology change after 48 hours incubation with NGO flakes regardless of size. This morphological change leads to the formation of large vacuoles containing NGO flakes. Future studies might better help understand this process. Our results provide valuable initial information on the cytotoxicity of NGO flakes with respect to flake size as well as cell line-dependent morphological changes for extended incubation periods.Notes and references
- S. Dasgupta, T. Auth and G. Gompper, Nano Lett., 2014, 14, 687 CrossRef CAS PubMed.
- A. Albanese, P. S. Tang and W. C. W. Chan, Annu. Rev. Biomed. Eng., 2014, 14, 1 CrossRef PubMed.
- R. Twarock and T. Keef, Microbiol. Today, 2010, 37, 24 Search PubMed.
- P. Cermelli, G. Indelicato and R. Twarock, Discrete and Topological Models in Molecular Biology Natural Computing Series, 2014, p. 217 Search PubMed.
- C. M. Feldherr, R. E. Lanford and D. Akin, Proc. Natl. Acad. Sci. U. S. A., 1992, 15, 11002 CrossRef.
- Y. Xia, et al. , Adv. Mater., 2007, 15, 353 CrossRef.
- A. P. Alivisatos, Science, 1996, 271, 933 CAS.
- R. Elghanian, J. J. Storhoff, R. C. Mucic, R. L. Letsinger and C. A. Mirkin, Science, 1997, 227, 1078 CrossRef.
- L. R. Hirsch, et al. , Proc. Natl. Acad. Sci. U. S. A., 2003, 100, 13549 CrossRef CAS PubMed.
- Y. Pan, S. Neuss, A. Leifert, M. Fischler, F. Wen, U. Simon, G. Schmid, W. Brandau and W. Jahnen-Dechent, Small, 2007, 3(11), 1941 CrossRef CAS PubMed.
- S. Tomic, et al. , PLoS One, 2014, 9(5), e96584 Search PubMed.
- W. Jiang, B. Y. S. Kim, J. T. Rutka and W. C. W. Chan, Nat. Nanotechnol., 2008, 3, 145 CrossRef CAS PubMed.
- J. Gao, L. Wang, S. Kang, L. Zhao, M. Ji, C. Chen, Y. Zhao, R. Zhou and J. Li, Nanoscale, 2014, 6, 12828 RSC.
- K. S. Novoselov, A. K. Geim, S. V. Morozov, D. Jiang, Y. Zhang, S. V. Dubonos, I. V. Grigorieva and A. A. Firsov, Science, 2004, 306, 666 CrossRef CAS PubMed.
- C. Lee, X. Wei, J. W. Kysar and J. Hone, Science, 2008, 321, 385 CrossRef CAS PubMed.
- S. Stankovich, D. A. Dikin, G. H. B. Dommett, K. M. Kohlhaas, E. J. Zimney, E. A. Stach, R. D. Pine, S. T. Nguyen and R. S. Ruoff, Nature, 2006, 442, 282 CrossRef CAS PubMed.
- K. S. Novoselov, A. K. Geim, S. V. Morozov, D. Jiang, M. I. Katsnelson, I. V. Grigorieva, S. V. Dubonos and A. A. Firsov, Nature, 2005, 438, 197 CrossRef CAS PubMed.
- C. Chung, Y.-K. Kim, D. Shin, S.-R. Ryoo, B. H. Hong and D.-H. Min, Acc. Chem. Res., 2013, 26, 2211 CrossRef PubMed.
- Z. Liu, J. T. Robinson, X. Sun and H. Dai, J. Am. Chem. Soc., 2008, 130, 10876 CrossRef CAS PubMed.
- X. Sun, Z. Liu, K. Welsher, J. T. Robinson, A. Goodwin, S. Zaric and H. Dai, Nano Res., 2008, 1, 203 CrossRef CAS PubMed.
- Y. Wang, Z. Li, D. Hu, C. T. Lin, J. Li and Y. Lin, J. Am. Chem. Soc., 2010, 132, 9274 CrossRef CAS PubMed.
- M. Vila, M. T. Portolés, P. A. A. P. Marques, M. J. Feito, M. C. Matesanz, C. Ramírez-Santillán, G. Gonçalves, S. M. A. Cruz, A. Nieto and M. Vallet-Regi, Nanotechnology, 2012, 23, 465103 CrossRef CAS PubMed.
- B. Chen, M. Liu, L. Zhang, J. Huang, J. Yao and Z. Zhang, J. Mater. Chem., 2011, 21, 7736 RSC.
- Y. Wang, Z. Li, J. Wang, J. Li and Y. Lin, Trends Biotechnol., 2011, 29, 205 CrossRef CAS PubMed.
- Z. Liu, J. T. Robinson, X. Sun and H. Dai, J. Am. Chem. Soc., 2008, 130, 10876 CrossRef CAS PubMed.
- L. M. Zhang, Z. X. Lu, Q. H. Zhao, J. Huang, H. Shen and Z. J. Zhang, Small, 2011, 7, 460 CrossRef CAS PubMed.
- G. Gonçalves, M. Vila, M.-T. Portolés, M. Vallet-Regi, J. Gracio and P. A. A. P. Marques, Adv. Healthcare Mater., 2013, 2, 1072 CrossRef PubMed.
- L. de Marzi, L. Ottaviano, F. Perrozzi, M. Nardone, S. Santucci, J. de Lapuente, M. Borras, E. Treossi, V. Palermo and A. Poma, J. Biol. Regul. Homeostatic Agents, 2014, 28(2), 281 CAS.
- K. Wang, J. Ruan, H. Song, J. Zhang, Y. Wo, S. Guo and D. Cui, Nanoscale Res. Lett., 2011, 6, 1 Search PubMed.
- X. Zhang, J. Yin, C. Peng, W. Hu, Z. Zhu, W. Li, C. Fan and Q. Huang, Carbon, 2011, 29, 986 CrossRef PubMed.
- Y. Liu, J. Wu, Y. Wang, X. Yang, R. Yang, B. Wang, J. Yang and N. Zhang, Sci. Rep., 2013, 3, 1 Search PubMed.
- D. Sahu, G. M. Kannan and R. Vijayaraghavan, Carbon black particle exhibits size dependent toxicity in human monocytes, Int. J. Inflammation, 2014, 2014, 1 CrossRef PubMed.
- H. Kong, Y. Zhang, Y. Li, Z. Cui, K. Xia, Y. Sun, Q. Zhao and Y. Zhu, Int. J. Mol. Sci., 2013, 14, 22529 CrossRef CAS PubMed.
- W. S. Hummers and R. E. Offeman, J. Am. Chem. Soc., 1958, 80, 1339 CrossRef CAS.
- L. L. Staudenmaier, Ber. Dtsch. Chem. Ges., 1898, 31, 1481 CrossRef CAS.
- J. Linares, M. C. Matesanz, M. Vila, M. J. Feito, G. Gonçalves, M. Vallet-Regí, P. A. A. P. Marques and M. T. Portolés, ACS Appl. Mater. Interfaces, 2014, 6, 13697 CAS.
- Q. Mu, G. Su, L. Li, B. O. Gilbertson, L. H. Yu, Q. Zhang, Y. P. Sun and B. Yan, ACS Appl. Mater. Interfaces, 2012, 4, 2259 CAS.
- K. M. Murphy, P. Travers and M. Walport, in Janeway's Immunobiology, Garland Science, Taylor & Francis Group, LLC, New York, 8th edn, 2011, pp. 3–6 Search PubMed.
- M. S. Gomes, S. Paul, A. L. Moreira, R. Appelberg, M. Rabinovitch and G. Kaplan, Infect. Immun., 1999, 67, 3199 CAS.
- K. Yoshida, M. Ono and H. Sawada, J. Endotoxin Res., 1999, 5, 127 CrossRef CAS PubMed.
- F. Hassan, S. Islam, N. Koide, M. M. Mu, H. Ito, I. Mori, T. Yoshida and T. Yokochi, Microbiol. Immunol., 2004, 48, 807 CrossRef CAS PubMed.
- F. Feito, M. Vila, M. C. Matesanz, J. Linares, G. Gonçalves, P. A. A. P. Marques, M. Vallet-Regí, J. M. Rojo and M. T. Portolés, J. Colloid Interface Sci., 2014, 432, 221 CrossRef PubMed.
Footnote |
| † Electronic supplementary information (ESI) available: Fig. S1: aqueous dispersion of NGO; Fig. S2: histograms showing the measurements of diameter and height of NGO; Fig. S3: Raman and Infrared spectra of NGO; Fig. S4: EDX measurement of NGO done in the TEM; Fig. S5: XPS spectra of NGO; Fig. S6: optical images for trypan blue assay of HeLa cells and Fig. S7: optical images for trypan blue assay of macrophages; Fig. S8: uptake images of iron oxide NPs after 48 hours incubation. See DOI: 10.1039/c5tb00180c |
| This journal is © The Royal Society of Chemistry 2015 |

