 Open Access Article
High power density of reverse electrodialysis with pore-filling ion exchange membranes and a high-open-area spacer†
Han-Ki
Kim‡
a,
Mi-Soon
Lee‡
b,
Seo-Yoon
Lee
a,
Young-Woo
Choi
b,
Nam-Jo
Jeong
a and
Chan-Soo
Kim
*a
aJeju Global Research Center, Korea Institute of Energy Research, 200, Haemajihaean-ro, Gujwa-eup, Jeju 695-971, South Korea. E-mail: damulkim@kier.re.kr; Fax: +82-64-805-2203; Tel: +82-64-800-2251
bHydrogen and Fuel Cell Center for Industry, Academy and Laboratory, Korea Institute of Energy Research, 20-41, Sinjaesaengeneoji-ro, Haseo-myeon, Buan-gun, Jeolllabuk-do 579-814, South Korea
First published on 3rd July 2015
Abstract
In the present study, a novel reverse electrodialysis (RED) stack with ultrathin lab-made pore-filling membranes and a high-open-area spacer was proposed to enhance the gross power density. The proposed stack had much lower internal resistance than a typical RED stack at optimum flow rates of seawater and river water. Therefore, a gross power density of 2.4 W m−2 was achieved.
Introduction
Salinity gradient power (SGP), also called blue energy, is a newly emerging form of marine renewable energy. SGP is the energy available from the salinity difference between seawater and river water, which respectively have high and low salt concentrations. The SGP energy potential between typical seawater and river water is 231 m (∼23 atm.) of hydraulic water head. The global energy potential is estimated to be 2.4–2.6 TW, which is ∼80% of the global electricity demand.1–3Among membrane-based blue energy technologies, reverse electrodialysis (RED), the opposite process of electrodialysis (ED), has been applied practically. RED uses a stack of alternating cation (CEM) and anion (AEM) exchange membranes. For RED to find greater use, a high power density (power generated per membrane area) is essential. By increasing the power density, the membrane demand and RED stack size can be decreased.4 Thus far, typical commercially available RED membranes have shown a maximum power density of 2.2 W m−2.5
In a typical RED stack, the spacer is an essential component that contributes greatly to the RED performance.5,6 The spacer thickness influences the electrical resistance of the RED stack. The threads of the spacers attached to the membrane surface hinder contact between the feed water and the ion exchange membranes (IEMs) by the so-called shadow effect.6,7 The shadow effect is related to the open area of the spacer. Therefore, it is essential to select a spacer with both small thickness and large open area. By reducing the spacer thickness below 100 μm, Vermaas et al.5 achieved a gross power density of 2.2 W m−2 using commercial IEMs. If there is no spacer in the RED stack, the membranes require additional treatments to increase the IEM performance.8–10
The IEM also strongly influences the performance, specifically, the power density, of the RED stack.2,11,12 Although studies have, over the last decade, improved the IEM characteristics, they do not yet match the expected characteristics for RED.2 Generally, IEMs for ion separation processes require high strength and long lifetime regardless of the electrical resistance and thickness; however, IEMs for RED require low electrical resistance and high permselectivity.13
Many studies have attempted to develop IEMs for RED. Güler et al.2 were the first to design IEMs for RED. They achieved a power density of 1.27 W m−2 using tailor-made membranes consisting of halogenated polyethers such as polyepichlorohydrin (PECH).2 They also developed microstructured IEMs for a spacer-free RED stack and achieved up to 20% improvement in the RED performance.9 Nevertheless, most present IEMs for RED still do not possess both the thinness and the mechanical strength required for higher power density of the RED stack. To solve this problem, we have developed pore-filling-type IEMs for RED. For the first time, Yamaguchi proposed pore filling membranes for polymer electrolyte fuel cells.14 A pore-filling membrane consists of a very thin porous substrate to provide mechanical strength and an electrolyte polymer in the substrate pores to allow ion conductivity. Meanwhile, electrolyte-polymer-filled pores should have high ion exchange capacity (IEC) to increase the ion conductivity.
In the present study, we developed a novel RED stack with lab-made pore-filling IEMs and specific spacers to achieve higher power density in RED. We determined the gross power density to confirm the performance and internal resistance of our proposed RED stack.
Experimental
RED stack
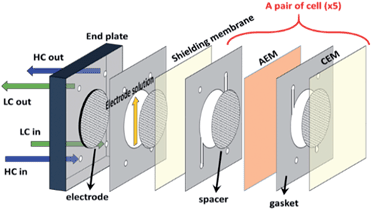
The RED stack (Fig. 1) comprised two end plates (10 cm × 10 cm × 1.5 cm) made of acrylic resin and five cell pairs. Each cell pair contained a CEM, an AEM (effective area: 19.6 cm2), spacers, and gaskets. An additional CEM for shielding was located near the electrode to maintain the condition of the electrode compartment. Except for the shielding membrane, CEMs and AEMs were alternately stacked between the electrodes. PTFE gaskets (thickness: 100 μm, Tommy Hecco, South Korea) and spacers (DS Mesh, South Korea) were installed to prevent contact with membranes and provide a channel for the feed solutions. Table 1 lists the characteristics of the spacers used in this study. The electrodes (diameter: 50 mm) were made of platinum clad niobium mesh (Sung Wing Technology Co., Hong Kong, China). They were mechanically connected to titanium current collectors.| Name | Thickness (μm) | Mesh opening (μm) | Open area (%) |
|---|---|---|---|
| Econo 90-20D | 100 | 237 | 70.6 |
| Econo 70-30D | 94 | 308 | 72.0 |
| Econo Black 130-20D | 100 | 916 | 81.3 |
| Econo Black 180-20D | 64 | 444 | 63.2 |
0.05 M of potassium hexacyanoferrate(II) and potassium hexacyanoferrate(III) (EP grade, Daejung, South Korea) mixed solution was used as the electrode solution and 0.5 M of sodium sulphate (EP grade, Daejung, South Korea) as the supporting electrolyte. Viton® tubing was used to prevent oxygen transfer to maintain the condition of the electrode solution. Artificial seawater (0.58 M NaCl) and river water (0.017 M NaCl) were used as the feed solutions. The flow rate was maintained at 50 mL min−1 in all experiments. To investigate the effect of the flow rate on the RED performance, flow rates of seawater and river water were equally changed from 5 to 100 mL min−1, which corresponded to 1 to 20 mL per min per cell, respectively. The power density was measured by a linear potential sweep using a potentiostat (ZIVE SP2, Wonatech, South Korea) with a sweep rate of 40 mV s−1. The internal resistance of the RED stack was estimated as the resistance at the highest power density.4
Pore-filling membranes
We developed three different pore-filling membranes for the RED system: one anion exchange membrane (KIER-AEM1) and two types of cation exchange membranes (KIER-CEM1 and KIER-CEM2). KIER-AEM1 is an inner membrane for anion transport; it consists of a polymer cross-linked using N,N-bis(acryloyl)piperazine and (vinylbenzyl)trimethylammonium chloride (1![[thin space (1/6-em)]](https://www.rsc.org/images/entities/char_2009.gif) :
:![[thin space (1/6-em)]](https://www.rsc.org/images/entities/char_2009.gif) 11.01 mol mol−1) in a porous polyolefin substrate (see the ESI† for details). KIER-CEM1 is another inner membrane for cation transport; it consists of a polymer cross-linked using N,N′-ethylenebis(acrylamide) and vinyl sulphonic acid (1
11.01 mol mol−1) in a porous polyolefin substrate (see the ESI† for details). KIER-CEM1 is another inner membrane for cation transport; it consists of a polymer cross-linked using N,N′-ethylenebis(acrylamide) and vinyl sulphonic acid (1![[thin space (1/6-em)]](https://www.rsc.org/images/entities/char_2009.gif) :
:![[thin space (1/6-em)]](https://www.rsc.org/images/entities/char_2009.gif) 8.83 mol mol−1). KIER-AEM1 and KIER-CEM1 were used to enable enhanced ion passage through the membranes. KIER-CEM2 is a shielding membrane to prevent the crossover of redox couples and water back-diffusion toward the electrode sides and is used for cation transport; it consists of a cross-linked polymer with N,N′-ethylenebis(acrylamide) and acrylamido-2-methyl-1-propanesulphonic acid (1
8.83 mol mol−1). KIER-AEM1 and KIER-CEM1 were used to enable enhanced ion passage through the membranes. KIER-CEM2 is a shielding membrane to prevent the crossover of redox couples and water back-diffusion toward the electrode sides and is used for cation transport; it consists of a cross-linked polymer with N,N′-ethylenebis(acrylamide) and acrylamido-2-methyl-1-propanesulphonic acid (1![[thin space (1/6-em)]](https://www.rsc.org/images/entities/char_2009.gif) :
:![[thin space (1/6-em)]](https://www.rsc.org/images/entities/char_2009.gif) 3.25 mol mol−1). To improve the power output in an RED stack, the shielding membrane should have higher permselectivity rather than fast ion transport. As reported in our previous paper,15 the dry thickness of the resulting KIER-AEM1 is ∼23 μm; KIER-CEM1 and KIER-CEM2 had similar dimensions. Furthermore, the prepared membranes showed very high mechanical strength (tensile strength of 130 MPa).16 In this study, the prepared membranes were physicochemically and electrochemically characterized in terms of the swollen membrane thickness (Tw), swelling degree (SD), ion exchange capacity (IEC), fixed charge density (CDfix), membrane resistance (Rm), and permselectivity (α) (see the ESI† for details).
3.25 mol mol−1). To improve the power output in an RED stack, the shielding membrane should have higher permselectivity rather than fast ion transport. As reported in our previous paper,15 the dry thickness of the resulting KIER-AEM1 is ∼23 μm; KIER-CEM1 and KIER-CEM2 had similar dimensions. Furthermore, the prepared membranes showed very high mechanical strength (tensile strength of 130 MPa).16 In this study, the prepared membranes were physicochemically and electrochemically characterized in terms of the swollen membrane thickness (Tw), swelling degree (SD), ion exchange capacity (IEC), fixed charge density (CDfix), membrane resistance (Rm), and permselectivity (α) (see the ESI† for details).
Results and discussion
The lab-made membranes were compared with commercially available ones, as listed in Table 2. An IEM's SD in a solution is a crucial factor for determining its CDfix (see the ESI† for details).17 Furthermore, the IEC reflects the ion-transport capacity to generate ionic current, being converted to electronic current at the electrodes in the RED process. Many studies on RED derived CDfix from the relationship between an IEM's IEC and SD. Typically, CDfix is denoted as an equivalent of the IEMs' functional groups per weight of its absorbed water.18 This calculation does not consider the geometry of the membrane structure. However, the geometry should definitely be considered because some IEMs such as pore-filling membranes, with alternating microstructures between the electrolyte and nonelectrolyte polymers, show different water uptakes and dimensional changes (we will evaluate CDfix for various IEMs in greater detail in a separate paper). Therefore, we insist that the dimensional change in the swollen IEM is a more feasible means of determining CDfix than the weight change in the absorbed water. Table 2 shows that CDfix of the lab-made membranes is comparable to that of commercially available membranes. Długołęcki et al. noted that an IEM's fixed charge density strongly affects its permselectivity and resistance.13 However, the membrane resistance of the KIER lab-made IEMs is very low compared to that of commercial IEMs, although all CEMs and AEMs had similar CDfix and permselectivities. This result indicates that the membrane resistance definitely depends on the membrane thickness rather than on CDfix. Furthermore, we could not conclusively prove the correlation between CDfix and permselectivity. Instead, we consider that the membrane morphology more greatly affects the membrane permselectivity. The membrane resistance has a functional relationship between the IEC and the IEM thickness. The ion-transport capacity and membrane thickness strongly influence the power density in RED. In other words, the high ionic resistance of IEM leads to a negative effect such as an increase in the resistance in the RED stack at low concentrations.19 Therefore, we developed lab-made IEMs with a low membrane resistance and high ion-transport capacity using the pore-filling technique.| Membranes | Manufacturer | T w (μm) | SD (normalized) | IEC (meq. gdry−1) | CDfix (meq. gwet−1) | R m (Ω cm2) | α (%) |
|---|---|---|---|---|---|---|---|
| FKS | FumaTech GmbH, Germany | 36 | 0.220 | 1.54 (ref. 13) | 7.0 | 1.50 (ref. 13) | 94.2 (ref. 13) |
| FAS | FumaTech GmbH, Germany | 42 | 0.235 | 1.12 (ref. 13) | 4.8 | 1.03 (ref. 13) | 89.4 (ref. 13) |
| CMX | Tokuyama Co., Japan | 172 | 0.222 | 1.62 (ref. 13) | 7.3 | 2.91 (ref. 13) | 99.0 (ref. 13) |
| AMX | Tokuyama Co., Japan | 129 | 0.175 | 1.25 (ref. 13) | 7.1 | 2.35 (ref. 13) | 90.7 (ref. 13) |
| CMV | Asahi Glass Co. Ltd, Japan | 110 | 0.296 | 2.01 (ref. 13) | 6.8 | 2.29 (ref. 13) | 98.8 (ref. 13) |
| AMV | Asahi Glass Co. Ltd, Japan | 107 | 0.198 | 1.78 (ref. 13) | 9.0 | 3.15 (ref. 13) | 87.3 (ref. 13) |
| KIER-CEM1 | Lab-made | 26 | 0.269 | 2.64 | 9.8 | 0.34 | 97.8 |
| KIER-AEM1 | Lab-made | 27 | 0.219 | 1.55 | 7.1 | 0.28 | 91.8 |
| KIER-CEM2 | Lab-made | 27 | 0.217 | 1.42 | 6.5 | 0.72 | 99.2 |
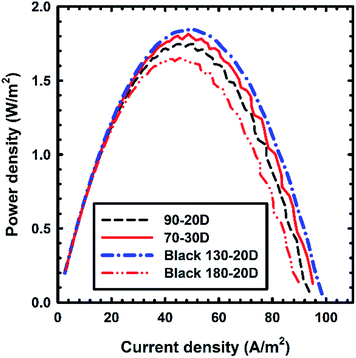
Fig. 2 shows the gross power density curves with respect to different nonconductive spacers (thickness: ∼100 μm). In this experiment, Selemion (AMV and CMV) membranes were used exclusively to compare the effect of the spacers. A gross power density of 1.8 W m−2 was obtained when the Black 130-20D spacer was used; this spacer had the highest open area (81.3%) among all the spacers. Several previous studies used thin and dimensional spacers to achieve a higher power density.5,6 However, the open areas of spacers with a plain weave were only 49–53%. Therefore, the highest net power density achieved was only 1.2 W m−2.5 Another study introduced dimensionally twisted structured spacers for RED.6 This spacer had 83% open area but thickness over 200 μm. Consequently, the net power density achieved was less than 0.8 W m−2. In contrast, the pressure drop in our developed RED stack with a high-open-area spacer was less than 100 kPa, which was lower than that in previous studies. Furthermore, the high-open-area spacer conserved more gross power density without energy loss. Finally, increasing the effective area of the IEMs affected the current density. As shown in Fig. 2, the current density on the peak power density in each experiment increased with the open area. Upon reducing the shadow effect, the redox couples in the electrode solution had more opportunity for the redox reaction on the enlarged active area. Therefore, the current density increased.
The internal resistance comprises the ohmic resistance (Rohmic), boundary layer resistance (RBL), and bulk layer resistance (RΔc) (eqn (1)).5 The ohmic resistance can be predicted from the stack design and material properties using eqn (2).20,21 In contrast, the boundary layer resistance and bulk layer resistance are non-ohmic resistances. The bulk layer resistance, which is induced by the concentration change, can be estimated using eqn (3). The boundary layer resistance was estimated as the remainder of the internal resistance component in eqn (1).5,10 The low internal resistance of the RED stack afforded high gross power density.22
| Ri = Rohmic + RΔc + RBL | (1) |
| Rohmic = N/A(RAEM + RCEM + dc/κc + dd/κd) | (2) |
| RΔc = (αRT)/(FJ)ln(Δad/Δac) | (3) |
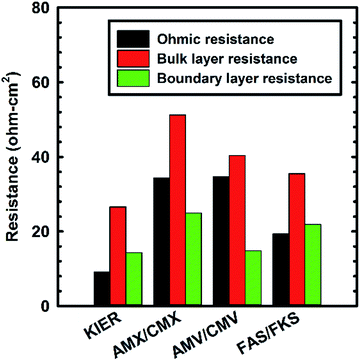
Fig. 3 shows the contribution of the internal resistances of the RED stacks with respect to the membrane compositions. The lab-made IEMs showed lower internal resistance than the commercial IEMs. In particular, their ohmic resistance was 1.5 times lower than that of the FAS/FKS combination, which has the lowest electrical resistance in commercial membranes. Furthermore, the bulk layer resistance was 1.3 times lower than that of FAS/FKS. These results indicated that lab-made IEMs transported more target ions from high-concentration compartments to low-concentration compartments in a given time. Therefore, the electrical conductivity of the low concentration compartments increased and the bulk layer resistance decreased. Generally, the swelling of dry IEMs was enhanced by increasing the IEC, and the water volume fraction within the IEMs had a trade-off relationship with the internal resistance.23 However, this was not the case with the RED stack with pore-filling membranes. Although the lab-made IEMs had comparable IECs to the commercial IEMs, they did not have sufficient volume for water uptake because the pore-filling membrane showed less volume change with swelling. Therefore, water should penetrate the free volume within the fixed functional groups. Eventually, lab-made IEMs conserved their high fixed charge density after swelling and short ion transfer pathways within the structure.
The IEM thickness is an important parameter influencing the ohmic resistance of the RED stack. The IEM's ohmic resistance decreased with its thickness.11 Lab-made IEMs, especially the inner IEMs used in the present study, had around 5 times lower electrical resistance than FAS/FKS, which are homogeneous IEMs. Fast ion transfer through the lab-made IEMs resulted in low boundary layer resistance, and the specific spacers allowed for a greater possibility of ion-membrane contact. With the synergetic effects of lab-made IEMs and spacers, the internal resistance of RED stacks decreased remarkably.
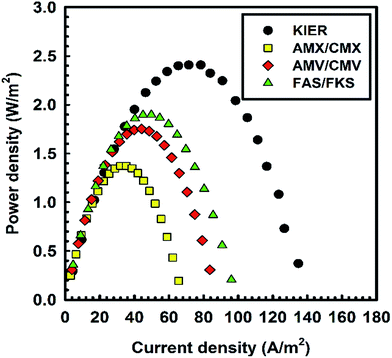
Fig. 4 shows the gross power density (Pgross) of the RED stack with respect to the IEMs. Generally, power is a function of current and external resistance (eqn (4)). According to Kirchhoff's law, the current was substituted as V0/(Ri + Ru). Then, the highest gross power density can be expected when the stack resistance is equal to the external resistance according to eqn (4).5,13,24 In the present study, we achieved a gross power density of 2.4 W m−2. This was higher than that achieved in previous studies that used commercial or tailor-made IEMs.2,5 In the same RED cell, lab-made IEMs showed 1.4 times higher gross power density than an RED stack with AMV/CMV and 1.3 times higher gross power density than an RED stack with FAS/FKS. The current density was also increased by decreasing the internal resistance of the RED stack. Although the non-ohmic resistance largely contributed to the internal resistance of the RED stack, it was also induced by the physicochemical properties of the IEM, especially the thickness with a fixed charge density.11 Therefore, the most important IEM parameter for a RED stack is the thickness; the thickness with a reasonably high fixed charge density directly influences the ohmic resistance, which, in turn, influences the ion transport.
| P = I2Ru = (V02Ru)/(Ri + Ru)2 | (4) |
| Pgross = (OCV2)/(4RiNm) | (5) |
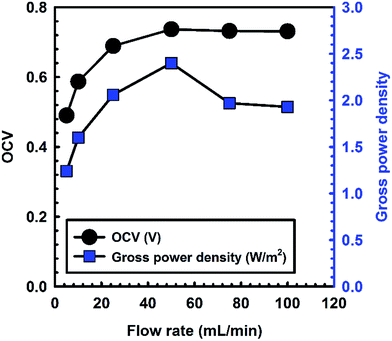
Fig. 5 shows the effect of flow rates of seawater and river water on the OCV and gross power density. The OCV and gross power density increased with the flow rate until a flow rate of 50 mL min−1. When the flow rate exceeded the optimum value, the OCV and gross power density decreased relative to the maximum. These results are similar to previous studies with or without spacers.3,10 When the flow rate was 50 mL min−1, the experimental OCV value was 92.4% compared to the theoretical value. However, the experimental OCV was 61.4% compared to the theoretical value at a flow rate of 5 mL min−1. This is because of the concentration polarization in the vicinity of membranes and at low flow rates.10 As the flow rate increased until the optimum value, the concentration polarization would decrease, resulting in low boundary layer resistance. Therefore, the internal resistance of the RED stack decreased, as shown in Fig. S1.† However, when the flow rate exceeded the optimum value, the internal resistance increased and the gross power density decreased because of the increase in the bulk layer resistance of the low-concentration compartment. Although the OCV was similar to the maximum, the ion concentration in the low-concentration compartment would decrease because of the high flow rate of the feed solution in the RED stack. Therefore, the gross power density decreased when the flow rates exceeded the optimum value. These results indicate that the flow rate is an important factor for controlling the internal resistance of the RED stack.
Conclusions
In the present study, lab-made pore-filling membranes and a specific spacer were used in an RED stack to increase the gross power density. The ultrathin lab-made IEMs showed extremely low membrane resistances, inducing fast ion transport through the IEMs. The specific spacer developed for RED had an 81.3% open area. Consequently, the RED stack's current density increased, and the gross power density reached up to 2.4 W m−2 at optimum flow rates of feed solutions.Acknowledgements
This work was supported by the New & Renewable Energy Core Technology Program of the Korea Institute of Energy Technology Evaluation and Planning (KETEP), which was granted financial resources from the Ministry of Trade, Industry & Energy, Republic of Korea (20143030071240), and by the framework of the Research and Development Program of the Korea Institute of Energy Research (KIER) (B5-2481).Notes and references
- O. Levenspiel and N. de Nevers, Science, 1974, 183, 157–160 CAS.
- E. Güler, Y. Zhang, M. Saakes and K. Nijmeijer, ChemSusChem, 2012, 5, 2262–2270 CrossRef PubMed.
- P. Długołęcki, A. Gambier, K. Nijmeijer and M. Wessling, Environ. Sci. Technol., 2009, 43, 6888–6894 CrossRef.
- J. Veerman, M. Saakes, S. J. Metz and G. J. Harmsen, Environ. Sci. Technol., 2010, 44, 9207–9212 CrossRef CAS PubMed.
- D. A. Vermaas, M. Saakes and K. Nijmeijer, Environ. Sci. Technol., 2011, 45, 7089–7095 CrossRef CAS PubMed.
- D. A. Vermaas, M. Saakes and K. Nijmeijer, J. Membr. Sci., 2014, 453, 312–319 CrossRef CAS PubMed.
- K. Zhang, M. Wang and C. Gao, J. Membr. Sci., 2012, 387–388, 48–53 CrossRef CAS PubMed.
- J. Balster, D. F. Stamatialis and M. Wessling, J. Membr. Sci., 2010, 360, 185–189 CrossRef CAS PubMed.
- E. Güler, R. Elizen, M. Saakes and K. Nijmeijer, J. Membr. Sci., 2014, 458, 136–148 CrossRef PubMed.
- D. A. Vermaas, M. Saakes and K. Nijmeijer, J. Membr. Sci., 2011, 385–386, 234–242 CrossRef PubMed.
- E. Güler, R. Elizen, D. A. Vermaas, M. Saakes and K. Nijmeijer, J. Membr. Sci., 2013, 446, 266–276 CrossRef PubMed.
- J. Veerman, R. M. de Jong, M. Saakes, S. J. Metz and G. J. Harmsen, J. Membr. Sci., 2009, 343, 7–15 CrossRef CAS PubMed.
- P. Długołęcki, K. Nymeijer, S. Metz and M. Wessling, J. Membr. Sci., 2008, 319, 214–222 CrossRef PubMed.
- T. Yamaguchi, F. Miyata and S. Nakao, Adv. Mater., 2003, 15, 1198–1201 CrossRef CAS PubMed.
- M.-S. Lee, T. Kim, S.-H. Park, C.-S. Kim and Y.-W. Choi, J. Mater. Chem., 2012, 22, 13928–13931 RSC.
- H. Kang, M.-S. Lee, W.-J. Sim, T.-H. Yang, K.-H. Shin, Y.-G. Shul and Y.-W. Choi, J. Membr. Sci., 2014, 460, 178184 CrossRef PubMed.
- J. W. Post, J. Veerman, H. V. M. Hamelers, G. J. W. Euverink, S. J. Metz, K. Nymeijer and C. J. N. Buisman, J. Membr. Sci., 2007, 288, 218–230 CrossRef CAS PubMed.
- F. G. Wilhelm, I. Pünt and N. van der Vegt, J. Membr. Sci., 2002, 199, 167–176 CrossRef CAS.
- P. Długołęcki, B. Anet, S. J. Metz, K. Nijmeijer and M. Wessling, J. Membr. Sci., 2010, 346, 163–171 CrossRef PubMed.
- J. W. Post, H. V. M. Hamelers and C. J. N. Buisman, Environ. Sci. Technol., 2008, 42, 5785–5790 CrossRef CAS.
- Z. Jia, B. Wang, S. Song and Y. Fan, Renewable Sustainable Energy Rev., 2014, 31, 91–100 CrossRef PubMed.
- S. Pawlowski, P. Sistat, J. G. Crespo and S. Velizarov, J. Membr. Sci., 2014, 471, 72–83 CrossRef CAS PubMed.
- G. M. Geise, M. A. Hickner and B. E. Logan, ACS Appl. Mater. Interfaces, 2013, 5, 10294–10301 CAS.
- A. Daniilidis, D. A. Vermaas, R. Herber and K. Nijmeijer, Renewable Energy, 2014, 64, 123–131 CrossRef CAS PubMed.
Footnotes |
| † Electronic supplementary information (ESI) available. See DOI: 10.1039/c5ta03571f |
| ‡ These authors contributed equally to the present paper. |
| This journal is © The Royal Society of Chemistry 2015 |

