 Open Access Article
A gamma fluorinated ether as an additive for enhanced oxygen activity in Li–O2 batteries†
Olivia
Wijaya
a,
Pascal
Hartmann
b,
Reza
Younesi
c,
Iulius I. E.
Markovits
d,
Ali
Rinaldi
a,
Jürgen
Janek
b and
Rachid
Yazami
*d
aTUM CREATE, 1 CREATE Way, #10-02, Singapore 138602
bInstitute of Physical Chemistry, Justus-Liebig-Universität Gießen, Heinrich-Buff-Ring 58, 35392 Gießen, Germany
cDepartment of Chemistry-Ångström Laboratory, Uppsala University, Box 538, SE-751 21 Uppsala, Sweden
dEnergy Research Institute at Nanyang Technological University, 1 CleanTech Loop, #06-04 CleanTech One, Singapore 637141. E-mail: rachid@pmail.ntu.edu.sg
First published on 25th August 2015
Abstract
Perfluorocarbons (PFCs) are known for their high O2 solubility and have been investigated as additives in Li–O2 cells to enhance the cathode performance. However, the immiscibility of PFCs with organic solvents remains the main issue to be addressed as it hinders PFC practical application in Li–O2 cells. Furthermore, the effect of PFC additives on the O2 mass transport properties in the catholyte and their stability has not been thoroughly investigated. In this study, we investigated the properties of 1,1,1,2,2,3,3,4,4-nonafluoro-6-propoxyhexane (TE4), a gamma fluorinated ether, and found it to be miscible with tetraglyme (TEGDME), a solvent commonly used in Li–O2 cells. The results show that with the TE4 additive up to 4 times higher O2 solubility and up to 2 times higher O2 diffusibility can be achieved. With 20 vol% TE4 addition, the discharge capacity increased about 10 times at a high discharge rate of 400 mA gC−1, corresponding to about 0.4 mA cm−2. The chemical stability of TE4 after Li–O2 cell discharge is investigated using 1H and 19F NMR, and the TE4 signal is retained after discharge. FTIR and XPS measurements indicate the presence of Li2O2 as a discharged product, together with side products from the parasitic reactions of LiTFSI salt and TEGDME.
Introduction
A high O2 solubility in the catholyte is a desirable property in Li–O2 batteries since the cathode reaction consists of O2 reduction to form Li2O2.1–5 In fact, Read et al. found that the discharge capacity of Li–O2 cells increased with the O2 partial pressure and with the Bunsen coefficient (cm3 O2 per cm3 solution) of the catholyte.6,7 Optimized partial filling of cathode pores with a liquid electrolyte also will improve the discharge kinetics.8PFCs are used in various biological applications, including in artificial blood due to their high O2 solubility.9–11 Therefore, PFCs are attractive candidates as additives to increase the O2 activity in the catholyte of a Li–O2 battery. In fact, perfluoroheptane dissolves about 5.6 times more O2 than tetraglyme (TEGDME), a common solvent in Li–O2 batteries. TEGDME shows good stability with Li metal and a wide electrochemical stability window.12–14 The O2 solubility in perfluoroheptane was measured by Tominaga et al.15 from the O2 solubility given as a mole fraction (xO2), and they reported xO2 = 55.5 × 10⁻⁴, which corresponds to a Bunsen coefficient of α = 0.553. Read et al.16 found a lower Bunsen coefficient of α = 0.0993 in TEGDME.
The beneficial effect of PFC additives on metal–O2 battery cell performance enhancement has been reported in the literature. In pioneering work submitted to a US patent, Yazami showed an increase of the open-circuit voltage in cells with PFC additives in aqueous electrolytes.17 This increase necessarily means that the fluorocarbon additive influences the cell reaction. Later, Balaish et al.1,18 and Zhang et al.2 reported an increase in the discharge capacity of Li–O2 battery cells with PFC and partially fluorinated compound additives, respectively. Further, Wang et al. found an increase in the current density during O2 reduction by dispersing perfluorotributylamine in propylene carbonate solvent.4 A recent study by Nishikami et al.5 showed around 1.5 times capacity increase when dissolving 60 wt% perfluorohexyl bromide with lithium perfluorooctane sulfonate in tetraglyme. We also reported an enhanced current and discharge capacity with 1-methoxyheptafluoropropane additive in DME and TEGDME based battery electrolytes with a rotating ring disk electrode (RRDE) and a Li–O2 cell.3
The limited miscibility of PFCs in organic solvents is one of the main issues in Li–O2 cell application. One proposed strategy to overcome this issue is a dispersion of the liquid medium.4 However, this approach does not meet the long term stability requirement of the two-phase liquid/liquid dispersion. The other strategy we have pursued is to use PFCs with a lower degree of fluorination as they may provide a good tradeoff between solubility in ethers and O2 dissolution capability.3
Another important requirement for PFC additives is good chemical stability in the Li–O2 cell environment. In fact, superoxide radicals are reported to form in the course of O2 reduction and should account for the instability of solvents commonly used in Li–O2 batteries, including carbonates and glymes.19–26 Recently, we reported on the plausible instability of 1-methoxyheptafluoropropane by using a RRDE and cyclic voltammetry.3
In this work, we investigated a gamma-fluorinated ether, 1,1,1,2,2,3,3,4,4-nonafluoro-6-propoxyhexane (TE4) (Fig. 1), as an additive in Li–O2 batteries. This compound is expected to have greater stability toward the superoxide radicals compared to 1-methoxyheptafluoropropane (an alpha-fluorinated ether) as predicted by the DFT calculation.27 The O2 solubility of this compound is also expected to be high (47.76 cm3/100 ml) by the calculation developed by Lawson et al.28 Furthermore, TE4 is miscible with TEGDME and lithium up to a considerable amount (∼20 vol%). Therefore, the issue of dispersion instability and appropriate surfactant could be avoided. The O2 uptake in pure TE4 and TE4 solutions in tetraglyme of various concentrations is measured here. We show the beneficial effects of the TE4 additive on the discharge capacity and on the rate capability in Li–O2 cells. The stability of the TE4 upon discharge is investigated using NMR spectroscopy. The discharged products are investigated using XPS and FTIR spectroscopy.
Experimental section
Electrolyte preparation
TEGDME was purchased from Sigma-Aldrich and distilled prior to use to remove impurities. The solvent is further dried over 3 Å molecular sieves. 99.5% LiTFSI from Solvay was dried at 60 °C under 10–3 mbar vacuum for 3 days. 1,1,1,2,2,3,3,4,4-Nonafluoro-6-propoxyhexane (HFE-TE4-O-C3), >99%, (TA4) was obtained from Fluoryx Inc. Its structure is presented in Fig. 1. TE4 is dried over 3 Å molecular sieves in an argon filled glovebox. The electrolyte mixture is prepared inside the argon glovebox with <1 ppm H2O and O2. The electrolyte water content is analyzed by the Karl Fischer titration technique and it is found to be below 20 ppm. The ionic conductivity was measured using a conductivity meter CyberScan Series 600 from Eutech Instruments and found to be 0.6 mS cm−1 for 0.1 M LiTFSI:TEGDME. The ionic conductivity of the electrolytes with the TE4 additive does not differ significantly. The viscosity of TEGDME is 4.05 cP.29Cathode fabrication and cell assembly
The cathodes were prepared by coating a slurry of graphitized carbon black (Sigma-Aldrich) (80 wt%) with a PTFE binder (Sigma-Aldrich) (20 wt%) onto a Celgard 2320 separator. The slurry was prepared by sonicating (Hielscher, UP200S) the carbon and binder in isopropanol for 5 minutes followed by stirring for 30 minutes using a Heidolph Silent Crusher homogenizer at a high speed of 10![[thin space (1/6-em)]](https://www.rsc.org/images/entities/char_2009.gif) 000 rpm. A 14 mm cathode disk was cut and dried at 90 °C for 12 hours before being transferred to the glovebox. Stainless steel mesh was utilized as the current collector. The cathodes are 1.5–1.6 mg in weight, ∼10 μm in thickness and with a carbon loading of 0.97–1.03 mg cm−2. Cells were assembled in an Ar filled glovebox (O2 < 1 ppm, H2O < 1 ppm). An additional Celgard separator is placed between the carbon cathode and the lithium metal anode. The discharge experiments were conducted in ECC-Air laboratory cells produced by EL-Cell GmbH30 with a Kel-F O-ring to avoid water permeation into the cell.31 O2 was introduced into the cell with a stainless steel tubing for one hour at 0.5 ml min−1 prior to discharge; the cells were discharged using an Arbin Battery Tester.
000 rpm. A 14 mm cathode disk was cut and dried at 90 °C for 12 hours before being transferred to the glovebox. Stainless steel mesh was utilized as the current collector. The cathodes are 1.5–1.6 mg in weight, ∼10 μm in thickness and with a carbon loading of 0.97–1.03 mg cm−2. Cells were assembled in an Ar filled glovebox (O2 < 1 ppm, H2O < 1 ppm). An additional Celgard separator is placed between the carbon cathode and the lithium metal anode. The discharge experiments were conducted in ECC-Air laboratory cells produced by EL-Cell GmbH30 with a Kel-F O-ring to avoid water permeation into the cell.31 O2 was introduced into the cell with a stainless steel tubing for one hour at 0.5 ml min−1 prior to discharge; the cells were discharged using an Arbin Battery Tester.
Physical characterization
1H and 19F NMR spectra of the catholyte were recorded before and after discharge to investigate the stability of the additive. The 1H NMR spectra were measured in CDCl3 on an Avance I 400 MHz NMR spectrometer. For the 19F NMR spectra, the sample was prepared in DMSO-d6 and measured on an Avance 300 MHz NMR spectrometer. XPS measurements were performed on a PHI 5500 spectrometer (Perkin Elmer Physical Electronics) using monochromatized Al-Kα radiation (1487 eV) and an electron emission angle of 45°. The probing area was approximately 2 × 4 mm2. All spectra were energy calibrated by using the C–C peak of carbon black at a binding energy of 284.5 eV. The samples were washed with DME to remove the remaining electrolyte solvent and salt. FTIR measurements were performed using a frontier from Perkin Elmer in the reflectance mode using EasiDiffTM accessories. The spectra were transformed using the Kubelka–Munk equation to compensate the differences with the standard spectra. The discharged cathode was washed with DME and mixed with vacuum dried KBr inside the glovebox to avoid any reaction during sample preparation.O2 uptake measurements
The O2 uptake measurements were performed using a cross fitting setup equipped with a PAA-33X absolute pressure sensor (Omega), an O2 reservoir, and a vacuum pump. 5 ml of the electrolyte mixture was placed in a glass flask and degassed by exposing it to vacuum. The details of the setup and experimental procedure can be found in ref. 32. The determination of the Henry constant was done by increasing the O2 partial pressure repeatedly and measuring the pressure drop due to O2 uptake. The diffusion coefficient was measured by using convection free O2 absorption in thin liquid films, and the data were analyzed by using a 1D diffusion model reported by Hou et al.33 The pressure decay profile was recorded until a steady state plateau was obtained.Result and discussion
O2 concentration and diffusion coefficient measurements
Fig. 2 shows the molar concentration of O2 in the TEGDME solvent with varying TE4 additive contents as a function of pressure at room temperature. The Henry constant (HO2) is determined by the linear fit of this plot as in eqn (1). The diffusion of O2 (DO2) is measured for the TEGDME solvent, TEGDME with 20 vol% TE4, and pure TE4 additive. The O2 diffusion profile and the equation model for the fitting can be found in S1.† The results for O2 concentration and diffusion are summarized in Table 1.| CO2 = HO2 × PO2 | (1) |
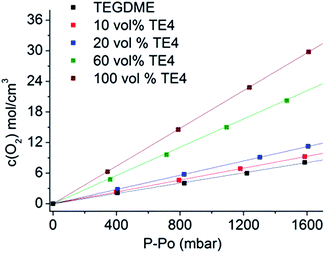 | ||
| Fig. 2 O2 concentration for various TE4 additive concentrations in the TEGDME solvent as a function of O2 pressure. The Henry constant is determined by the linear fit. | ||
| Solvents | [TE4] (M) | Density (g cm−3) | H O2 (mol m−3 bar−1) | D O2/10−5 (cm2 s−1) |
|---|---|---|---|---|
| TEGDME | 0 | 1.003 | 4.8 ± 0.2 | 2.60 ± 0.03 |
| TEGDME + 10 vol% TE4 | 0.43 | 1.032 | 5.8 ± 0.2 | — |
| TEGDME + 20 vol% TE4 | 0.86 | 1.180 | 7.0 ± 0.2 | 2.62 ± 0.06 |
| TEGDME + 60 vol% TE4 | 2.57 | 1.263 | 14.2 ± 0.4 | — |
| TE4 | — | 1.313 | 18.6 ± 0.6 | 5.10 ± 0.06 |
The data clearly show that the pure TE4 additive has about a four times higher Henry constant HO2 compared to pure TEGDME. Addition of 10 vol%, 20 vol%, and 60 vol% TE4 increases HO2 by factors of 1.2, 1.5, and 3, respectively, compared to TEGDME alone. HO2 increases linearly with the TE4 concentration (Fig. S2†). Moreover, the DO2 in the pure TE4 additive is about 2 times higher than that in the TEGDME solvent. However, surprisingly, the DO2 in the 20 vol% TE4 additive remains unchanged compared to pure TEGDME. The addition of LiTFSI, especially at a low concentration of 0.1 M, will not change HO2 significantly, as evidenced from our previous results.32,34
We calculated the O2 solubility based on the fluorocarbon chemical structure by using the method developed by Lawson et al.28 and compared it with our experimental result. The O2 solubility (cm3/100 ml of liquid) at 25 °C was found to be of 47.76, which is close to our result of 45.45 ± 0.15. The details of the calculation can be found in S3.†
The main motivation for incorporating fluorinated additives into the metal–O2 battery is the enhancement of O2 concentration and mass transport. However, most of the previous studies either did not quantify the increase in O2 concentration and diffusion coefficient nor did they quantify them beyond using electrochemical techniques such as Rotating Ring Disk Electrodes (RRDEs).3,4 The rotating ring disk electrode has several limitations such as salt precipitation at high fluorocarbon concentration, high volume of sample, and also problematic data interpretation due to the probability of electrolyte/additive instability in the O2 environment. Therefore, we used pressure dynamic measurements to quantify O2 concentration and the diffusion of the fluorocarbon additive. This approach requires a relatively low amount of sample and provides clear data interpretation since only O2 gas is utilized for the measurements.32
Discharge at various rates
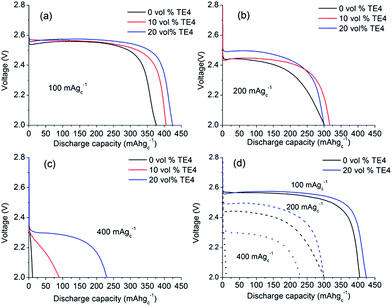
The maximum amount of miscible TE4 in 0.1 M LiTFSI:TEGDME is 20 vol% (0.86 M). Above 20 vol% TE4 concentration, LiTFSI will precipitate. Electrolyte mixtures with different TE4 additive concentrations (0–20 vol%) were therefore tested during discharge at various rates.Fig. 3a shows that at 100 mA gC−1 (about 0.1 mA cm−2), the Li–O2 cell with 0.1 M LiTFSI:TEGDME electrolyte yields 375 mA h gC−1 capacity with a voltage plateau of ∼2.55 V. The capacity increases by ∼25 mA h gC−1 and ∼50 mA h gC−1 by adding 10 vol% and 20 vol% TE4, respectively. However, there is no unequivocal change in discharge voltage observed.
Fig. 3b shows the discharge profile at 200 mA gC−1 (about 0.2 mA cm−2) current rate. The discharge capacity of the cell with 0.1 M LiTFSI:TEGDME electrolyte decreases to 300 mA h gC−1 and the discharge voltage decreases to 2.42 V. However, the discharge voltage increased to ∼70 mV with the 20 vol% TE4 additive as compared to the TE4 free electrolyte. Fig. 3c displays the discharge profile at a high current rate of 400 mA gC−1 (about 0.4 mA cm−2). The TE4 free cell yielded a low capacity of 25 mA h gC−1. The latter increased to 90 mA h gC−1 and 225 mA h gC−1 in electrolytes with 10 vol% and 20 vol% TE4, which is about 3.5 times and about 10 times higher, respectively.
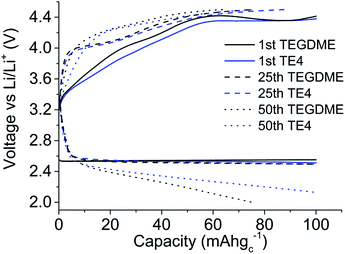
The effect of the TE4 additive is more paramount at a high discharge rate, where the O2 supply is critical. Our improved discharge performance data are in agreement with those of Read et al. owing to the enhanced O2 solubility.2 Read et al. used PC as a solvent2 which is unstable under O2 reduction and did not address the stability issue of the PFC additive.35 In this work, the TEGDME is used due to its higher stability toward superoxides compared to PC.36 As discussed in the next section, TE4 is relatively stable towards oxidation, which results in good performance during the first discharge in the Li–O2 battery. Fig. 4 shows the cycle performance of the Li–O2 cell with 0.1 M LiTFSI:TEGDME with and without the addition of the TE4 additive. We found out that the cell with the TE4 additive has a longer cycle life than that with the TEGDME only additive. At the 50th cycle, the cell with the TE4 additive can still be discharged up to 100 mA h gC−1 while the cell without the additive can only be discharged up to 76 mA h gC−1. The charge voltage is also consistently slightly lower for the cell with the TE4 additive. Nevertheless, the exact mechanism of discharge and charge for the cell with and without the TE4 additive is beyond the scope of this work.
Stability of the TE4 additive
The chemical stability of the fluorocarbon additive in Li–O2 cells has not been investigated although it is a pre-requisite for battery application.In this section, we will first evaluate the electrochemical window of the electrolyte with the TE4 additive in an argon environment. Subsequently, the stability of the TE4 additive is evaluated using 1H NMR and 19F NMR for the electrolyte before and after discharge.
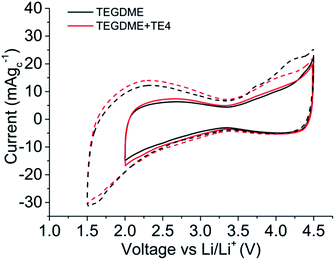
Fig. 5 shows the cyclic voltammogram (CV) in argon for the cell with and without the TE4 additive in the electrolyte at 1 mV s−1 from 2.8 V to a lower potential of 2 V or 1.5 V and then to 4.5 V. The CV profiles of cells with the TE4 additive coincide with the CV profile of the cell with only 0.1 M LiTFSI:TEGDME within 2–4.5 V and 1.5–4.5 V. There is no additional reduction or oxidation peak observed. This signifies that the TE4 additive is electrochemically stable within the above mentioned voltage range. This is especially important since we tested the Li–O2 cell within 2–4.5 V. The 1H and 19F NMR spectra recorded on pure TE4 are in agreement with the literature (the description of the spectra can be found in S6†). As shown in Fig. 6, the 1H NMR spectra after discharge is quasi-identical to the pure TE4 one, denoting a high stability. This is further evidenced by 19F-NMR data displayed in Fig. 7.
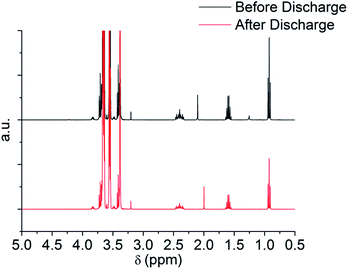 | ||
| Fig. 6 1H NMR before and after discharge at 100 mA gC−1 to 2 V of 0.1 M LiTFSI:TEGDME + 20 vol% TE4. | ||
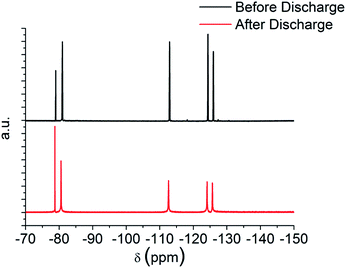 | ||
| Fig. 7 19F NMR before and after discharge at 100 mA gC−1 to 2 V of 0.1 M LiTFSI:TEGDME + 20 vol% TE4. | ||
All signals can be assigned to TE4 with the exception of the one at δ = −78.93 ppm corresponding to LiTFSI.37 However, the integral peak ratio of CF3 (−80.94 ppm)![[thin space (1/6-em)]](https://www.rsc.org/images/entities/char_2009.gif) :
:![[thin space (1/6-em)]](https://www.rsc.org/images/entities/char_2009.gif) LiTFSI (−78.93 ppm) increased after discharge from 1
LiTFSI (−78.93 ppm) increased after discharge from 1![[thin space (1/6-em)]](https://www.rsc.org/images/entities/char_2009.gif) :
:![[thin space (1/6-em)]](https://www.rsc.org/images/entities/char_2009.gif) 0.2 to 1
0.2 to 1![[thin space (1/6-em)]](https://www.rsc.org/images/entities/char_2009.gif) :
:![[thin space (1/6-em)]](https://www.rsc.org/images/entities/char_2009.gif) 0.3. Therefore, TE4 shows considerably higher stability during O2 reduction when compared to the 1-methoxyheptafluropropane additive we reported on.3 In fact, the 1H and 19F signals from 1-methoxyheptafluoropropane completely disappeared after discharge (S4 and S5†) as a sign of instability.
0.3. Therefore, TE4 shows considerably higher stability during O2 reduction when compared to the 1-methoxyheptafluropropane additive we reported on.3 In fact, the 1H and 19F signals from 1-methoxyheptafluoropropane completely disappeared after discharge (S4 and S5†) as a sign of instability.
The increased stability is attributed to the synergistic effect of the two alkyl chains besides the ether group in TE4. Theoretical calculations have shown that with fluorination a decreased susceptibility of the CF2–O towards an attack by O2− is expected. However, the fluorination leads to a decreased reaction barrier for an attack to the neighboring bond, i.e. CH3–O for 1-methoxyheptafluroropropane and therefore an increased instability in the presence of superoxides.20 The ethylene bridge in TE4 prevents this destabilization by balancing the electron deficiency created by the fluorinated alkyl group and helps prevent an attack by the superoxide anion radical on the CH2–O group. Additionally, this effect is supported by the n-propoxy group of the TE4 additive compared to the smaller methyl group.27
Discharge product characterization
FTIR and XPS were used to reveal the nature of the discharged product formed. Fig. 8 shows the IR spectra of the discharged cathode. The signal at 400–700 cm−1 indicates the presence of Li2O2, together with side products such as Li2CO3 at 1392–1570 cm−1. There is no strong indication that LiOH is present as the discharge product. The presence of a C–F signal at 1263–1141 cm−1 indicates that the PTFE binder utilized is stable during discharge in Li–O2. Upon exposure to air for 15 minutes (Fig. S7†), the IR signal in the 1392–1570 cm−1 region and 869 cm−1 increases, indicating the presence of a discharged product that is unstable in air, likely to be Li2O2. To further confirm the chemistry of the discharged product, XPS analysis was done on the discharged cathode with and without the TE4 additive. Fig. 9 shows the XPS core level spectra of the pristine cathode and discharged cathodes with and without the TE4 additive. The O1s spectra of both discharged samples indicate the formation of Li2O2 at a binding energy of 531.5 eV, as well as, side products such as –CO3, C![[double bond, length as m-dash]](https://www.rsc.org/images/entities/char_e001.gif) O, C–O, and O–F containing compounds at binding energies of 532.1, 533.5, and 534.3 eV, respectively.38,39 C1s, F1s, and Li1s spectra confirm the formation of such compounds, and in addition, F1s spectra show the formation of LiF on the discharged cathodes.
O, C–O, and O–F containing compounds at binding energies of 532.1, 533.5, and 534.3 eV, respectively.38,39 C1s, F1s, and Li1s spectra confirm the formation of such compounds, and in addition, F1s spectra show the formation of LiF on the discharged cathodes.
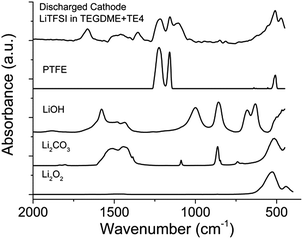 | ||
| Fig. 8 FTIR spectra of the cathode discharged using 0.1 M LiTFSI:TEGDME + 20 vol% TE4 electrolyte at 100 mA gC−1. Comparison of LiOH, Li2CO3, Li2O2 and PTFE FTIR spectra is provided. | ||
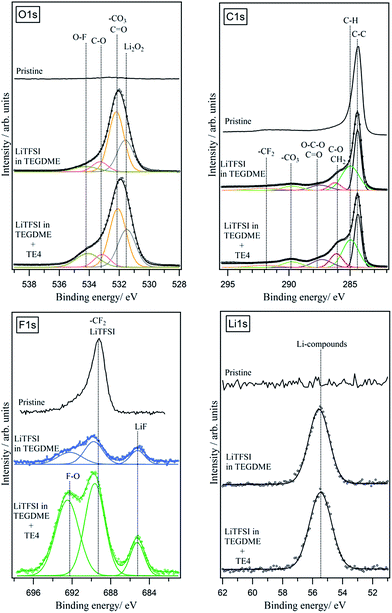 | ||
| Fig. 9 XPS O1s, C1s, F1s, and Li1s spectra of pristine and discharged cathodes with and without the TE4 additive. The cathode was discharged at 100 mA gC−1. | ||
The presence of a peak with a very high binding energy at above 534 eV in the O1s spectra suggests that O is bonded to highly electronegative elements such as F. This consequently resulted in the appearance of a peak with a very high binding energy, above 692 eV, in the F1s spectra. F–O containing compounds could, for example, be formed due to the decomposition of LiPF6 resulting in the appearance of a peak at above 534 eV, as reported in different literature studies.40,41 The presence of O–F in compounds at a high binding energy of ∼692 eV in the F1s spectra and at above 534 eV in the O1s spectra has also been reported in the literature, for example, the formation of the Si–O–F bond during the SiO2 etching process.42–44
In order to understand the origin of the O–F signals formed, we deconvoluted and quantified the F1s spectra. The result is shown in Table 2.
| Electrolyte | LiF | CF2 (PTFE) and LiTFSI | F–O |
|---|---|---|---|
| 0.1 M LiTFSI:TEGDME | 25% | 32% | 43% |
| 0.1 M LiTFSI:TEGDME + TE4 | 25% | 35% | 40% |
We found that the quantity of the O–F bond formed in the cathode discharged in the TEGDME electrolyte is similar to the one discharged in the TEGDME + TE4 additive. This indicates that the O–F bond mostly originates from other F-containing compounds such as the LiTFSI salt, in agreement with the literature, showing that LiTFSI decomposed during discharge in Li–O2 batteries.45–49 LiTFSI, similar to the LiPF6, which decomposes to LixPFyOz, may decompose to O and F containing compounds.40,41,50 The XPS results show that the TE4 addition does not result in additional discharge products from the parasitic reaction.
In summary, the spectroscopy data agrees with those of the TE4 additive, a γ-fluorinated ether, which has a good stability in Li–O2 batteries, considerably enhanced compared to an α-fluorinated ether. The 1H and 19F NMR results show that the additive is retained after discharge in the Li–O2 battery and no additional product dissolved in the electrolyte is observed. FTIR and XPS data confirmed the formation of Li2O2 during discharge. Side products such as –CO3, C![[double bond, length as m-dash]](https://www.rsc.org/images/entities/char_e001.gif) O, C–O, and O–F containing compounds and LiF are also detected, most likely from the LiTFSI salt and TEGDME decomposition. The decomposition of LiTFSI is supported by the change of the LiTFSI peak ratio in the 19F NMR result after discharge.
O, C–O, and O–F containing compounds and LiF are also detected, most likely from the LiTFSI salt and TEGDME decomposition. The decomposition of LiTFSI is supported by the change of the LiTFSI peak ratio in the 19F NMR result after discharge.
Conclusions
We showed the effect of the TE4 additive in enhancing the discharge performance of Li–O2 batteries, which confirms the potential of utilizing dissolved fluorocarbon additives in this chemistry. The addition of 20 vol% TE4 resulted in a discharge capacity of 400 mA h gC−1 enhanced by a factor of 10. To the best of our knowledge, this is the first time also that the O2 solubility and diffusion of the TE4 compound are reported.The electrochemical performance improvement is related to enhanced O2 solubility and mass transport in the TEGDME solvent as evidenced by a pressure change measurement technique.
NMR analysis of the electrolyte before and after discharge showed the considerably enhanced TE4 chemical stability against superoxide radical attack during discharge, compared to the previous additive we reported. We also showed that Li2O2 is present after discharge and no additional product is detected from the parasitic reactions with the TE4 additive. These encouraging results are the first step in finding optimized additives especially for higher discharge rates, where not only the stability of such additives is required but also the fast O2 mass transport.
Acknowledgements
This research project is funded by the National Research Foundation Singapore under its Campus for Research Excellence and Technological Enterprise (CREATE) programme. We thank Solvay company for providing LiTFSI salt. P. H. thanks Fonds der Chemischen Industrie (FCI) for a Ph.D. scholarship. J. J. acknowledges support by the Laboratory of Materials Research (LaMa and ElCh).Notes and references
- M. Balaish, A. Kraytsberg and Y. Ein-Eli, ChemElectroChem, 2014, 1, 90 CrossRef CAS
.
- S. S. Zhang and J. Read, J. Power Sources, 2011, 196, 2867 CrossRef CAS
.
-
A. Rinaldi, Y. Wang, K. S. Tan, O. Wijaya and R. Yazami, in Advances in Batteries for Medium and Large-Scale Energy Storage, ed. C. Menictas, M. Skyllas-Kazacos and T. M. Lim, Woodhead Publishing, Cambridge, 1st edn, 2014, pp. 419–430 Search PubMed
.
- Y. Wang, D. Zheng, X. Yang and D. Qu, Energy Environ. Sci., 2011, 4, 3697 CAS
.
- Y. Nishikami, T. Konishi, R. Omoda, Y. Aihara, K. Oyaizu and H. Nishide, J. Mater. Chem. A, 2015, 3, 10845 CAS
.
- S. S. Zhang, K. Xu and J. Read, J. Power Sources, 2011, 196, 3906 CrossRef CAS
.
- J. Read, M. Ervin, W. Behl, J. Wolfenstine, A. Driedger, D. Fostera and K. Mutolo, J. Electrochem. Soc., 2003, 150, A1351 CrossRef CAS
.
- C. Xia, C. L. Bender, B. Bergner, K. Peppler and J. Janek, Electrochem. Commun., 2013, 26, 93 CrossRef CAS
.
- J. G. Riess, Colloids Surf., A, 1994, 84, 33 CrossRef CAS
.
- J. G. Riess, Chem. Rev., 2001, 101, 2797 CrossRef CAS
.
-
M. P. Krafft and J. G. Riess, Chapter 11: Perfluorochemical-Based Oxygen Therapeutics, Contrast Agents, and Beyond, in Fluorine Health, ed. A. Tressaud and G. Haufe, Elsevier, 2008 Search PubMed
.
- J. Lu, L. Li, J.-B. Park, Y.-K. Sun, F. Wu and K. Amine, Chem. Rev., 2014, 114, 5611 CrossRef CAS PubMed
.
- C. O. Laoire, S. Mukerjee, E. J. Plichta, M. A. Hendrickson and K. M. Abraham, J. Electrochem. Soc., 2011, 158, A302 CrossRef CAS
.
- H.-G. Jung, J. Hassoun, J.-B. Park, Y.-K. Sun and B. Scrosati, Nat. Chem., 2012, 4, 579 CrossRef CAS PubMed
.
- R. Battlno, T. R. Rettich and T. Tominaga, J. Phys. Chem. Ref. Data, 1983, 12, 163 CrossRef
.
- J. Read, K. Mutolo, M. Ervin, W. Behl, J. Wolfenstine, A. Driedger and D. Foster, J. Electrochem. Soc., 2003, 150, A1351 CrossRef CAS
.
-
R. Yazami, US Pat., 0266907 A1, 2010
.
- M. Balaish, A. Kraytsberg and Y. Ein-Eli, Phys. Chem. Chem. Phys., 2014, 16, 2801 RSC
.
- B. D. McCloskey, D. S. Bethune, R. M. Shelby, G. Girishkumar and A. C. Luntz, J. Phys. Chem. Lett., 2011, 2, 1161 CrossRef CAS PubMed
.
- V. S. Bryantsev, V. Giordani, W. Walker, M. Blanco, S. Zecevic, K. Sasaki, J. Uddin, D. Addison and G. V. Chase, J. Phys. Chem. A, 2011, 115, 12399 CrossRef CAS PubMed
.
- R. Black, S. Oh, J. Lee and T. Yim, J. Am. Chem. Soc., 2012, 134, 2902 CrossRef CAS PubMed
.
- K. U. Schwenke, S. Meini, X. Wu, H. A. Gasteiger and M. Piana, Phys. Chem. Chem. Phys., 2013, 15, 11830 RSC
.
- K. R. Ryan, L. Trahey, B. J. Ingram and A. K. Burrell, J. Phys. Chem. C, 2012, 116, 19724 CAS
.
- S. A. Freunberger, Y. Chen, N. E. Drewett, L. J. Hardwick, F. Bardé and P. G. Bruce, Angew. Chem., Int. Ed., 2011, 50, 8609 CrossRef CAS PubMed
.
- V. Bryantsev and M. Blanco, J. Phys. Chem. Lett., 2011, 2, 379 CrossRef CAS
.
- S. A. Freunberger, Y. Chen, Z. Peng, J. M. Griffin, L. J. Hardwick, F. Bardé, P. Novák and P. G. Bruce, J. Am. Chem. Soc., 2011, 133, 8040 CrossRef CAS PubMed
.
- V. S. Bryantsev, J. Uddin, V. Giordani, W. Walker, D. Addison and G. V. Chase, J. Electrochem. Soc., 2012, 160, A160 CrossRef
.
- D. D. Lawson, J. Moacanin, K. V. Scherer, T. F. Terranova and J. D. Ingham, J. Fluorine Chem., 1978, 12, 221 CrossRef CAS
.
-
Y. Marcus, Properties of Solvents, Wiley, New York, 1998 Search PubMed
.
- EL-CELL GmbH, http://www.el-cell.com/wp-content/uploads/manuals/ECC_AIR_manual.pdf, accessed online May 2015.
- K. U. Schwenke, M. Metzger, T. Restle, M. Piana and H. A. Gasteiger, J. Electrochem. Soc., 2015, 162, A573 CrossRef CAS
.
- P. Hartmann, D. Grübl, H. Sommer, J. Janek, W. G. Bessler and P. Adelhelm, J. Phys. Chem. C, 2014, 118, 1461 CAS
.
- H. Ying and R. E. Baltus, Ind. Eng. Chem. Res., 2007, 46, 8166 CrossRef
.
- B. J. Bergner, A. Schu, K. Peppler, A. Garsuch and J. Janek, J. Am. Chem. Soc., 2014, 136, 15054 CrossRef CAS PubMed
.
- S. A. Freunberger, Y. Chen, Z. Peng, J. M. Griffin, L. J. Hardwick, F. Bardé, P. Novák and P. G. Bruce, J. Am. Chem. Soc., 2011, 133, 8040 CrossRef CAS PubMed
.
- J. Lu, L. Li, J.-B. Park, Y.-K. Sun, F. Wu and K. Amine, Chem. Rev., 2014, 114, 5611 CrossRef CAS PubMed
.
- N. Madria, T. A. Arunkumar, N. G. Nair, A. Vadapalli, Y. W. Huang, S. C. Jones and V. P. Reddy, J. Power Sources, 2013, 234, 277 CrossRef CAS
.
- R. Younesi, S. Urbonaite, K. Edström and M. Hahlin, J. Phys. Chem. C, 2012, 116, 20673 CAS
.
- R. Younesi, M. Hahlin and K. Edström, ACS Appl. Mater. Interfaces, 2013, 5, 1333 CAS
.
- H. Bryngelsson, M. Stjerndahl, T. Gustafsson and K. Edström, J. Power Sources, 2007, 174, 970 CrossRef CAS
.
- Y. C. Lu, A. N. Mansour, N. Yabuuchi and Y. Shao-Horn, Chem. Mater., 2009, 21, 4408 CrossRef CAS
.
- J. S. Oh, J. B. Park, E. Gil and G. Y. Yeom, J. Phys. D: Appl. Phys., 2010, 43, 425207 CrossRef
.
- H. Park, K. Kwon, J. Lee, K. Suh, O. Kwon, K. Cho, H. Park, K. Kwon, K. Cho, S. Park and O. Kwon, Journal of Applied Physics, 1994, 4596, 4 Search PubMed
.
- Y.-I. K. Hyung-Ho Park, K.-H. Kwon, S.-H. Lee, B.-H. Koak, S. Nahm, H.-T. Lee, K.-I. Cho and O.-J. Kwon, ETRI J., 1994, 16, 45 CrossRef
.
- G. M. Veith, J. Nanda, L. H. Delmau and N. J. Dudney, J. Phys. Chem. Lett., 2012, 3, 1242 CrossRef CAS PubMed
.
- B. D. Mccloskey, A. Valery, A. C. Luntz, S. R. Gowda, G. M. Wallraff, J. M. Garcia, T. Mori and L. E. Krupp, J. Phys. Chem. Lett., 2013, 4, 2989 CrossRef CAS
.
- E. Nasybulin, W. Xu, M. H. Engelhard, Z. Nie, S. D. Burton, L. Cosimbescu, M. E. Gross and J. Zhang, J. Phys. Chem. C, 2013, 117, 2635 CAS
.
- D. Sharon, V. Etacheri, A. Garsuch, M. Afri, A. A. Frimer and D. Aurbach, J. Phys. Chem. Lett., 2013, 4, 127 CrossRef CAS PubMed
.
- R. Younesi, G. M. Veith, P. Johansson, K. Edström and T. Vegge, Energy Environ. Sci., 2015, 1905–1922 CAS
.
- R. A. Quinlan, Y.-C. Lu, Y. Shao-Horn and A. N. Mansour, J. Electrochem. Soc., 2013, 160, A669 CrossRef CAS
.
Footnote |
| † Electronic supplementary information (ESI) available. See DOI: 10.1039/c5ta03439f |
| This journal is © The Royal Society of Chemistry 2015 |


