
 Open Access Article
 This Open Access Article is licensed under a
 Creative Commons Attribution 3.0 Unported Licence
Tailoring the dispersion of multiwall carbon nanotubes in co-continuous PVDF/ABS blends to design materials with enhanced electromagnetic interference shielding
Goutam Prasanna
Kar†
,
Sourav
Biswas†
,
Rani
Rohini
and
Suryasarathi
Bose
 *
*
Department of Materials Engineering, Indian Institute of Science, Bangalore-560012, India. E-mail: sbose@materials.iisc.ernet.in; Tel: +91-80-2293 3407
First published on 3rd March 2015
Abstract
Highly conducting composites were derived by selectively localizing multiwall carbon nanotubes (MWNTs) in co-continuous PVDF/ABS (50/50, wt/wt) blends. The electrical percolation threshold was obtained between 0.5 and 1 wt% MWNTs as manifested by a dramatic increase in the electrical conductivity by about six orders of magnitude with respect to the neat blends. In order to further enhance the electrical conductivity of the blends, the MWNTs were modified with amine terminated ionic liquid (IL), which, besides enhancing the interfacial interaction with PVDF, facilitated the formation of a network like structure of MWNTs. This high electrical conductivity of the blends, at a relatively low fraction (1 wt%), was further explored to design materials that can attenuate electromagnetic (EM) radiation. More specifically, to attenuate the EM radiation by absorption, a ferroelectric phase was introduced. To accomplish this, barium titanate (BT) nanoparticles chemically stitched onto graphene oxide (GO) sheets were synthesized and mixed along with MWNTs in the blends. Intriguingly, the total EM shielding effectiveness (SE) was enhanced by ca. 10 dB with respect to the blends with only MWNTs. In addition, the effect of introducing a ferromagnetic phase (Fe3O4) along with IL modified MWNTs was also investigated. This study opens new avenues in designing materials that can attenuate EM radiation by selecting either a ferroelectric (BT–GO) or a ferromagnetic phase (Fe3O4) along with intrinsically conducting nanoparticles (MWNTs).
Introduction
Blending polymers with different physical properties opens new avenues in designing materials with a unique set of properties. In general, due to the low entropy of mixing,1 most polymer pairs are thermodynamically immiscible. It is generally agreed that specific interactions between the blend components govern their miscibility2–5 and ultimately dictate the properties of the blends. Besides the properties of the component polymers, the overall performance of the blends is largely governed by the morphology thus formed by blending.6,7 Most often, matrix dispersed and co-continuous morphologies are observed by mixing two polymers in different ratios.8 Increasing attention has been paid to co-continuous structures, which offer a unique combination of properties offered by each of the components.9An alternate route to develop materials with tailored properties is by incorporating nanoparticles into the polymer matrix. Polymer nanocomposites have drawn considerable research interest over the past decade in view of their significant improvement in physical, thermal, mechanical and electronic properties of the matrix polymer. In recent years, more focus was laid on designing flexible and lightweight polymer based conducting composites for many electronic applications. Among different nanoparticles, carbon nanotubes (CNTs) attracted a great deal of interest owing to their extraordinary combination of properties.10 The high aspect ratio of CNTs results in a low percolation threshold in polymeric nanocomposites, which makes them ideal candidates for designing and developing conducting composites.9,11,12 However, the key challenge is their efficient dispersion in the matrix polymer and a great deal of research is focused on developing various strategies to render effective dispersion and also to facilitate network-like structures at relatively low concentration in the composites.10 The CNTs tend to agglomerate due to inter-tube van der Waals' interactions leading to a reduced ‘effective aspect ratio’. It is well evident that the electrical conductivity of CNTs largely depends on the ‘π-conjugation’ and their high aspect ratio. In contrast to chemical functionalization of CNTs, the non-covalent approach preserves the integrity of the nanotubes and hence, the electronic properties. It is envisaged that covalent modification of CNTs affects the band gap even at the Fermi level which deteriorates the electrical properties to a significant extent.10 Hence, a great deal of focus is laid on non-covalent modification of CNTs to design materials with high electrical conductivity.
Polymer blends with conducting nanoparticles have drawn considerable interest in the recent past. High electrical conductivity at a relatively low fraction of the nanoparticles in the blends can be achieved by selectively localizing the conducting nanoparticles either in a given phase or at the interface of a co-continuous blend.9,13–17 Such highly conductive materials were further exploited for many applications such as antistatic devices and EMI shielding materials15,16,18
In the recent past, the use of electronic equipment and telecommunication devices has tremendously increased. As a consequence, electromagnetic interference (EMI) and radio frequency interference (RFI) emitted by these electronic devices are quite alarming. The EM radiation emitted by the electronic devices can interfere with the precise circuitry of the nearby devices leading to adverse effects.19–22 In order to avoid serious consequences due to this interference, shielding of the EM radiation in the workspace has become vital. In order to prevent EM pollution, materials that can absorb EM radiation have become extremely important. In this context, metals are the primary choice but they suffer from high processing costs and are prone to corrosion. In this context, polymer based conducting nanocomposites have gained interest owing to their high strength to weight ratio, good processability and structural flexibility.
In recent years homopolymer based composites as EM shielding materials have been widely studied. For instance, Singh et al. showed a SE of 22 dB at 18 GHz for linear density polyethylene (LDPE) based composites with 10 wt% MWNTs.23 The total SE of PP nanocomposites with 7.5 vol% MWNTs where a SE of 35.6 dB at 12 GHz has been reported by Al-Saleh et al.24 In the case of polyurethane (PU) based nanocomposites, Liu et al. showed a total SE of 17 dB for 20 wt% SWNTs.25 Sharma et al. showed that the EMI SE can be enhanced by using ionic liquid modified MWNTs in PVDF composites.26 More recently, the use of blends has gained interest. For instance, Rohini et al. showed a SE of 24 dB at 1 wt% NH2 terminated MWNTs in PS/PMMA blends.15 Pawar et al. showed a SE of 17 dB in PC/SAN blends at 1 wt% NH2 terminated MWNTs and a SE of 32.5 dB for the same blends with 3 wt% Fe3O4-g-MWNTs.18
In this work, various strategies were adopted to attenuate EM radiation. An immiscible pair, PVDF/ABS was selected as the model system and MWNTs were melt blended to design materials with high electrical conductivity. PVDF is an important and widely investigated polymer due to its piezoelectric properties and acrylonitrile butadiene styrene (ABS) is a tert-polymer that finds place in various applications. Recently, the application of ionic liquids (ILs) has shown promising results on structural control of the nanocomposites.27,28 ILs are organic salts with low melting points; often they are liquid at room temperature and present several intrinsic properties, like low volatility, high thermal and chemical stability, insignificant flammability, good thermal conductivity, high ionic mobility and moisture resistance.29,30 The imidazolium-based IL presents these properties together with the strong capacity of interaction with carbon based materials. The ‘π–π stacking’ between the IL and the delocalized ‘π-cloud’ in MWNTs allows IL to act both as a solvent and surfactant due to the IL's amphiphilic nature.31 These features make IL ideal for exfoliating/stabilizing MWNTs, allowing broader experimental conditions, however, volatile organic solvents have the drawback of limited working temperature ranges. In order to improve the dispersion and facilitate network like structures, the MWNTs were modified with ionic liquid in this study. This is also manifested by a significant enhancement in the bulk electrical conductivity of the blends. The materials with high dielectric constant and high dielectric loss can shield EM radiation by absorption. In this regard, ferroelectric materials can be an ideal choice as losses in the ferroelectric phase are caused by electric hysteresis effects. We have synthesized a unique material where graphene oxide (GO) was chemically stitched onto barium titanate (BT) nanoparticles, a high dielectric constant material. A few compositions were prepared where this unique material (BT–GO) was incorporated along with MWNTs to attenuate EM radiation.
As mentioned earlier, high electrical conductivity, high dielectric constant and magnetic permeability are the key factors that govern the efficiency of a shielding material. Hence, a careful selection of materials can help in designing materials with enhanced EMI shielding. In light of this, we adopted a unique strategy where a three phase structure involving either a ferroelectric phase (BT–GO) or a ferromagnetic phase (Fe3O4 nanoparticles) in combination with an intrinsically conducting nanoparticle (MWNTs) was used to design lightweight and flexible polymeric nanocomposites. The phase morphology, selective localization, electrical conductivity and EM shielding effectiveness were assessed here in various PVDF/ABS blends.
Experimental section
Materials
PVDF (Kynar-761, with Mw of 440![[thin space (1/6-em)]](https://www.rsc.org/images/entities/char_2009.gif) 000 g mol−1) was kindly provided by Arkema. ABS (Absolac 120, with a typical composition consisting of acrylonitrile: 24 wt%, rubber content: 16.5 wt% and styrene: 59.5 wt%) was procured from Styrolution. The pristine multiwall carbon nanotubes (p-MWNTs) with an average diameter and a length of 9.5 nm and 1.5 μm, respectively, were procured from Nanocyl SA (Belgium). BaTiO3 (BT, average particle size of 100 nm), Fe3O4 nanoparticles (with an average diameter of 50–100 nm), 1-vinylimidazole, 3-bromopropylaminehydrobromide, 3-aminopropyltriethoxysilane (APTS), H2O2 (30% in water), N,N-dicyclohexylcarbodiimide (DCC), dry toluene, and dry N,N-dimethylformamide were procured from Sigma-Aldrich and were used without any further purification.
000 g mol−1) was kindly provided by Arkema. ABS (Absolac 120, with a typical composition consisting of acrylonitrile: 24 wt%, rubber content: 16.5 wt% and styrene: 59.5 wt%) was procured from Styrolution. The pristine multiwall carbon nanotubes (p-MWNTs) with an average diameter and a length of 9.5 nm and 1.5 μm, respectively, were procured from Nanocyl SA (Belgium). BaTiO3 (BT, average particle size of 100 nm), Fe3O4 nanoparticles (with an average diameter of 50–100 nm), 1-vinylimidazole, 3-bromopropylaminehydrobromide, 3-aminopropyltriethoxysilane (APTS), H2O2 (30% in water), N,N-dicyclohexylcarbodiimide (DCC), dry toluene, and dry N,N-dimethylformamide were procured from Sigma-Aldrich and were used without any further purification.
Synthesis of amine terminated ionic liquid (IL)
In a two-necked round bottomed flask, 1-vinylimidazole (20 ml) and dry ethanol (35 ml) were added and the mixture was stirred under a nitrogen atmosphere. 3-Bromopropylaminehydrobromide (15 g) was then added to the mixture and refluxed under stirring for 24 h. The synthesized amine terminated ionic liquid was then separated by the precipitation technique with the help of ethyl acetate. Finally, ethanol was added followed by overnight vacuum drying.32Preparation of IL modified MWNTs (IL-MWNTs)
MWNTs were modified by the as-synthesized ionic liquid as described in the above section.32 Typically, 100 mg of MWNTs and 600 mg of the as-synthesized ionic liquid were dispersed in 100 ml of DMF and bath sonicated for 2 h. The resultant mixture was then vigorously stirred at room temperature for 10 h and left overnight for ageing. The mixture was filtered and centrifuged to remove the ungrafted IL and finally dried under vacuum at 80 °C.Synthesis of GO
GO was synthesized by mixing graphite flakes in a mixture of concentrated H2SO4 and H3PO4 (9:1 ratio) in a water bath. KMnO4 was then added very slowly as described in our previous work.33 Then the reaction mixture was stirred in a closed reactor for 24 h at room temperature. After completion, the mixture was then poured into deionized (DI) water and stirred for 2 h. 35% hydrogen peroxide (5–10 ml) solution was added dropwise to the solution until the color turns bright yellow. The solution was then filtered. The remaining solid material was then washed in succession with DI water, HCl and ethanol. The solid obtained (GO) on the filter was vacuum-dried at room temperature.
Synthesis of BT–GO
BT nanoparticles were dispersed in H2O2 solution and bath sonicated for 15 min. The mixture was then refluxed at 105 °C for 4 h. The resulting hydroxylated BT nanoparticles (BT–OH) were then centrifuged and washed with water and kept for drying. The dried hydroxylated BT nanoparticles were then mixed with APTS34 followed by refluxing at 80 °C in an inert atmosphere for 24 h. The resulting mixture was then centrifuged and washed several times with toluene and dried under vacuum.35 Thus produced amine functionalized BT nanoparticles (BT–NH2) were reacted with GO in dry toluene and in the presence of DCC. Free amine groups of BT–NH2 react with carboxylic groups of GO forming BT–GO. The amount of GO in the hybrid was maintained as 0.1%. The mixture was centrifuged, washed with toluene and dried under vacuum at 80 °C.Blend preparation
Neat blends of PVDF/ABS (50/50, wt/wt) and with different nanoparticles were prepared using a Haake minilab II under a N2 atmosphere at 230 °C temperature at 60 rpm for 20 minutes. PVDF/ABS blends with p-MWNTs were also prepared under the same extrusion conditions mentioned above. As described above, ionic liquid modified MWNTs were prepared by a method shown in Scheme 1. The modified MWNTs were then mixed with the blends in a two step mixing protocol. In the first step, the modified MWNTs were mixed with PVDF in N,N-dimethylformamide followed by evaporation of the solvent. The obtained PVDF/MWNT composites were subsequently melt mixed with ABS in the second step. The total concentration of MWNTs was fixed at 1 wt% with respect to the total batch size. The extrusion conditions were kept the same as mentioned earlier. Similar protocols were adopted to incorporate Fe3O4 and BT–GO nanoparticles in the blends. Initially, these nanoparticles were mixed with PVDF in N,N-dimethylformamide followed by solvent evaporation. Thus obtained PVDF nanocomposites were mixed with ABS along with the ionic liquid modified MWNTs under the same extrusion conditions described above. In all the cases the samples were pre-dried at 80 °C in a vacuum oven for 24 h prior to processing. Melt mixed samples were subsequently compression molded into specific shapes for different tests at 230 °C using a lab scale hydraulic press.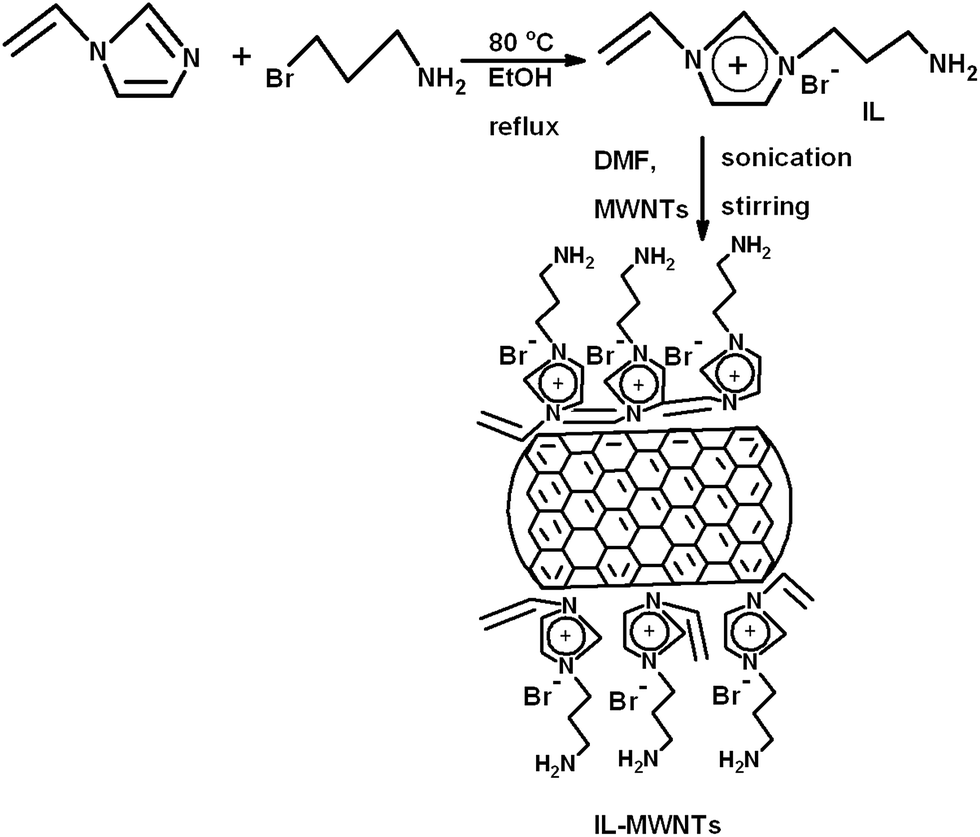 | ||
| Scheme 1 Synthesis of NH2 terminated IL and IL-MWNTs. | ||
Characterization
Fourier transform infrared (FTIR) spectroscopy was carried out using KBr pellets on a Perkin-Elmer GX in the range of 4000−400 cm−1 with a resolution of 4 cm−1.Transmission Electron Microscopy (TEM) images were acquired using a Tecnai G2F30 at 300 kV.
Morphological analysis of various blends was studied using an ULTRA 55 scanning electron microscope (SEM) with an acceleration voltage of 10 kV.
The room temperature electrical conductivity of the blends was studied using an Alpha-N Analyser, Novocontrol (Germany) in the frequency range of 0.1 Hz to 10 MHz. Uniformly polished compression molded disks were used as specimens and the electrical conductivity was measured across the thickness.
In order to study the electromagnetic interference SE in the X and Ku-band frequency range, an Anritsu MS4642A vector network analyzer (VNA) was coupled with a coax (Damaskos M07T) setup. The experimental setup was calibrated by full SOLT for both ports to avoid absorption and reflection losses due to the transmission line and sample holder. Toroidal specimens were compression molded and the S parameters (S11, S12, S22 and S21) were measured in a wide range of frequencies.
Results and discussion
Synthesis and characterization of IL-MWNTs and BT–GO
Fig. 1(a) shows the FT-IR spectra of synthesized IL modified MWNTs. As shown in Scheme 1, amine terminated IL was synthesized by elimination reaction by refluxing under a nitrogen atmosphere for 24 h. The direct evidence of the formation of amine terminated IL and the presence of IL on the surface of MWNTs is provided by FT-IR. The broad peak at 3385 cm−1 corresponding to the N–H stretching clearly indicates the presence of the amine group attached to the IL. The peak at 3127 cm−1 corresponding to the –C![[double bond, length as m-dash]](https://www.rsc.org/images/entities/char_e001.gif) C–H stretching frequency supports the presence of the terminal alkene group. The peak at 2994 cm−1 indicates the C–H stretching of alkanes. The peak at 1619 cm−1 indicates the N–H bending, whereas the peak at 1460 cm−1 indicates the C–H bending frequencies. The peak at 1246 cm−1 indicates the C–N stretching frequency of the aliphatic amines. Further evidence of the grafting comes from the TEM micrograph and is discussed later on. The hydrophilic BT nanoparticles were initially refluxed with H2O2 to introduce the O–H functional groups. The amino-silane coupling agent was then employed to terminate the BT nanoparticles with NH2 functional groups. The NH2 groups can readily react with the carboxyl (CO) groups present on the basal planes of GO (see Scheme 2). The nature of interactions was assessed using FTIR. Fig. 1(b) shows the FTIR spectra of GO and BT–GO nanoparticles. The characteristic peaks of GO such as corresponding to hydroxyl (OH) stretching at 3400 cm−1, carboxylic stretching at 1730 cm−1, CC stretching at 1625 cm−1, C–OH at 1220 cm−1 and C–O stretching at 1055 cm−1 are well evident from the spectra. Interestingly, the carboxylic stretching at 1730 cm−1 is completely absent in BT–GO indicating the amidation reaction between CO groups in GO and BT–NH2. In addition, the appearance of a new band at 1560 cm−1 corresponding to the N–H bending further confirms the reaction between GO and BT–NH2.
C–H stretching frequency supports the presence of the terminal alkene group. The peak at 2994 cm−1 indicates the C–H stretching of alkanes. The peak at 1619 cm−1 indicates the N–H bending, whereas the peak at 1460 cm−1 indicates the C–H bending frequencies. The peak at 1246 cm−1 indicates the C–N stretching frequency of the aliphatic amines. Further evidence of the grafting comes from the TEM micrograph and is discussed later on. The hydrophilic BT nanoparticles were initially refluxed with H2O2 to introduce the O–H functional groups. The amino-silane coupling agent was then employed to terminate the BT nanoparticles with NH2 functional groups. The NH2 groups can readily react with the carboxyl (CO) groups present on the basal planes of GO (see Scheme 2). The nature of interactions was assessed using FTIR. Fig. 1(b) shows the FTIR spectra of GO and BT–GO nanoparticles. The characteristic peaks of GO such as corresponding to hydroxyl (OH) stretching at 3400 cm−1, carboxylic stretching at 1730 cm−1, CC stretching at 1625 cm−1, C–OH at 1220 cm−1 and C–O stretching at 1055 cm−1 are well evident from the spectra. Interestingly, the carboxylic stretching at 1730 cm−1 is completely absent in BT–GO indicating the amidation reaction between CO groups in GO and BT–NH2. In addition, the appearance of a new band at 1560 cm−1 corresponding to the N–H bending further confirms the reaction between GO and BT–NH2.
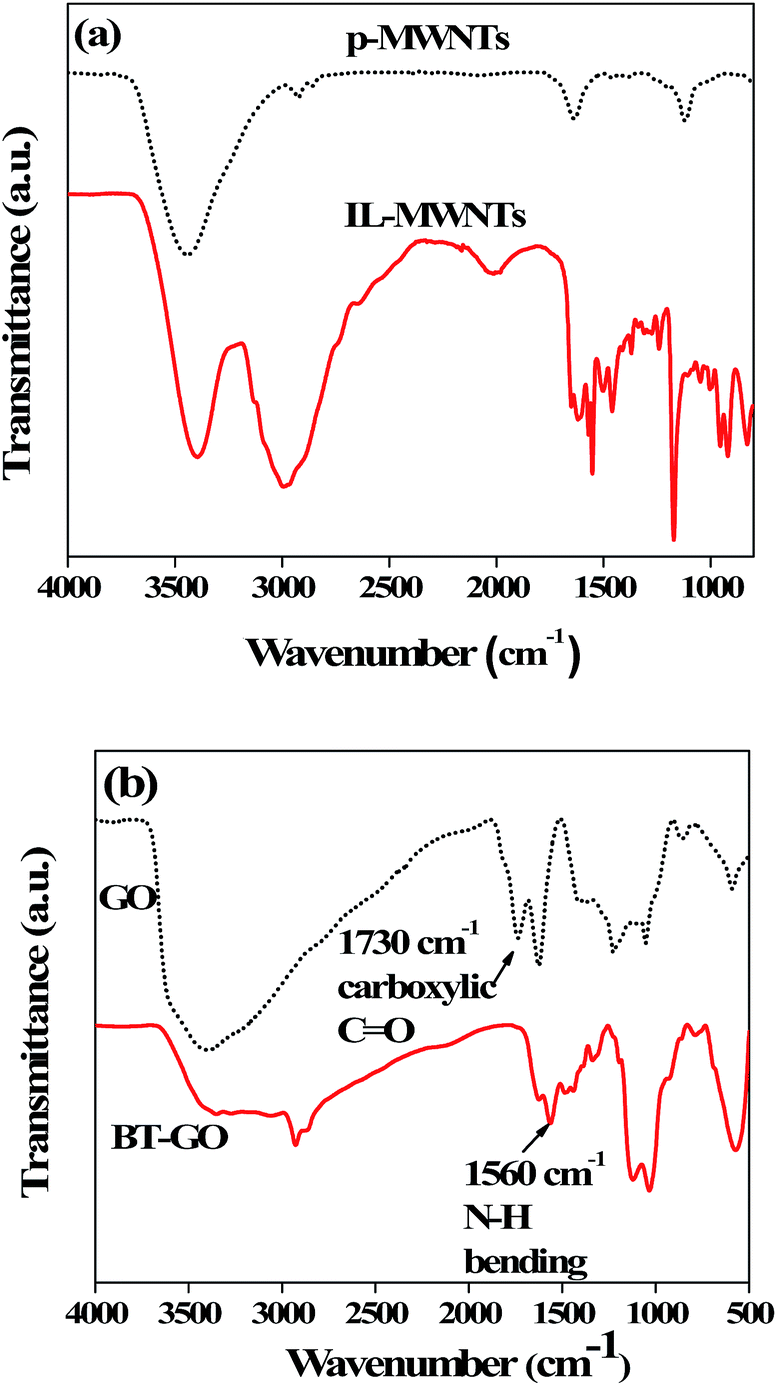 | ||
| Fig. 1 FT-IR spectra of (a) p-MWNTs and IL modified MWNTs, and (b) GO and BT–GO. | ||
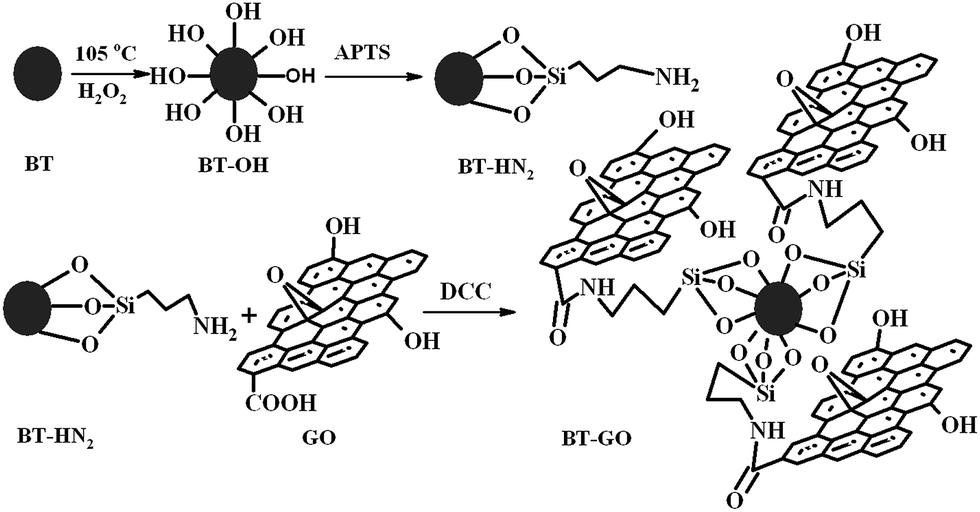 | ||
| Scheme 2 Synthesis of BT–GO. | ||
The TEM micrographs of IL modified MWNTs and BT–GO are shown in Fig. 2. The presence of IL as indicated in Fig. 2(a) is well discerned. Such observations were also reported earlier.36,37Fig. 2(b) and (c) show the TEM micrographs of GO and BT–GO nanoparticles, respectively. It is well evident from Fig. 2(c) that the BT nanoparticles are stitched with the wrinkled GO nanosheets. Fig. 3(a) shows the TEM image of Fe3O4 nanoparticles, and Fig. 3(b) presents the magnetization hysteresis of Fe3O4 nanoparticles. From the hysteresis loop, a saturation magnetization (MS) of 56 emu g−1 and remnant magnetization (MR) of 22.5 emu g−1 are obtained. The coercive force (HC) is observed to be 230 Oe.
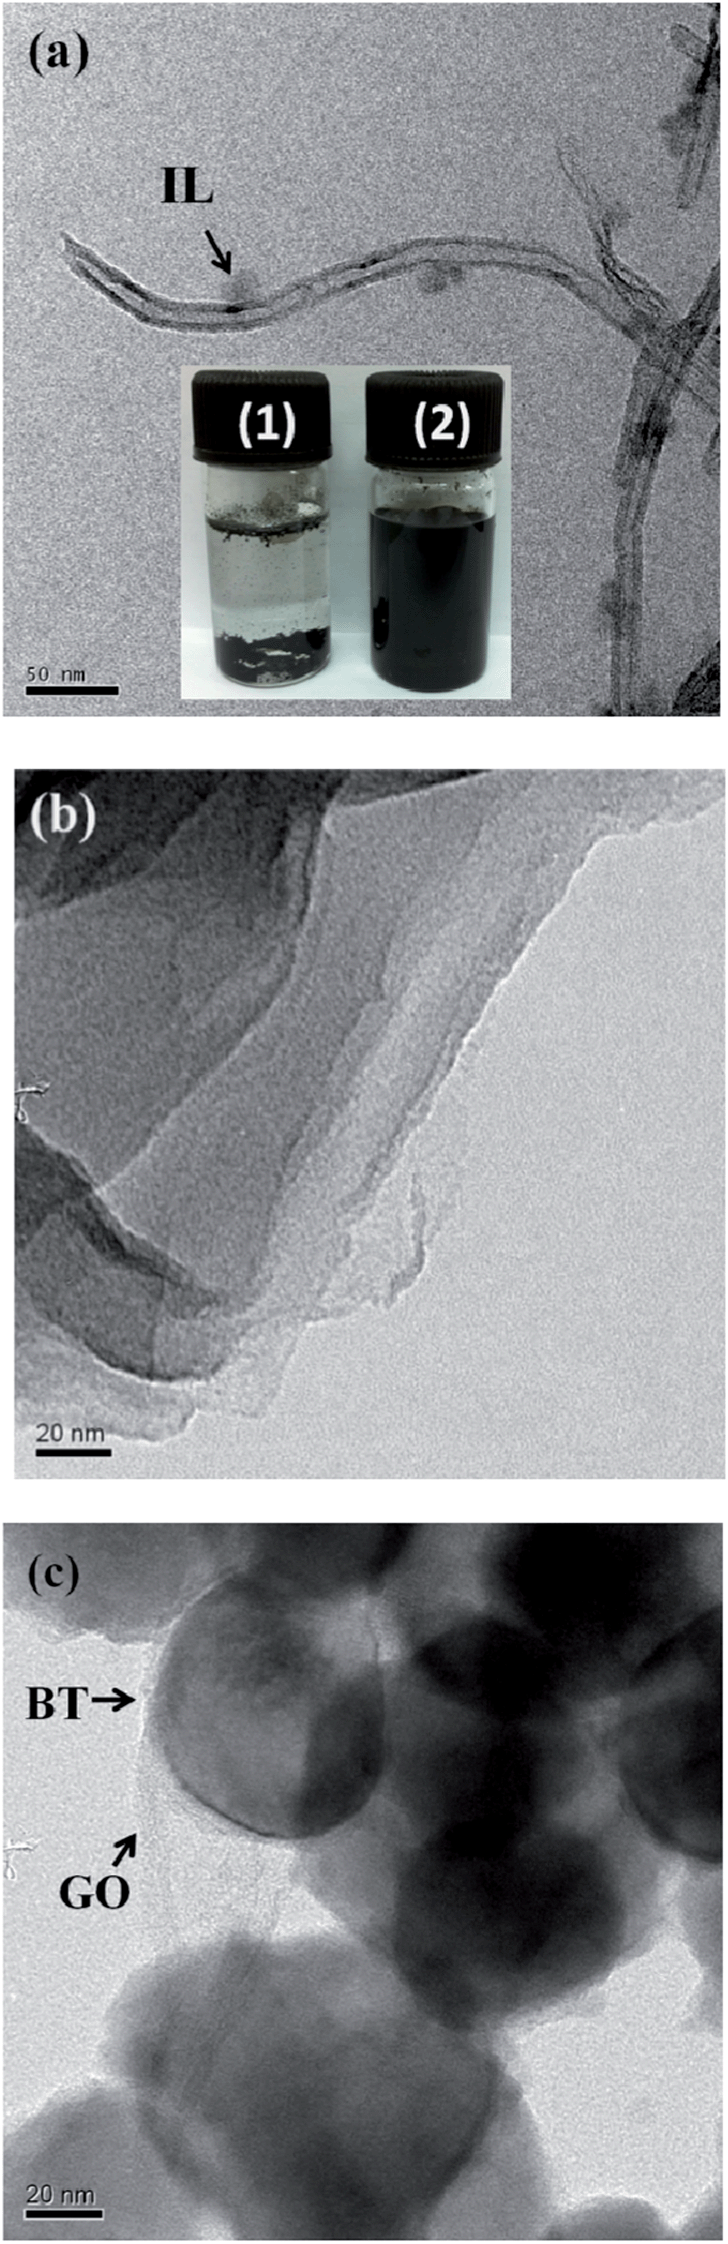 | ||
| Fig. 2 TEM micrographs of IL-MWNTs (a), GO (b) and BT–GO (c). Inset of (a) shows the quality of dispersion of p-MWNTs (vial 1) and IL modified MWNTs (vial 2). | ||
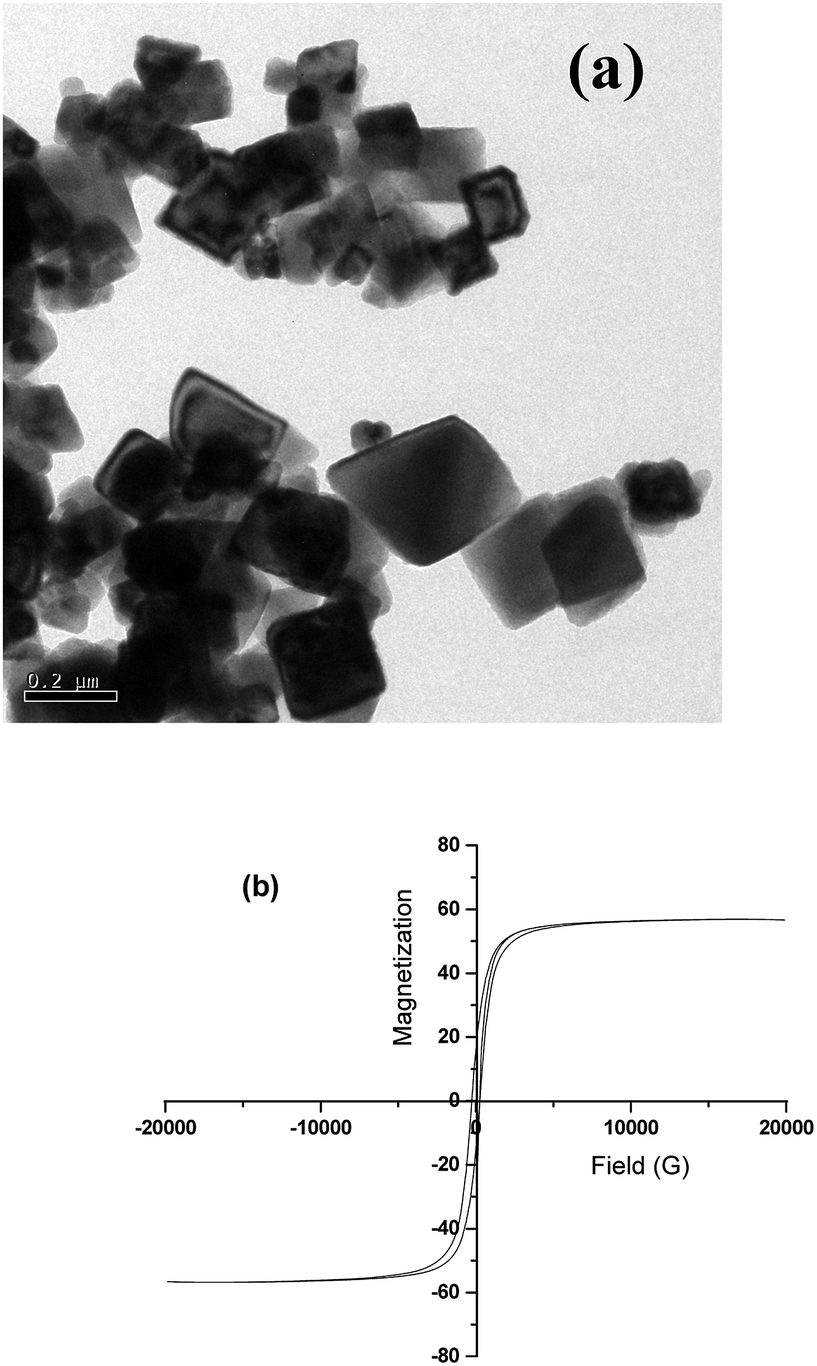 | ||
| Fig. 3 TEM micrographs of Fe3O4 nanoparticles (a) and the magnetic hysteresis loop with applied magnetic field at room temperature of Fe3O4 nanoparticles (b). | ||
Selective localization of nanoparticles in the blends and the phase morphology
Fig. 4 shows the SEM morphologies of the neat 50/50 (w/w) blends of PVDF/ABS and with different MWNTs. It is important to note that in all cases cryofractured blend samples have been etched with chloroform for 72 h at room temperature, which selectively removes the ABS phase from the blends. It is observed that the neat blends show a co-continuous type of morphology. Upon addition of 1 wt% p-MWNTs there is no significant change in the morphology, however, after the removal of the ABS phase the MWNTs are well observed in the remaining PVDF phase. This observation is in close harmony with the thermodynamic predictions and will be discussed later on. In addition, it is observed that the dispersion of MWNTs in the PVDF phase is significantly changed by the addition of IL modified MWNTs. In the case of p-MWNTs small clusters are observed in the PVDF phase (Fig. 4(c)) but on addition of IL modified MWNTs, relatively well dispersed MWNTs are noted (Fig. 4(e)). This observation clearly manifests the role of ionic liquids in facilitating uniform dispersion of MWNTs in the blends. Moreover, the dispersion state of IL modified MWNTs is also well supported by visual observation. For instance, the vial containing a known quantity of p-MWNTs settles quickly after brief sonication, whereas the IL modified MWNTs suspend quite well even for weeks (Fig. 2(a) inset vial picture). In order to further support the selective localization of MWNTs in the blends, solution dissolution experiments were performed. Samples of known amounts were dissolved in respective solvents to completely remove the ABS phase (chloroform) and the PVDF phase (DMF). It is important to note that though DMF is a common solvent to both PVDF and ABS, however, the kinetics of dissolution is quite different. PVDF readily dissolves in DMF, whereas ABS takes a few hours to dissolve. It is quite evident that vial 1 (chloroform) in the inset of Fig. 4(c) is colorless, whereas vial 2 (DMF) shows a strong black solution indicating that MWNTs preferentially localize in the PVDF phase of the blend. As a general observation, the blends with BT–GO and Fe3O4 showed similar co-continuous structures as seen in neat PVDF/ABS blends (Fig. 4(f) and (g)).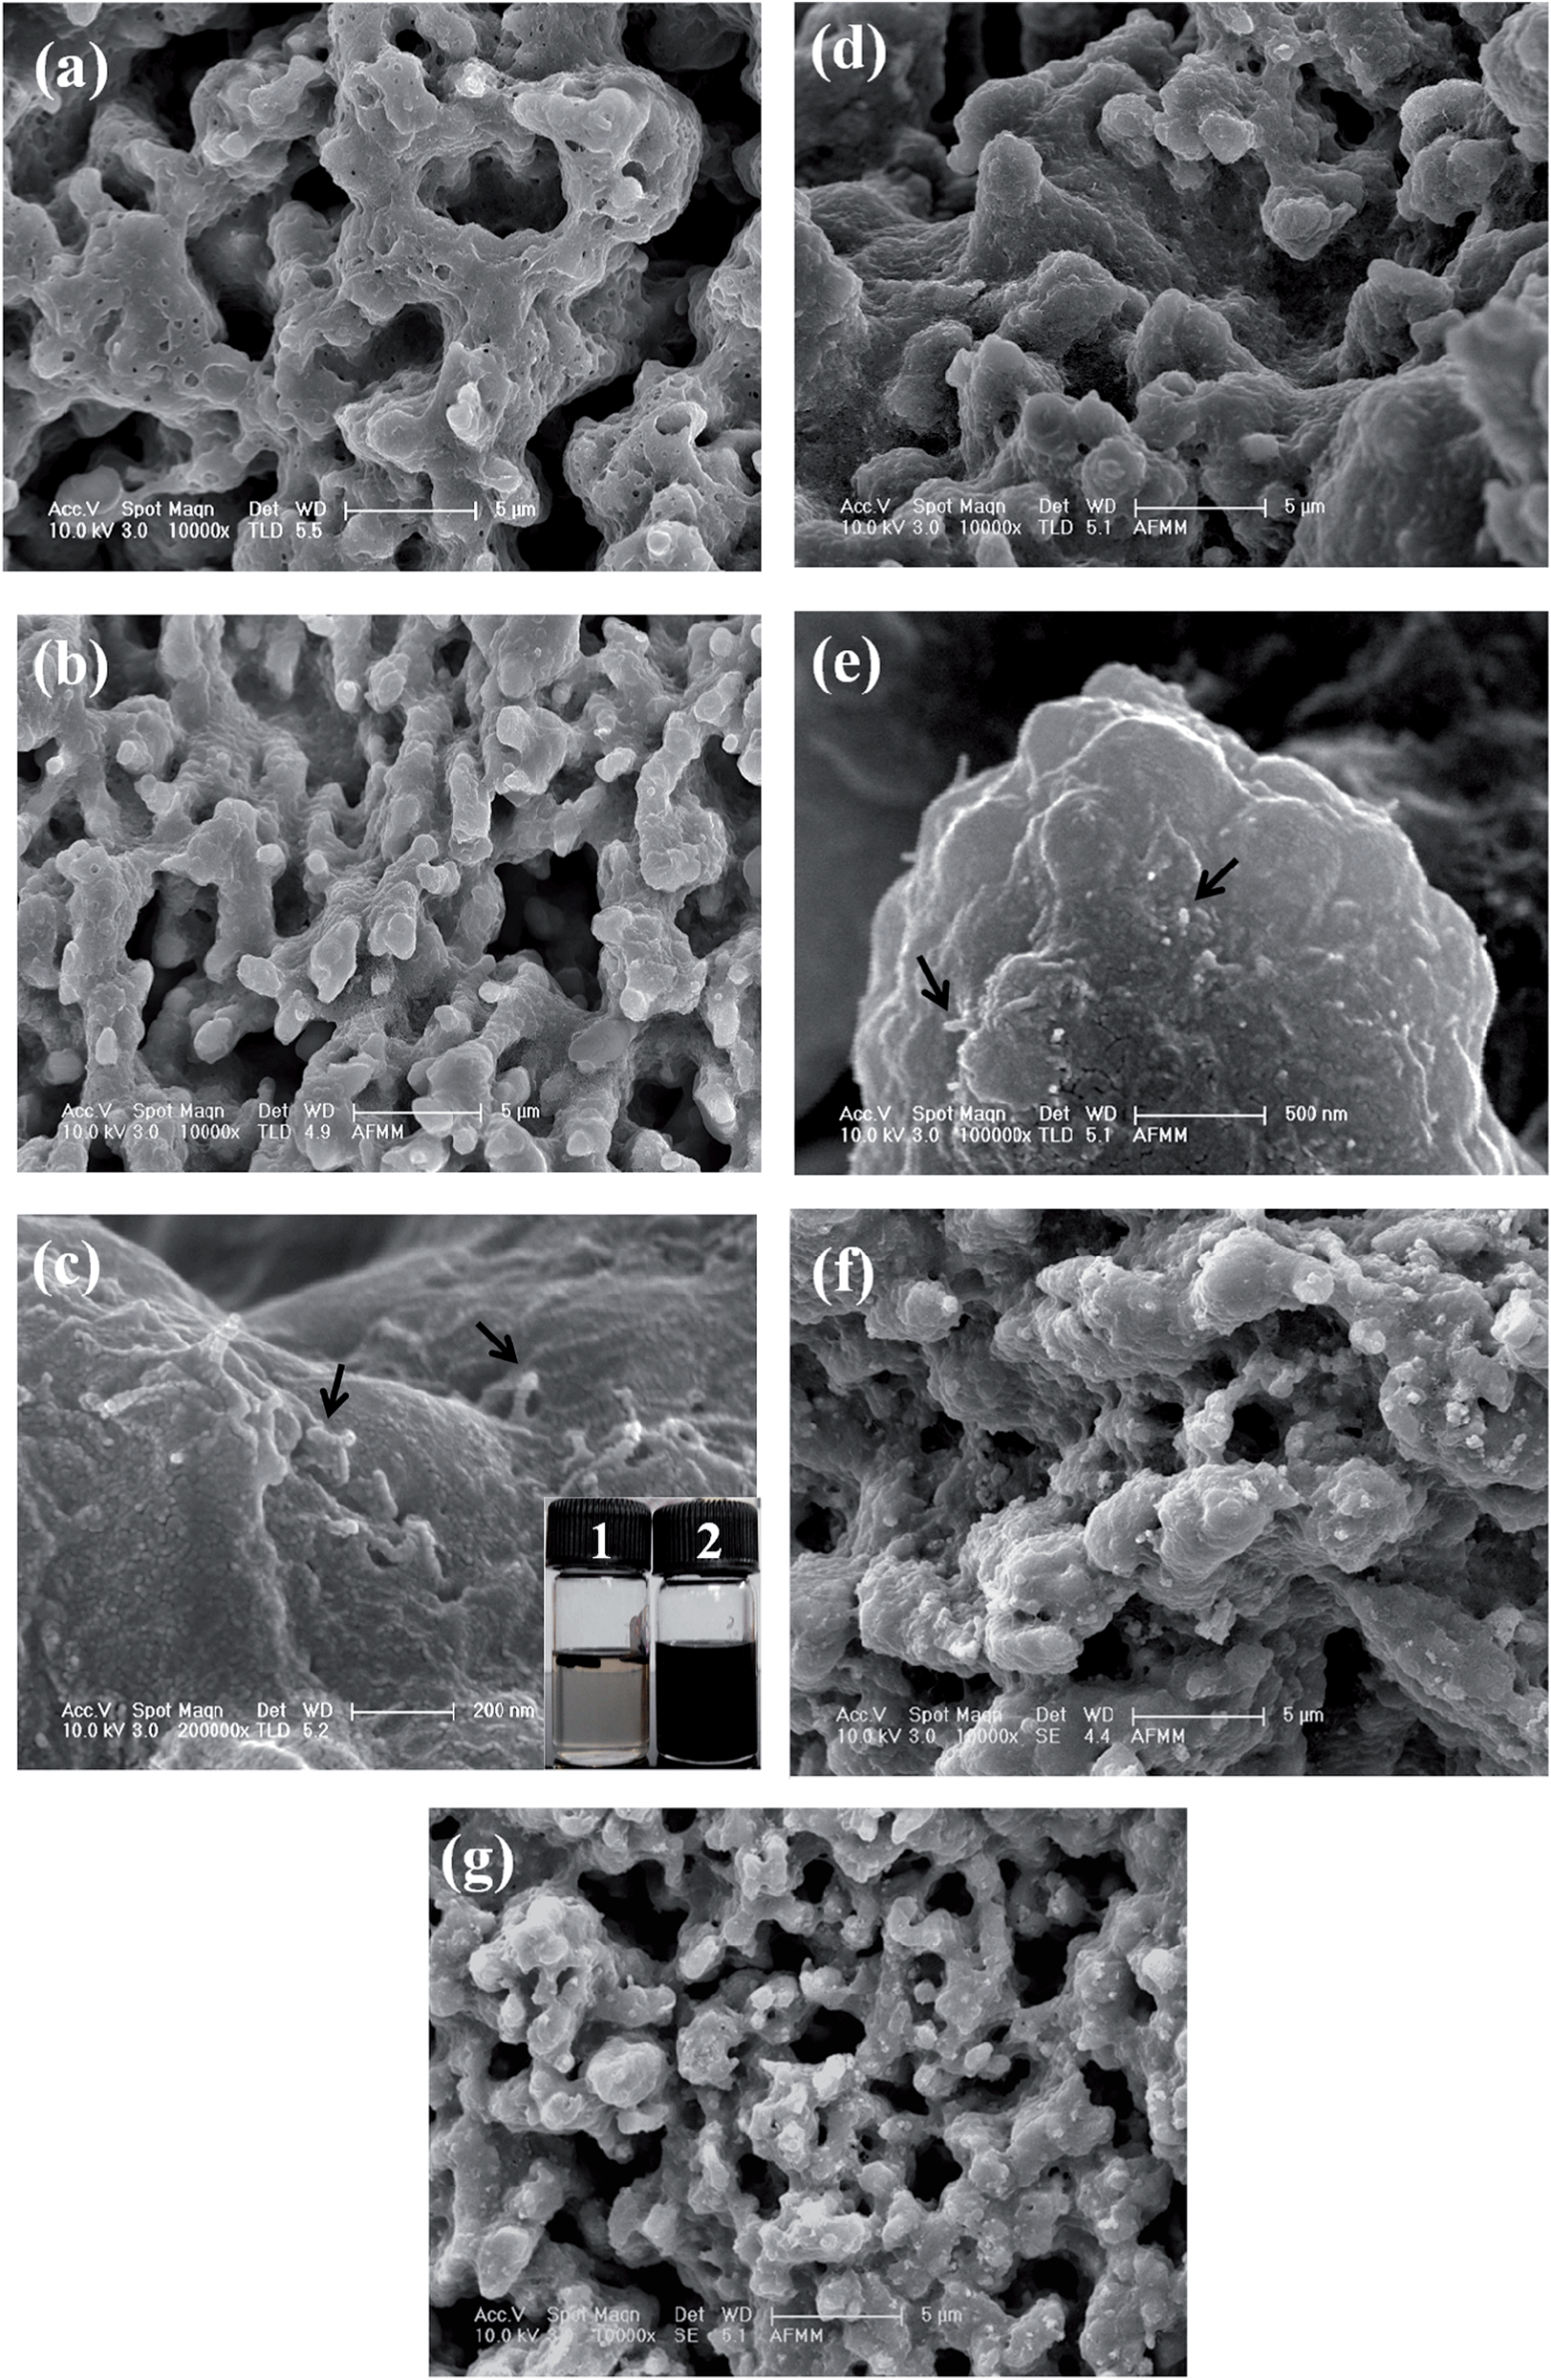 | ||
| Fig. 4 SEM morphologies of 50/50 PVDF/ABS neat blends (a), with 1% p-MWNTs (b), high magnification with 1% p-MWNTs (c) (inset vial picture in CHCl3 and in DMF), with 1% IL-MWNTs (d), high magnification with 1% IL-MWNTs (e), with IL-MWNTs and Fe3O4 (f) and IL-MWNTs with BT–GO (g). | ||
Selective localization of nanoparticles in a given phase or at the interface of a polymer blend can be predicted, a priori, from classical thermodynamics. This is accomplished by knowing the surface free energy values at the melt mixing temperature. By estimating the wetting coefficient (eqn (1)), shown here for the PVDF/ABS/MWNT system as an example, one can predict the localization of particles a priori.15
 | (1) |
 | (2) |
Network like structures of MWNTs in the blends facilitated by IL: effect on electrical conductivity
The bulk electrical conductivity in the blends relies solely on the continuous conducting network of the conducting particles. Fig. 5(a) shows the AC electrical conductivity as a function of frequency for PVDF/ABS blends with MWNTs at room temperature. The percolation threshold for rod-like nanoparticles can be predicted by percolation theory (PC = D/2L; D and L correspond to the diameter and length of the filler), which clearly indicates that the percolation threshold (PC) decreases with increasing aspect ratio of the conducting particles. For both the neat blends and with 0.5 wt% of p-MWNTs, the conductivity increases rapidly with increasing frequency manifesting a typical behavior of an insulator. Interestingly, the addition of 1 wt% p-MWNTs resulted in a six order increment in the AC conductivity, with respect to the neat as well as blends with 0.5 wt% MWNTs. This phenomenal increase in conductivity can be attributed to the gelation of p-MWNTs in the PVDF phase beyond 0.5 wt% MWNTs in the blends. Further, it was observed that the AC electrical conductivity scales with the concentration of the MWNT frequency independent plateau extended to higher frequency. Interestingly, in the presence of 1 wt% IL modified MWNTs the AC electrical conductivity increased further with respect to 1 wt% p-MWNTs and more interestingly represented a similar electrical conductivity to that of 3 wt% p-MWNTs (Fig. 5(a)). The dramatic increase in the AC electrical conductivity is due to the network-like structure of MWNTs in the PVDF phase facilitated by IL. Blends with Fe3O4 and BT–GO nanoparticles showed more or less similar type of AC conductivity with respect to blend with 1 wt% IL-MWNTs clearly suggesting that the network like structure of MWNTs is largely unaffected by the presence of BT–GO and Fe3O4 (Fig. 5(b)). Fig. 5(c) shows the frequency dependent dielectric constant (ε′) of the various blends. Dielectric properties stem from the uneven polarization of electrons in an external electric field. Complex permittivity is given as,42ε* = ε′ − iε′′, where ε′ and ε′′ are the real and imaginary part of the complex permittivity. ε′ and ε′′ depend on the frequency, ω in the applied electric field and can be expressed as,43
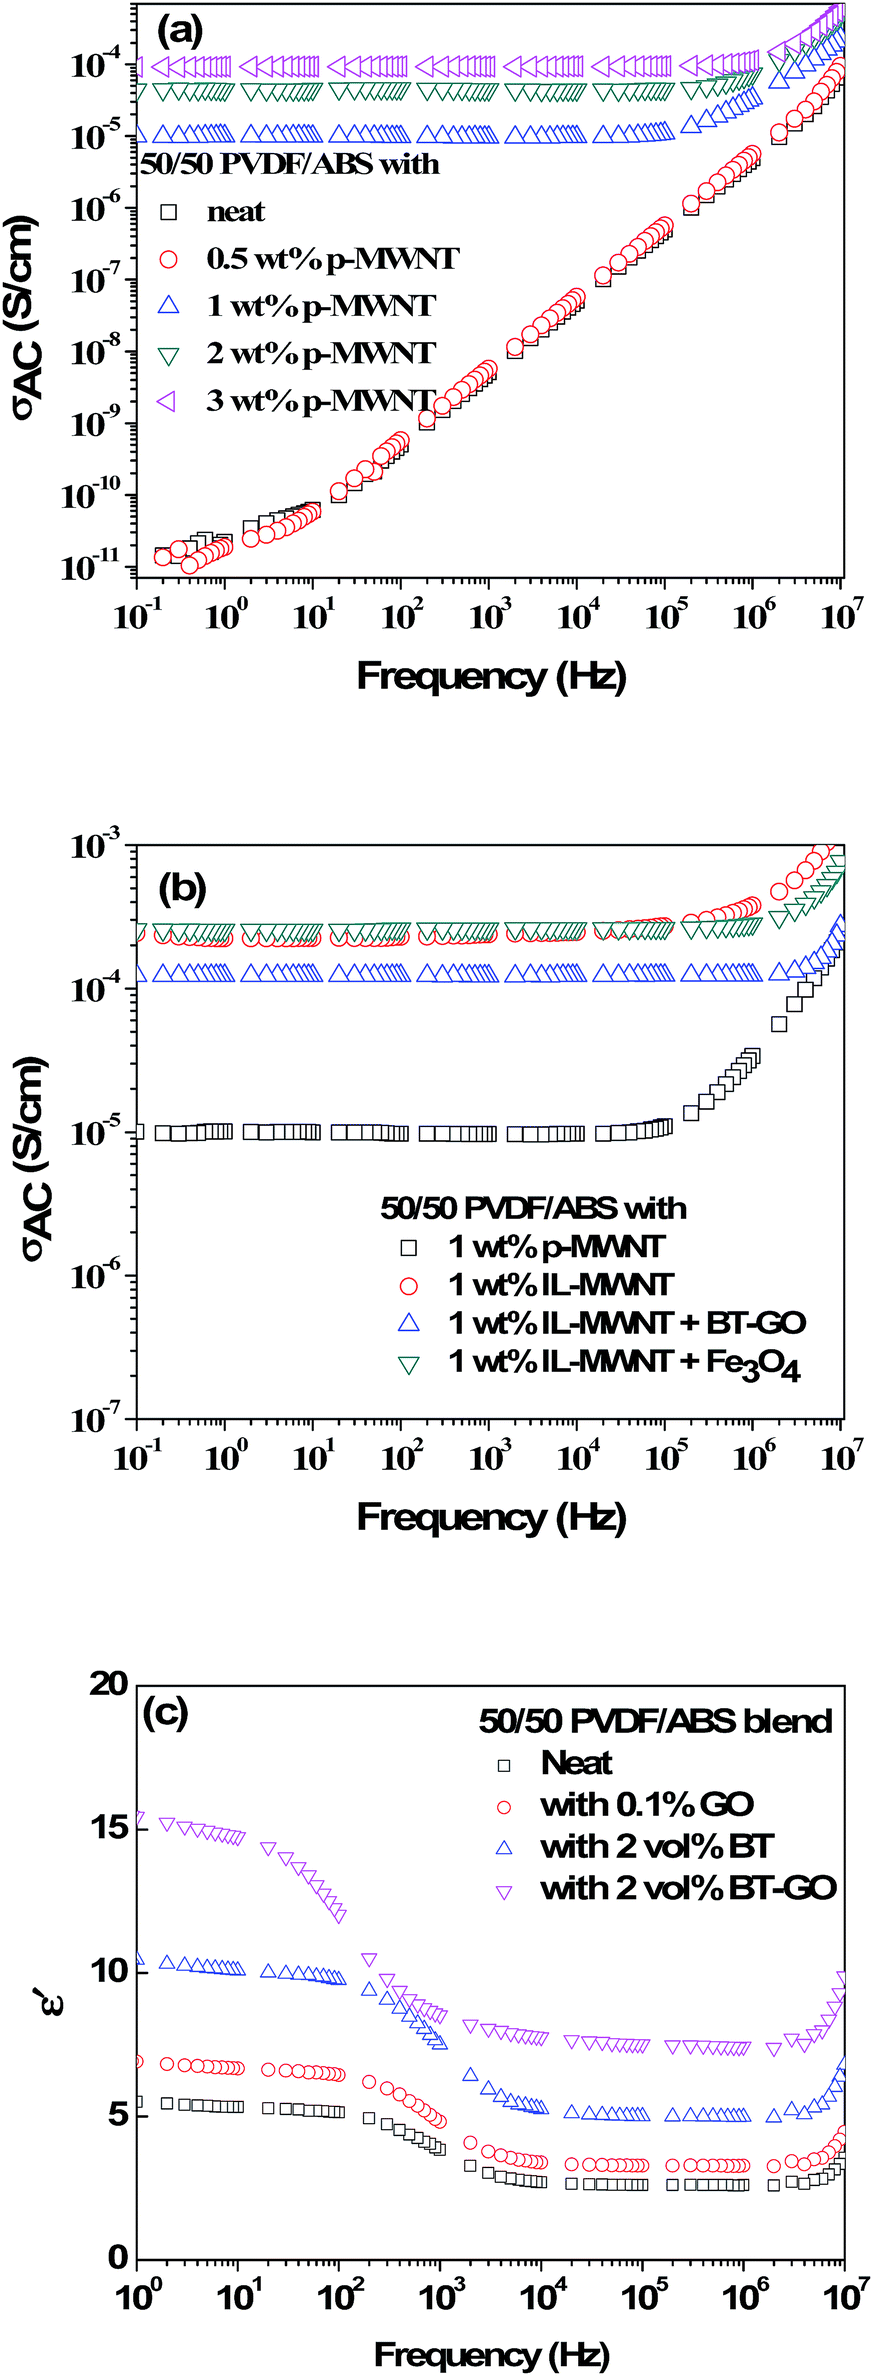 | ||
| Fig. 5 AC electrical conductivity of blends (a) with different wt% of MWNTs and (b) with IL-MWNTs along with inorganic nanoparticles. (c) Frequency dependent dielectric constant of various blends. | ||
Due to blending a low k material (ABS) with a high k material (PVDF), the dielectric constant decreases with respect to the neat PVDF.44 At 100 Hz the 50/50 PVDF/ABS neat blends show an ε′ of 5. In the presence of 0.1% GO, the ε′ increases to 6.5. However, in the presence of BT nanoparticles, it further increases to 9.7. Interestingly, functionalization of BT with GO enhances the polarization further. This is manifested by a significant increase in ε′ to 12 in the blends with only 2 vol% BT–GO particles.
Attenuation of EM radiation: effect of BT–GO and Fe3O4
The spectrum of electromagnetic radiation is composed of waves with electric and magnetic components oscillating at right angles to each other. The electromagnetic shielding is a process of limiting the flow of electromagnetic fields between two locations, by separating them with a barrier made of conducting materials. So EMI shielding effectiveness (SE) can be enhanced by different ways in polymer composites. Sometimes attenuation of EM radiation can be done by either addition of conducting nanoparticles to an insulating polymer matrix or with an inherently conducting polymer as the matrix. Materials with high magnetic permeability are also used to attenuate the incident EM radiation. The shielding effectiveness is the amount of attenuation of incident radiation by a particular material and is expressed in dB. There are three mechanisms in shielding, namely reflection (SER), absorption (SEA) and multiple reflections (SEMR). The multiple reflections can be ignored when SET is greater than 15 dB.45 The reflection mechanism is prominent in the case of materials containing free mobile charge carriers. In order to reflect EM radiation, materials should have high electrical conductivity and mobile charge carriers which can interact with the incident EM radiation. EM radiation attenuated by absorption requires both electric and magnetic dipoles. This absorption loss arises due to generation of eddy currents which is the result of ohmic losses and leads to heating of the material. Owing to the high thermal conductivity of MWNTs, heat generated due to ohmic losses can be dissipated easily through a MWNT network.The total SE is the summation of shielding by absorption (SEA), reflection (SER) and multiple reflections (SEMR) and is expressed as SET = SEA + SER + SEMR and is the ratio of EM radiation transmitted through the sample to incident EM radiation
SE due to different mechanisms, reflection and absorption mentioned above can be evaluated by the following equations,
| SER = 10log10 (1/(1 − S112)) |
| SEA = 10log10 ((1 − S112)/S122) |
As we discussed earlier, the conductivity and network formation of MWNTs are the key requirements to achieve high attenuation of EM radiation. It is well established that by selectively localizing MWNTs in a given phase of the blend, network like structures of MWNTs can be obtained. All the experiments were performed in the X and Ku-band frequency range. These frequency ranges are quite important for commercial applications like TV signal transmission, Doppler, telephone radiation, radar systems, etc.
Fig. 6(a) shows the EMI shielding performances of the different blends. It was observed that PVDF/ABS blends with1 wt% p-MWNTs show a SE of −16 dB while the neat blends and with 0.5 wt% p-MWNTs are transparent to EM radiation. It is well evident that the blends with insulating characteristics are transparent to incident radiation but conducting networks formed due to the addition of MWNTs beyond the percolation threshold interact with incident rays and account for shielding effectiveness. The EMI SE increased from −16 dB to −23 dB at 18 GHz with increasing concentration of p-MWNTs from 1 to 3 wt%. Interestingly, with the addition of 1 wt% IL-MWNTs the SE is −22 dB at 18 GHz which clearly manifests the key role of ionic liquid in facilitating the formation of an interconnected network structure of MWNTs and attenuating more EM radiation. As we discussed earlier reflection, absorption and multiple reflection are the mechanisms of shielding, where reflection is the primary mechanism and absorption is the secondary mechanism in the case of uniformly dispersed conducting nanoparticles. After the addition of 2 vol% Fe3O4 along with 1 wt% IL-MWNTs, there is no significant improvement in the SE whereas we observed ca. 4 dB increment after the addition of 2 vol% BT–GO particles. Moreover, absorption is the governing mechanism of shielding in the presence of BT–GO nanoparticles (Fig. 6(b) and (c)). As discussed earlier, the high dielectric constant materials like BT–GO can attenuate EM radiation. It is worth mentioning here that PVDF/BT–GO exhibited a significantly higher dielectric constant than both PVDF/GO and PVDF/BT composites which is illustrated in Fig. 5(c).49 A comparison has been made to highlight the effects of BT–GO towards attenuating EM radiation (Fig. 6(d) and Table 1). A twisted film of the blend with 1 wt% IL modified MWNTs and BT–GO is depicted in Fig. 6(e). This clearly shows that the flexibility of the film is retained even at 2 vol% BT–GO nanoparticles.
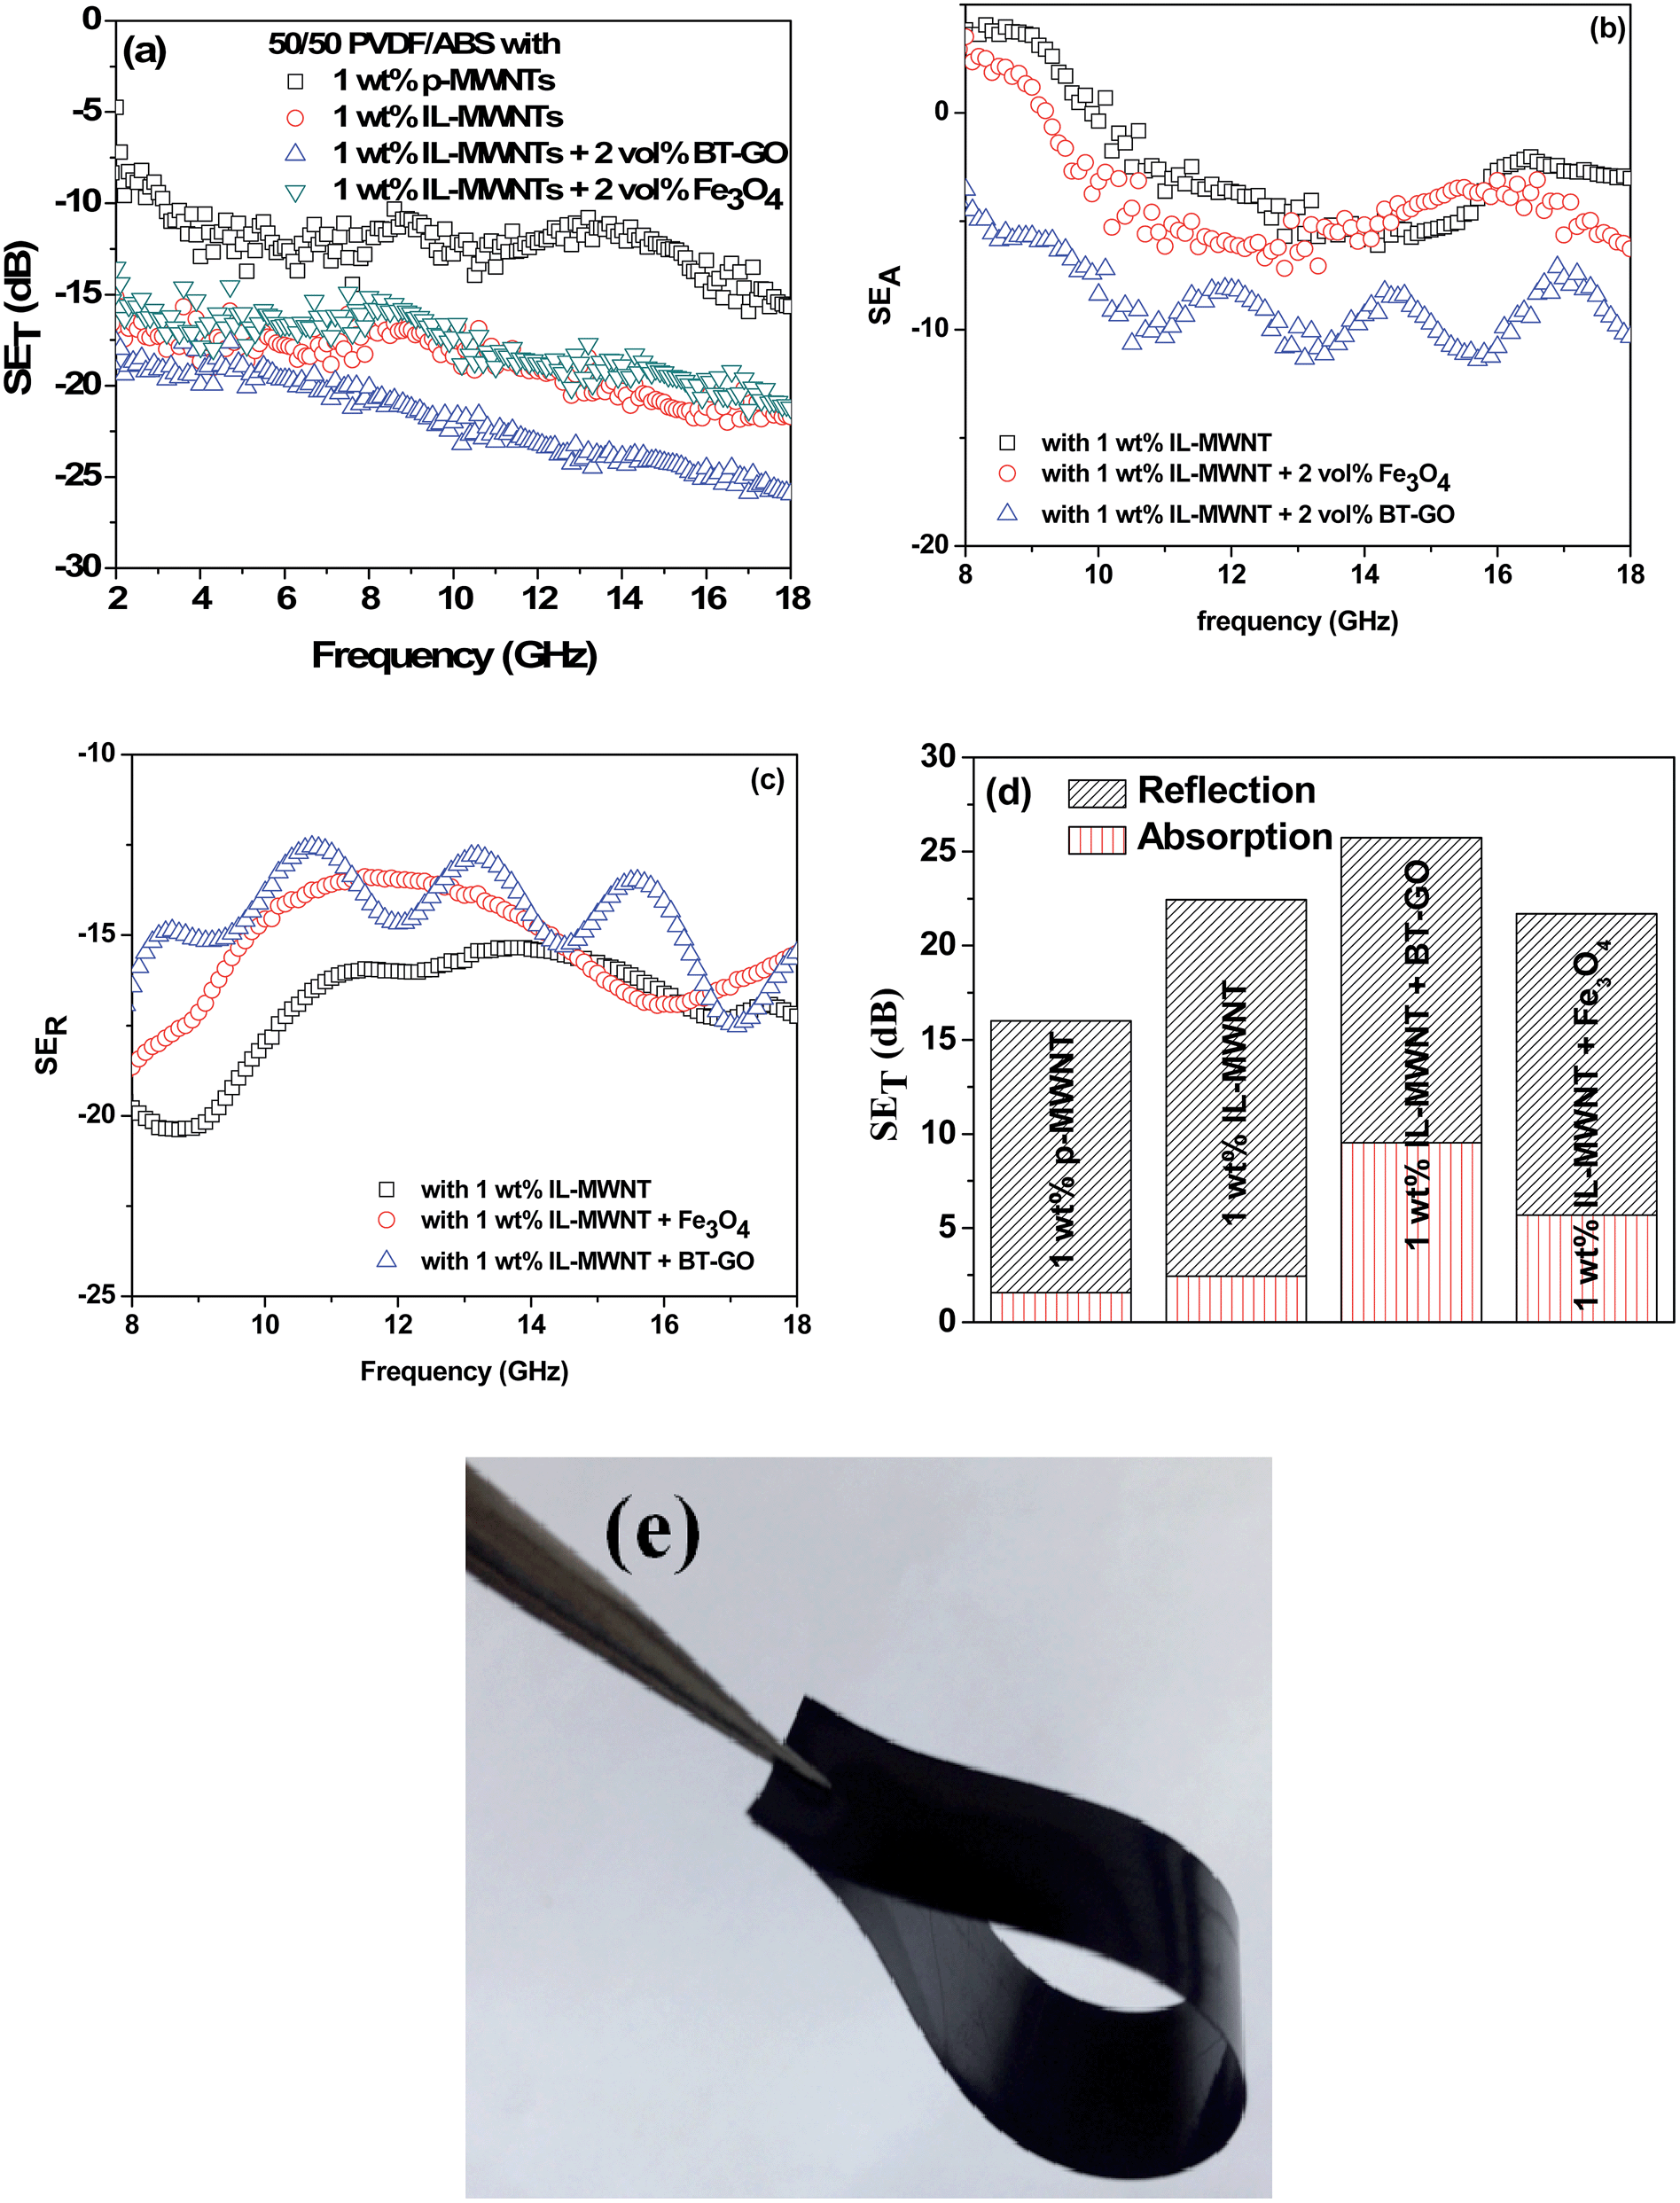 | ||
| Fig. 6 (a–c) EMI shielding effectiveness (SE) of the various blends, (d) reflection and absorption components in the blends, and (e) twisted film of the blend with 1 wt% IL modified MWNTs and BT–GO showing the flexibility of the film. | ||
| Compositions | SET (dB) | SEA (dB) | SER (dB) |
|---|---|---|---|
| With 1 wt% p-MWNT | 16 | 1.5 | 14.5 |
| With 2 wt% p-MWNT | 19 | 2 | 17 |
| With 3 wt% p-MWNT | 23 | 2.8 | 20.2 |
| With 1 wt% IL-MWNT | 22 | 2.9 | 19.1 |
| With 1 wt% IL-MWNT + 2 vol% Fe3O4 | 22 | 6.8 | 15.2 |
| With 1 wt% IL-MWNT + 2 vol% GO | 22 | 5 | 17 |
| With 1 wt% IL-MWNT + 2 vol% BT–NH2 | 23 | 6 | 17 |
| With 1 wt% IL-MWNT + 2 vol% BT–GO | 26 | 10.5 | 15.5 |
In order to get more insight into the mechanism of shielding, we took a closer look at the permeability and permittivity values. Well-established line theory proposed by Nicolson and Ross was adopted to estimate the permeability and permittivity of the blends. It is observed that the permeability in the case of Fe3O4 containing blend is higher, and the permittivity is maximum in BT–GO containing blends. Hence, the enhanced shielding effectiveness is mainly due to the improved permittivity and permeability values in the blends (Fig. 7(a) and (b)).
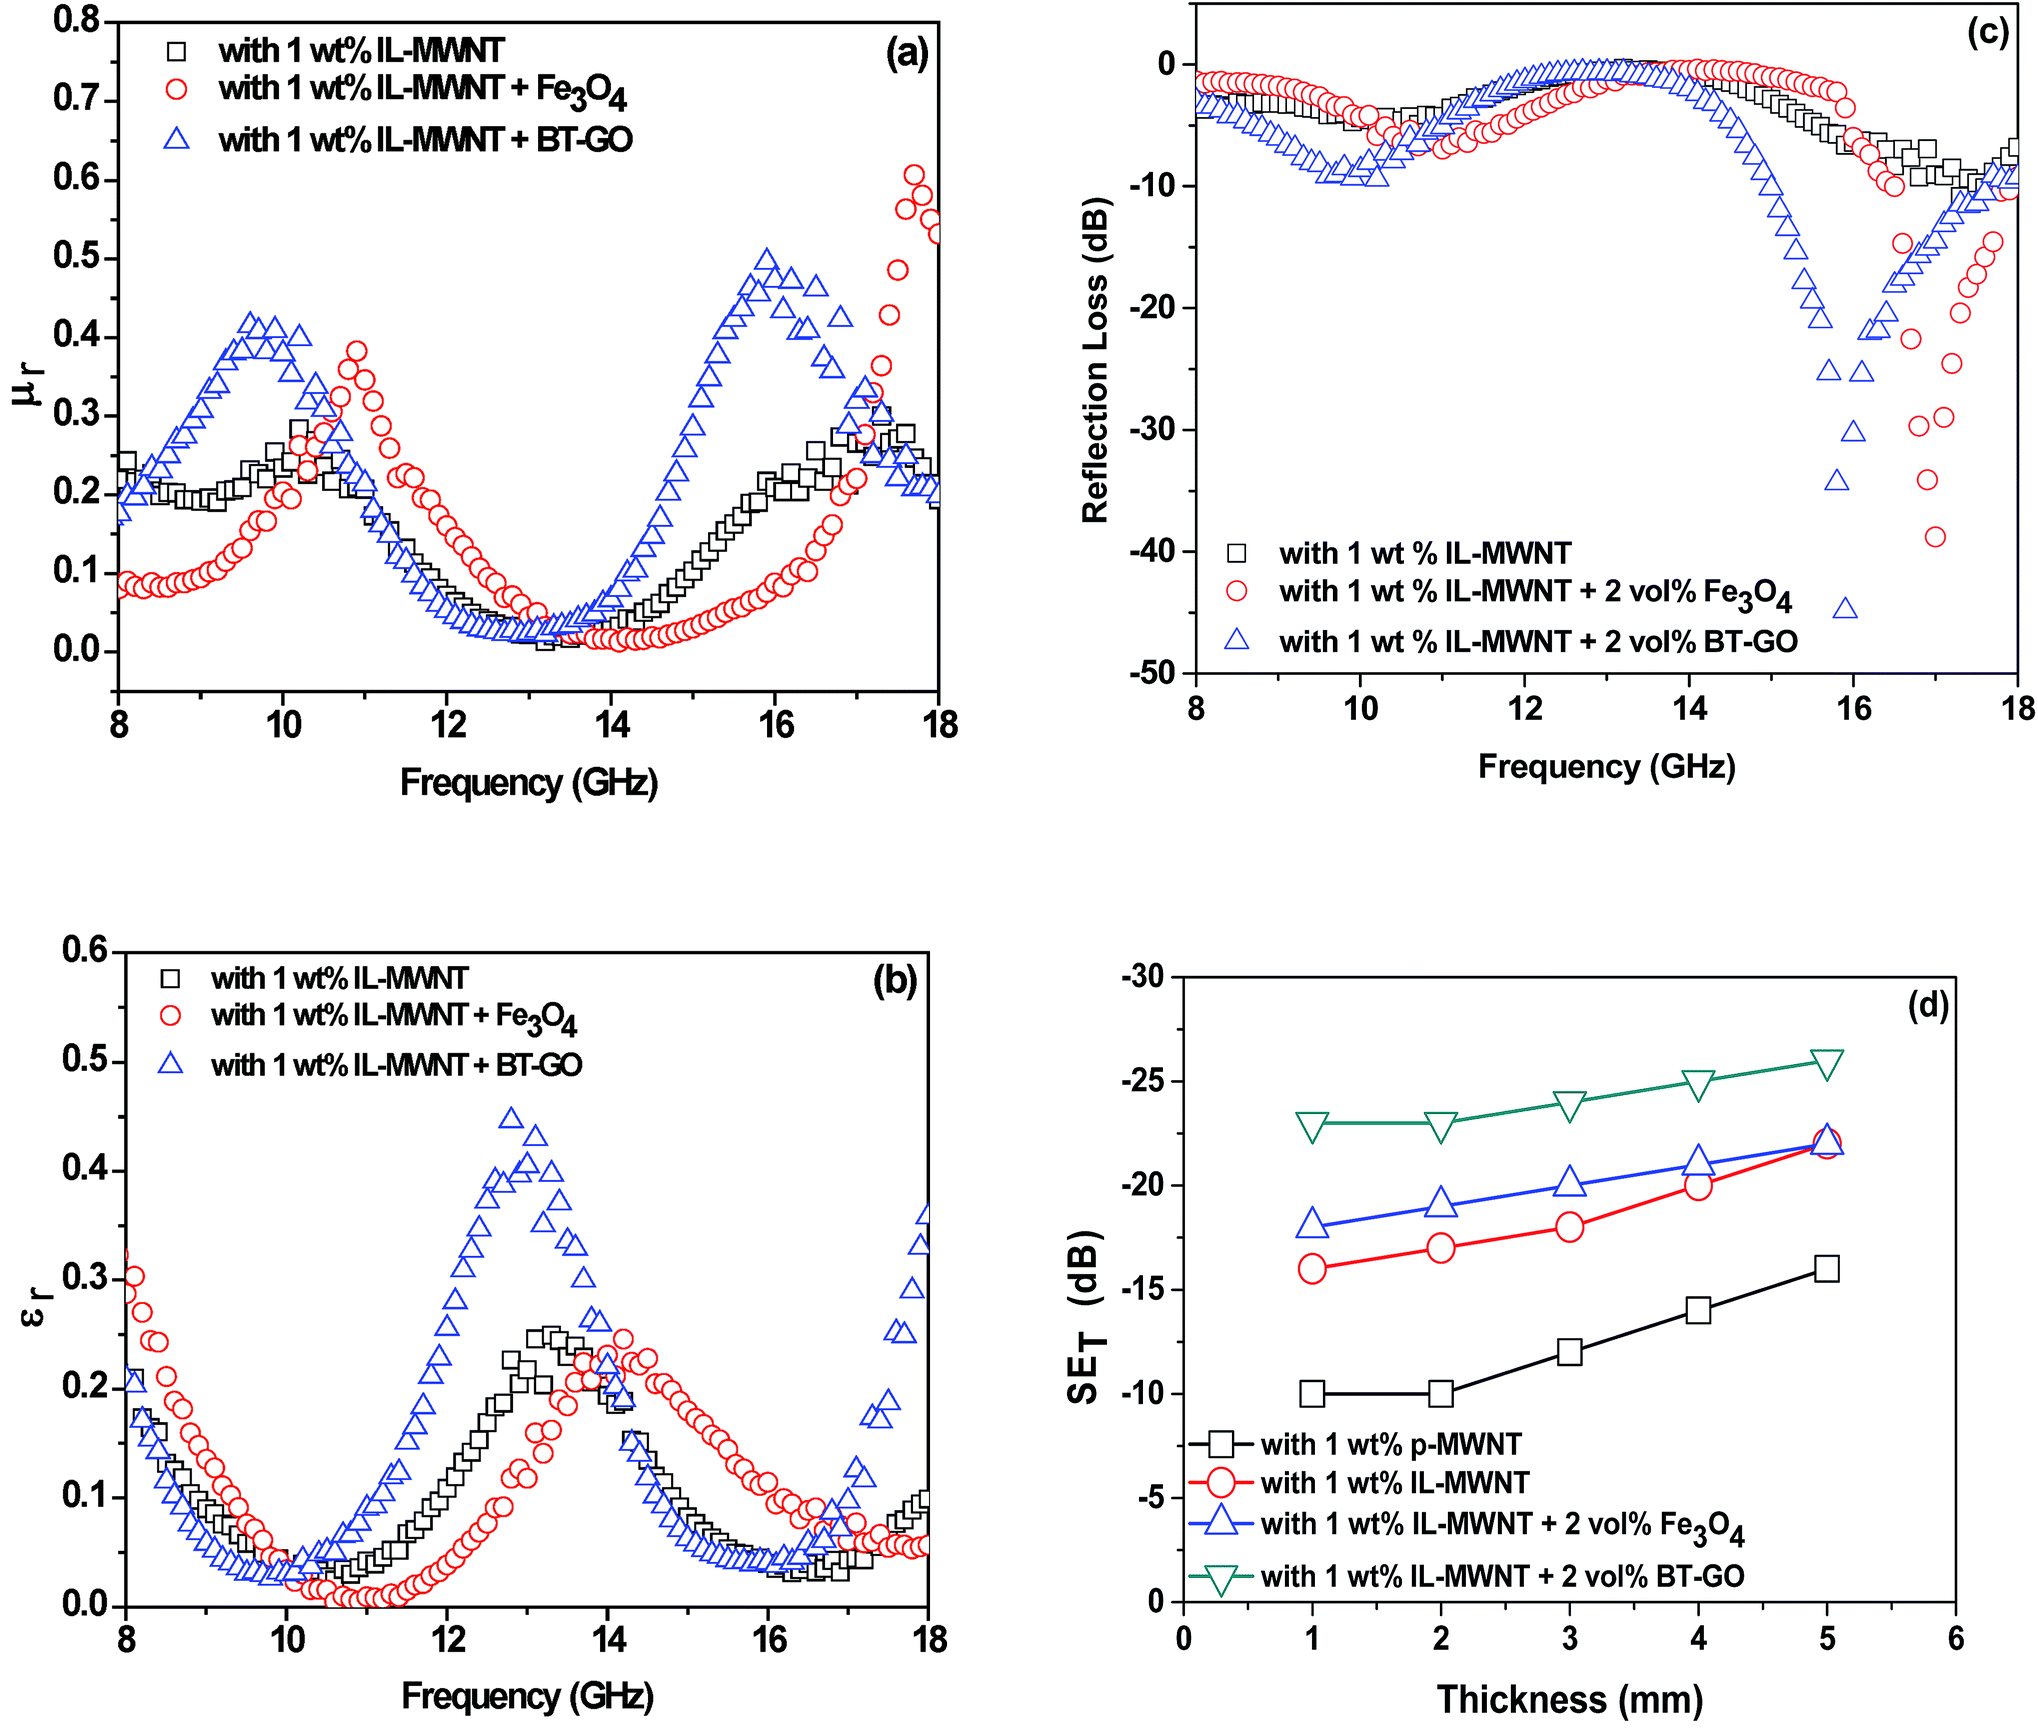 | ||
| Fig. 7 (a) Permeability; (b) permittivity; (c) reflection loss; (d) shielding effectiveness as a function of shield thickness in PVDF/ABS blends. | ||
We also calculated the reflection loss by line theory proposed by Nicolson and Ross. We observed that the blends containing BT–GO showed a minimum RL (−44.9 dB) at 15.9 GHz and the blend containing Fe3O4 showed a minimum RL (−38.7 dB) at 17 GHz (Fig. 7(c)).
It is well accepted in the literature that EM shielding efficiency is dependent on the sample thickness. We varied the thickness of the samples and observed that the shielding effectiveness increases significantly (Fig. 7(d)) beyond certain thickness (2 mm). Generally, the formation of a conductive mesh in the matrix intercepts the electromagnetic radiation. Now with increase in the shield thickness, the number of conductive meshes increases resulting in enhanced EMI SE.50,52
The SE obtained in this study is quite high especially given the concentration of the MWNTs being quite low. It is clearly evident from the literature (see Table 2) that higher loading of conducting fillers can lead to higher attenuation of EM radiation. But it is also important to note that higher loading of conducting fillers can lead to adverse effects on the structural properties of the nanocomposites and is also difficult to process. In this study, we have successfully improved the SE at a very low fraction of MWNTs via modification of ionic liquid. It is well evident that dispersion of MWNTs is the key factor to improve the EM attenuation besides the presence of ferroelectric (BT–GO) and ferromagnetic phases (Fe3O4).
| System | Conducting fillers | Concentration | Frequency (GHz) | SET (dB) | Reference |
|---|---|---|---|---|---|
| PC/ABS | MWNTs | 3 phr | 1.5 | −7 | 51 |
| PS/PMMA | Amine terminated MWNT | 1 wt% | 18 | −26 | 15 |
| PC/SAN | Amine terminated MWNT | 1 wt% | 18 | −14 | 18 |
| PC/SAN | MWNT-g-Fe3O4 | 3 wt% | 18 | −32 | 18 |
| PVDF | f-Graphene | 7 wt% | 12 | −18.5 | 53 |
| PVDF | IL-MWNTs | 2 wt% | 18 | −20 | 26 |
| PVDF | MWNT + BT–GO | 3 wt% | 18 | −25 | 49 |
| PVDF/ABS | IL-MWNT + Fe3O4 | 1 wt% | 18 | −23 | This work |
| PVDF/ABS | IL-MWNT + BT–GO | 1 wt% | 18 | −26 | This work |
Conclusions
In this work, different MWNTs were incorporated into PVDF/ABS blends to design materials with high EMI SE. The selective localization and dispersion of p-MWNTs were successfully tuned by the addition of ionic liquid which also helped in the improvement in bulk electrical conductivity and EMI SE. The EMI shielding in X and Ku band frequency was assessed here and the blends with 1 wt% IL modified MWNTs showed significant improvement in SE. The EM attenuation through absorption was enhanced by incorporation of BT–GO nanoparticles along with 1 wt% IL modified MWNTs and interestingly attained 26 dB at 18 GHz frequency. Such results can be quite interesting in designing lightweight and flexible materials for microwave absorption with addition of a very lower concentration of nanofillers.Acknowledgements
The authors gratefully acknowledge the financial support from DST (India).References
- L. A. Utracki, Polymer blends handbook, Kluwer Academic Publishers, Dordrecht, The Netherlands, 2002 Search PubMed.
- G. P. Kar, N. Begam, J. K. Basu and S. Bose, Macromolecules, 2014, 47, 7525–7532 CrossRef CAS.
- G. P. Kar, P. Xavier and S. Bose, Phys. Chem. Chem. Phys., 2014, 16, 17811–17821 RSC.
- A. Bharati, P. Xavier, G. P. Kar, G. Madras and S. Bose, J. Phys. Chem. B, 2014, 118, 2214–2225 CAS.
- G. P. Kar, A. Bharati, P. Xavier, G. Madras and S. Bose, Phys. Chem. Chem. Phys., 2015, 17, 868–877 RSC.
- S. Bose, A. R. Bhattacharyya, A. R. Kulkarni and P. Pötschke, Compos. Sci. Technol., 2009, 69, 365–372 CrossRef CAS PubMed.
- A. M. Stephan, Eur. Polym. J., 2006, 42, 21–42 CrossRef PubMed.
- G. P. Kar, S. Biswas and S. Bose, Phys. Chem. Chem. Phys., 2015, 17, 1811–1821 RSC.
- S. Bose, A. R. Bhattacharyya, R. A. Khare, S. S. Kamath and A. R. Kulkarni, Polym. Eng. Sci., 2011, 51, 1987–2000 CAS.
- S. Bose, R. A. Khare and P. Moldenaers, Polymer, 2010, 51, 975–993 CrossRef CAS PubMed.
- P. V. Kodgire, A. R. Bhattacharyya, S. Bose, N. Gupta, A. R. Kulkarni and A. Misra, Chem. Phys. Lett., 2006, 432, 480–485 CrossRef CAS PubMed.
- S. Bose, A. R. Bhattacharyya, M. Chawley, P. V. Kodgire, A. R. Kulkarni, A. Misra and P. Poetschke, J. Nanosci. Nanotechnol., 2008, 8, 1721–1727 CrossRef CAS PubMed.
- S. Bose, A. R. Bhattacharyya, R. A. Khare, A. R. Kulkarni and P. Poetschke, Macromol. Symp., 2008, 263, 11–20 CrossRef CAS.
- S. Bose, A. R. Bhattacharyya, R. A. Khare, S. S. Kamath and A. R. Kulkarni, Polym. Eng. Sci., 2011, 51, 1987–2000 CAS.
- R. Rohini and S. Bose, ACS Appl. Mater. Interfaces, 2014, 6, 11302–11310 CAS.
- P. Xavier and S. Bose, Rsc Adv., 2014, 4, 55341–55348 RSC.
- S. P. Pawar, K. Pattabhi and S. Bose, RSC Adv., 2014, 4, 18842–18852 RSC.
- S. P. Pawar, D. Marathe, K. Pattabhi and S. Bose, J. Mater. Chem. A, 2015, 3, 656–669 CAS.
- D. D. L. Chung, Carbon, 2001, 39, 279–285 CrossRef CAS.
- N. Li, Y. Huang, F. Du, X. B. He, X. Lin, H. J. Gao, Y. F. Ma, F. F. Li, Y. S. Chen and P. C. Eklund, Nano Lett., 2006, 6, 1141–1145 CrossRef CAS PubMed.
- Y. Y. Wang and X. L. Jing, Polym. Adv. Technol., 2005, 16, 344–351 CrossRef CAS.
- S. Bhadra, D. Khastgir, N. K. Singha and J. H. Lee, Prog. Polym. Sci., 2009, 34, 783–810 CrossRef CAS PubMed.
- B. P. Singh, Prabha, P. Saini, T. Gupta, P. Garg, G. Kumar, I. Pande, S. Pande, R. K. Seth, S. K. Dhawan and R. B. Mathur, J. Nanopart. Res., 2011, 13, 7065–7074 CrossRef CAS.
- M. H. Al-Saleh and U. Sundararaj, Carbon, 2009, 47, 1738–1746 CrossRef CAS PubMed.
- Z. Liu, G. Bai, Y. Huang, Y. Ma, F. Du, F. Li, T. Guo and Y. Chen, Carbon, 2007, 45, 821–827 CrossRef CAS PubMed.
- M. Sharma, S. Sharma, J. Abraham, S. Thomas, G. Madras and S. Bose, Mater. Res. Express, 2014, 1, 035003 CrossRef.
- R. K. Donato, K. Z. Donato, H. S. Schrekker and L. Matejka, J. Mater. Chem., 2012, 22, 9939–9948 RSC.
- R. K. Donato, L. Matejka, H. S. Schrekker, J. Plestil, A. Jigounov, J. Brus and M. Slouf, J. Mater. Chem., 2011, 21, 13801–13810 RSC.
- J. Dupont, R. F. de Souza and P. A. Z. Suarez, Chem. Rev., 2002, 102, 3667–3691 CrossRef CAS PubMed.
- R. D. Rogers, Nature, 2007, 447, 917–918 CrossRef CAS PubMed.
- T. Fukushima and T. Aida, Chem.–Eur. J., 2007, 13, 5048–5058 CrossRef CAS PubMed.
- A. Mandal and A. K. Nandi, ACS Appl. Mater. Interfaces, 2013, 5, 747–760 CAS.
- P. K. S. Mural, A. Banerjee, M. S. Rana, A. Shukla, B. Padmanabhan, S. Bhadra, G. Madras and S. Bose, J. Mater. Chem. A, 2014, 2, 17635–17648 CAS.
- S. Bose, H. Raghu and P. A. Mahanwar, J. Appl. Polym. Sci., 2006, 100, 4074–4081 CrossRef CAS.
- L. Xie, X. Huang, C. Wu and P. Jiang, J. Mater. Chem., 2011, 21, 5897–5906 RSC.
- B. Yu, F. Zhou, G. Liu, Y. Liang, W. T. S. Huck and W. Liu, Chem. Commun., 2006, 2356–2358 RSC.
- B. Wu, D. Hu, Y. Yu, Y. Kuang, X. Zhang and J. Chen, Chem. Commun., 2010, 46, 7954–7956 RSC.
- D. F. Coutinho, I. H. Pashkuleva, C. M. Alves, A. P. Marques, N. M. Neves and R. L. Reis, Biomacromolecules, 2008, 9, 1139–1145 CrossRef CAS PubMed.
- Q. Zhao, Y. Liu and E. W. Abel, J. Colloid Interface Sci., 2004, 280, 174–183 CrossRef CAS PubMed.
- X. Sun, Y. Liu, C.-a. Di, Y. Wen, Y. Guo, L. Zhang, Y. Zhao and G. Yu, Adv. Mater., 2011, 23, 1009–1014 CrossRef CAS PubMed.
- X. Zhao, J. Zhao, J.-P. Cao, X. Wang, M. Chen and Z.-M. Dang, J. Phys. Chem. B, 2013, 117, 2505–2515 CrossRef CAS PubMed.
- J.-K. Yuan, S.-H. Yao, A. Sylvestre and J. Bai, J. Phys. Chem. C, 2011, 116, 2051–2058 Search PubMed.
- P. Barber, S. Balasubramanian, Y. Anguchamy, S. Gong, A. Wibowo, H. Gao, H. J. Ploehn and H.-C. Zur Loye, Materials, 2009, 2, 1697–1733 CrossRef CAS PubMed.
- M. Sharma, G. Madras and S. Bose, Macromolecules, 2014, 47, 1392–1402 CrossRef CAS.
- N. Li, Y. Huang, F. Du, X. He, X. Lin, H. Gao, Y. Ma, F. Li, Y. Chen and P. C. Eklund, Nano Lett., 2006, 6, 1141–1145 CrossRef CAS PubMed.
- N. F. Colaneri and L. W. Shacklette, IEEE Trans. Electromagn. Compat., 1992, 41, 291–297 Search PubMed.
- S. K. Dhawan, N. Singh and S. Venkatachalam, Synth. Met., 2002, 129, 261–267 CrossRef CAS.
- R. B. Schulz, V. C. Plantz and D. R. Brush, IEEE Trans. Electromagn. Compat., 1988, 30, 187–201 CrossRef.
- M. Sharma, M. P. Singh, C. Srivastava, G. Madras and S. Bose, ACS Appl. Mater. Interfaces, 2014, 6, 21151–21160 CAS.
- M. Rahaman, T. K. Chaki and D. Khastgir, J. Mater. Sci., 2011, 46, 3989–3999 CrossRef CAS.
- I.-S. Han, Y. Lee, H. Lee, H. Yoon and W. Kim, J. Mater. Sci., 2014, 49, 4522–4529 CrossRef CAS PubMed.
- M. H. Al-Saleha, W. H. Saadeha and U. Sundararaj, Carbon, 2013, 60, 146–156 CrossRef PubMed.
- V. Eswaraiah, V. Sankaranarayanan and S. Ramaprabhu, Macromol. Mater. Eng., 2011, 296, 894–898 CrossRef CAS.
Footnote |
| † GPK and SB made equal contribution to this work. |
| This journal is © The Royal Society of Chemistry 2015 |