 Open Access Article
Creative Commons Attribution 3.0 Unported Licence
Solution-processed boron subphthalocyanine derivatives as acceptors for organic bulk-heterojunction solar cells†
Bernd
Ebenhoch‡
a,
Nor B. A.
Prasetya‡
b,
Vincent M.
Rotello
c,
Graeme
Cooke
*b and
Ifor D. W.
Samuel
*a
aOrganic Semiconductor Centre, SUPA, School of Physics & Astronomy, University of St Andrews, St. Andrews, KY16 9SS, UK. E-mail: idws@st-andrews.ac.uk
bGlasgow Centre for Physical Organic Chemistry, WestCHEM, School of Chemistry, University of Glasgow, Glasgow, G12 8QQ, UK. E-mail: graeme.cooke@glasgow.ac.uk
cDepartment of Chemistry, University of Massachusetts Amherst, 710 Nt. Pleasant Street, Amherst, MA 01003, USA
First published on 5th March 2015
Abstract
We report the fabrication of solution-processed bulk heterojunction devices from subphthalocyanine (SubPc) units as the acceptor component and conventional polymeric donor materials such as MEH-PPV, P3HT and PTB7. The high solubility of the SubPc derivatives facilitated the formation of efficient donor/acceptor networks and provided power conversion efficiencies of 0.4% with MEH-PPV, 1.1% with P3HT and 3.5% with PTB7. A clear contribution of photon harvesting by the acceptor was identified from the external quantum efficiency spectra. Analysis of the current–voltage characteristics and photoluminescence quenching revealed trap-assisted and geminate recombination as a loss mechanism. Our results show that solution-processable SubPcs are a promising alternative to fullerenes for polymer solar cells.
Introduction
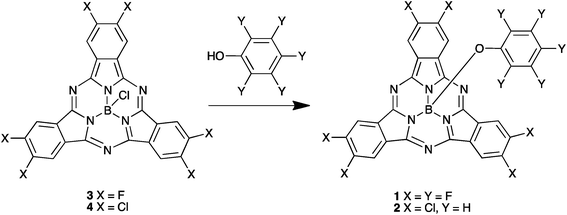
Solution-processed organic solar cells are attractive candidates for low-cost and large area light to electricity converters. The deposition of the active layer from solution has significant advantages over other methods, due to the high-speed production of roll-to-roll fabrication.1 Fullerenes have become the archetypal acceptor in efficient solution-processed bulk heterojunction (BHJ) devices. However, fullerenes have important limitations, such as high synthesis costs and a low absorption coefficient in the visible region of the solar spectrum.2 To address the issues associated with fullerene based acceptors, efforts have been directed towards the development of new acceptor systems and were thoroughly discussed in recent reviews.3–5 These systems are generally less efficient than fullerenes, principally due to strong aggregation, which increases the phase separation and lowers the power conversion efficiency (PCE) of their resulting devices.6,7Boron subphthalocyanine (SubPc)8 derivatives have received considerable interest in recent years due to their cone-shaped structure, which not only confers interesting physical properties, but also can prevent aggregation in the solution and solid state.9 These features coupled with their convenient synthesis have made SubPcs attractive building blocks for organic electronics,10 photonics11–13 and photovoltaics.14,15 Their incorporation into the active layer of solar cells is particularly attractive due to their high absorption coefficients in the visible region.10 Whereas SubPc molecules were originally used as donor materials in vacuum deposited solar cells, with C60,14,16,17 or C70![[thin space (1/6-em)]](https://www.rsc.org/images/entities/char_2009.gif) 18,19 as acceptor, their electron accepting properties have also recently been investigated20–22 and a high electron mobility of 8 × 10⁻³ cm2 V−1 s−1 has been reported.23 Solar cells containing SubPc molecules achieved the highest efficiency of 8.2% for fullerene-free solar cells.24 Whilst vacuum-processing has been effectively used to produce solar cells from SubPc derivatives,25 the good solubility characteristics of halogenated SubPc derivatives also makes these materials viable candidates for solution-processed BHJ solar cells.26,27 In this paper we report the synthetic procedures, chemical and optical properties and a comparison of the device properties of BHJ solar cells of halogenated SubPc derivatives 1 and 2 (Scheme 1).
18,19 as acceptor, their electron accepting properties have also recently been investigated20–22 and a high electron mobility of 8 × 10⁻³ cm2 V−1 s−1 has been reported.23 Solar cells containing SubPc molecules achieved the highest efficiency of 8.2% for fullerene-free solar cells.24 Whilst vacuum-processing has been effectively used to produce solar cells from SubPc derivatives,25 the good solubility characteristics of halogenated SubPc derivatives also makes these materials viable candidates for solution-processed BHJ solar cells.26,27 In this paper we report the synthetic procedures, chemical and optical properties and a comparison of the device properties of BHJ solar cells of halogenated SubPc derivatives 1 and 2 (Scheme 1).
Results and discussion
Synthesis
We have synthesized SubPc acceptors 1 and 2 according to Scheme 1. SubPc precursor derivatives 3 and 4 were prepared according to literature procedures described by Sullivan et al.20 Reaction with the appropriate phenol28 provided derivatives 1 and 2 in good yields as purple solids.Electrochemical properties
The electrochemical properties of the SubPc derivatives 1 and 2 were investigated using cyclic voltammetry (CV) and square wave voltammetry (SWV). Their SWVs are provided in Fig. 1 and the redox potentials and the derived estimates of the HOMO and LUMO energies are provided in Table 1. Both compounds 1 and 2 have a LUMO level of around −3.5 eV, which lies between typical donor materials (about −3.0 eV) and PCBM-based acceptors (about −3.7 eV). This LUMO level makes these materials interesting for applications as either donor or acceptor. We have therefore investigated both modes for solar cells. The HOMO levels are at −5.7 eV and −5.6 eV for 1 and 2 respectively, resulting in an electrochemical band gap of 2.2 eV and 2.1 eV, respectively.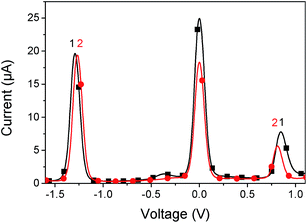 | ||
| Fig. 1 Square wave voltammogram of 1 (black line) and 2 (red line). The potential is referenced to ferrocene/ferrocenium redox couple = 0.0 V. | ||
| Compound | E (ox) (V) | E (red) (V) | HOMO(SWV) (eV) | LUMO(SWV) (eV) | HOMO(DFT) (eV) | LUMO(DFT) (eV) |
|---|---|---|---|---|---|---|
| 1 | 0.85 | −1.29 | −5.7 | −3.5 | −5.8 | −3.0 |
| 2 | 0.81 | −1.27 | −5.6 | −3.5 | −5.8 | −3.1 |
The DFT modelled structures of compounds 1 and 2 are provided in ESI Fig. S2.† The DFT-predicted HOMO and LUMO energies are in reasonable accordance with electrochemically determined values (Table 1). In line with previously reported DFT investigations, the HOMO is evenly distributed across the SubPc core, whereas the LUMO is less evenly distributed.29 Likewise, only limited contribution towards the LUMO/HOMO occurs from the peripheral halogens, whereas the axial phenoxy and the boron linker unit appear to provide no contributions whatsoever.
Optical properties
The absorption spectra in chlorobenzene show a pronounced peak at 553 nm and 571 nm for 1 and 2, respectively, which is red-shifted to 560 nm (1) and 582 nm (2) in films (see Fig. 2). This bathochromic shift is an indicator for intermolecular interactions.30 As the shift is rather small, these interactions are assumed not to play a significant role in film formation. The optical gap estimated from the absorption onset agrees well with the band gap estimated by voltammetry. The absorption coefficient reaches high values up to 3.5 × 105 cm−1 at the peak of 2 and 1.5 × 105 cm−1 at the peak of 1. In films a slight amount of scattering is observed from the offset at wavelengths above the band gap. An interesting aspect of these materials is the complete transparency in the region of 400 to 425 nm as observed by absorption measurements of chlorobenzene solutions and by probing the fluorescence emission for varying excitation wavelengths. Complete transparency can be beneficial for many measurement techniques, for example probing the dynamics of light absorption and charge generation where excitation of specifically the donor or acceptor is required. Both materials have a moderate photoluminescence quantum yield of about 13–16% in solution and low-loaded polystyrene blends (Table 2). In neat films the quantum yield dropped to around 2.5%. A considerable red shift is observed for the emission in films compared to that in solution, which could indicate aggregation, see Fig. 3.| PLQY (%) | 1 | 2 |
|---|---|---|
| Neat film | 2.4 | 2.6 |
| PS blend | 13.0 | 14.5 |
| Solution | 14.1 | 16.3 |
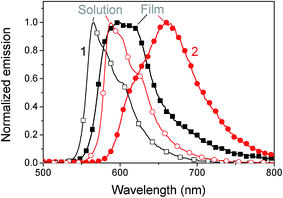 | ||
| Fig. 3 Normalized fluorescence of 1 (squares) and 2 (circles) in solution (open symbols) and films (filled symbols) at 360 nm excitation. | ||
Solubility and crystallization behaviour
A solution with a high concentration of 100 mg mL−1 of 1 or 2 in 1,2-dichlorobenzene was prepared and stirred under moderate heating of 50 °C to estimate the solubility of the two compounds. The chlorinated compound 2 quickly fully dissolved and no particles were found in a spin-coated film from this solution. Hence the solubility is clearly higher than 100 mg mL−1. The fluorinated compound 1 needed to be further diluted to dissolve completely. A quantitative measurement revealed a solubility of 45 mg mL−1.By investigating the films spin-coated from an incompletely dissolved solution of compound 1, large and homogenous crystals in the size of tens of micrometres were found. These also grew over time in initially homogenously spin-coated films in a period of about two days when left in air or nitrogen. We attribute this aggregation behaviour being due to the well-documented ability of organofluorine derivatives to undergo self-assembly through a range of non-covalent interactions such as C–F⋯H and C–F⋯π bonding.31 A representative image of the crystalline structures formed is shown in Fig. S3.†
SubPcs as acceptor
Devices with three different donor polymers, MEH-PPV, P3HT and PTB7, were fabricated to explore the usability of the SubPcs as acceptors. The results of the external quantum efficiency (EQE) of these devices are shown in Fig. 4. A significant contribution of acceptor absorption to the photocurrent is evident from the additional peak at 560 and 580 nm for acceptor 1 and 2, respectively. Absorption of light by the acceptor initially leads to the formation of singlet excitons which can then lead to charge generation by hole transfer to the donor. The lack of absorption of these acceptors in the deep blue region, between 350 nm and 450 nm, causes quite an unusual shape in the EQE spectra, where all curves reveal a valley. In the MEH-PPV solar cells the acceptor extends the EQE response of the solar cells beyond the absorption edge of MEH-PPV to a longer wavelength up to 600 nm with compound 1 and 650 nm with compound 2. To gain the full potential of these materials a further reduction of the band gap would be beneficial to achieve better coverage of the sun-spectrum. The PTB7 devices clearly resulted in the highest EQE of up to 43%, a surprising result given the small energy offset of the LUMO between PTB7 (3.3 eV) and the SubPc (3.5 eV). In all blends 2 was found to outperform 1, with a higher EQE.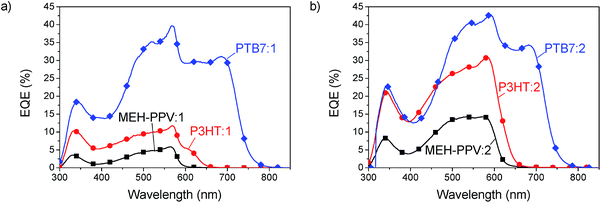 | ||
| Fig. 4 EQE spectra of MEH-PPV (squares), P3HT (circles) and PTB7 (diamonds) blended with compound 1 (a) and compound 2 (b). | ||
The JV-characteristics, shown in Fig. 5 indicate a very promising high open circuit voltage of 0.95 V for MEH-PPV, 0.6 V for P3HT and 0.90 V for PTB7 blended with compound 2. The efficiency thus reached 0.4% with MEH-PPV, 1.1% with P3HT and 3.5% with PTB7. With compound 1 the efficiencies were lower, as will be explained below, but showed the same trend. In all blends it was found that the device performance improved when the active layer was thermally annealed before deposition of the Ca/Al electrode. Details of the device fabrication and performance parameters are given in the Experimental section and ESI.†
 | ||
| Fig. 5 JV-characteristics of acceptors 1 (a) and 2 (b) blended with MEH-PPV (squares), P3HT (circles) and PTB7 (diamonds). | ||
Optimisation of PTB7:SubPc BHJ cells
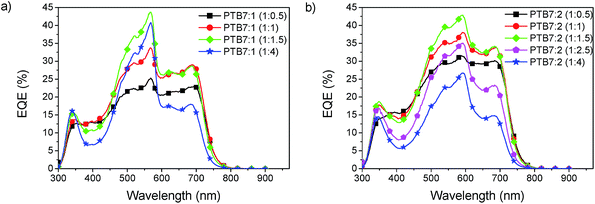
The morphology plays a critical role in obtaining high efficiency in BHJ solar cells. It is strongly influenced by the mass ratio of the donor and the acceptor, with the optimum depending on the materials used. Fig. 6 shows the EQE spectra for different blend ratios. For the devices of PTB7![[thin space (1/6-em)]](https://www.rsc.org/images/entities/char_2009.gif) :
:![[thin space (1/6-em)]](https://www.rsc.org/images/entities/char_2009.gif) 1 and PTB7
1 and PTB7![[thin space (1/6-em)]](https://www.rsc.org/images/entities/char_2009.gif) :
:![[thin space (1/6-em)]](https://www.rsc.org/images/entities/char_2009.gif) 2 the highest EQE had about 40% at a blend ratio of 1
2 the highest EQE had about 40% at a blend ratio of 1![[thin space (1/6-em)]](https://www.rsc.org/images/entities/char_2009.gif) :
:![[thin space (1/6-em)]](https://www.rsc.org/images/entities/char_2009.gif) 1.5. This blend ratio is identical to the one typically used for PTB7:PC71BM.32 The spectra show that the peak from the acceptor absorption strongly increases with increasing concentration, whereas the contribution from PTB7 decreases. As a trade-off between both contributions the ratio of 1
1.5. This blend ratio is identical to the one typically used for PTB7:PC71BM.32 The spectra show that the peak from the acceptor absorption strongly increases with increasing concentration, whereas the contribution from PTB7 decreases. As a trade-off between both contributions the ratio of 1![[thin space (1/6-em)]](https://www.rsc.org/images/entities/char_2009.gif) :
:![[thin space (1/6-em)]](https://www.rsc.org/images/entities/char_2009.gif) 1.5 was found best, gaining the maximum EQE over the entire spectrum.
1.5 was found best, gaining the maximum EQE over the entire spectrum.
The PTB7 solar cells were optimized with the annealing temperature varied between 100 °C and 160 °C with a constant time of 10 minutes. The efficiency for devices of PTB7:2, annealed at 160 °C improved by a factor of 1.25 compared to the non-annealed devices, due to an improvement of JSC and FF, whereas the performance of PTB7:1 remained fairly constant. Annealing generally gives the molecules free energy to assemble in the film and leads to a stronger phase separation. This phase separation can give rise to better charge transport of electrons and holes to the electrodes. To obtain the optimum conditions, we varied the duration of annealing from 0 to 20 minutes and kept the temperature of 160 °C constant. A clear optimum of the power conversion efficiency was achieved for the previously used 10 minutes, where the VOC and fill factor have a maximum.
Additionally the morphology can be altered by solvent additives. Previous studies on PTB7:PC71BM solar cells show that adding the solvent additive 1,8-diiodooctane (DIO) strongly enhances the power conversion efficiency.32 In the case of PTB7:PC71BM blends, it was found that the amount of 3 vol% of the additive gives the strongest improvement, but for other materials systems this amount can vary significantly.33 The concentration of DIO was thus varied between 0 vol% and 8 vol% to find the optimum conditions for our system. The efficiency of PTB7:1 had a maximum PCE of 1.9% at a concentration of 2 vol% DIO and PTB7:2 gave a maximum PCE of 3.5% at a concentration of 1 vol% DIO as shown in Fig. 7.
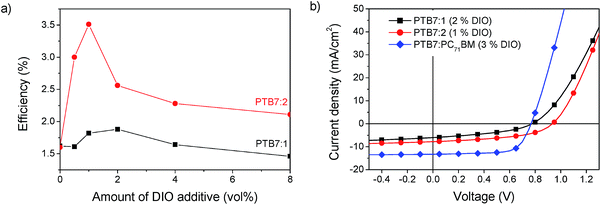 | ||
| Fig. 7 (a) Power conversion efficiency of PTB7:1 and PTB7:2 as a function of the amount of solvent additive DIO. (b) JV-curves of optimized solar cells in comparison to PTB7:PC71BM. | ||
Analysis of the loss mechanisms of the optimized devices
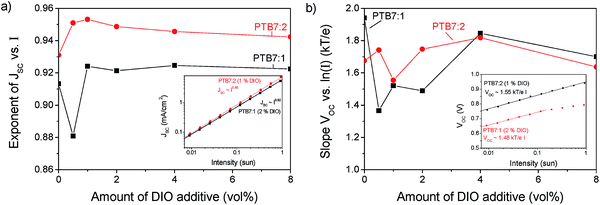
Through the device optimisation we reached a power conversion efficiency of 3.5% with PTB7:2 and 1.9% with PTB7:1. This is a very promising result for devices with a non-fullerene acceptor. To facilitate further developments of these acceptors, we investigated the prominent loss mechanisms in these blends. Comparing the optimized JV-curves of the present systems with PTB7:PC71BM shows a lower short circuit current density (JSC), which can be attributed to a loss of exciton dissociation, which will be discussed below. The fact that compound 2 absorbs further into the red part of the spectrum compared to compound 1 gives rise to a slight increase of 14% of the maximum obtainable short circuit current, determined from the integral of the normalized EQE spectra.PTB7:2 has a high open circuit voltage (VOC) of 0.94 V compared to PTB7:1 and PTB7:PC71BM, with both 0.76 V. The VOC is related to the effective band gap of the active layer, but as the HOMO and LUMO levels for compound 1 and 2 are very similar, the VOC should also be similar. Additionally the VOC is influenced by recombination in the active layer, a process that can be investigated by varying the light intensity of JV-curves.34,35Fig. 8 shows the variation of JSC and VOC on light intensity. From the exponent of JSCversus intensity the charge density dependent recombination can be qualitatively explored. An exponent of unity indicates that no bimolecular losses occur. The peak in the exponent for 1 vol% of DIO shows that for compound 2 a minimum of recombination occurs at the optimized concentration, whereas for PTB7:1 the trend is not clear. In devices fabricated using compound 2, the slope is higher for all concentrations of DIO indicating less intensity dependent recombination losses than for compound 1.
A similar method applies for the slope of VOCversus the logarithm of intensity (I), a lower slope indicates less trap-assisted recombination.35 In both blends a relatively high amount of trap assisted recombination is found with a slope of VOCversus ln(I) between 1.5 to 1.8kT/e, where kT/e is the thermal voltage. This behaviour shows that traps, which may originate from impurities or incomplete percolation pathways, have a significant impact on these solar cells. The recombination losses give rise to a reduced fill factor of about 45% compared to 70% for PTB7:PC71BM, which may originate from the lower charge carrier mobility observed for the P3HT:2 system using charge extraction measurements (ESI†).
Photoluminescence quenching
The study of photoluminescence can reveal geminate recombination losses of inefficient exciton dissociation, as the charge transfer between donor and acceptor deactivates the radiative decay, causing a decrease of the fluorescence. The steady state emission spectra for different blend ratios of PTB7:2, prepared with the optimized content of DIO and annealing conditions, are shown in Fig. 9. Two peaks of emission are present, the first at 650 nm which comes from compound 2 and the second at 800 nm from PTB7. For the blend ratio of 1![[thin space (1/6-em)]](https://www.rsc.org/images/entities/char_2009.gif) :
:![[thin space (1/6-em)]](https://www.rsc.org/images/entities/char_2009.gif) 0.5 the emission from compound 2 is completely quenched, indicating that all excitons created in 2 are efficiently dissociated. For the same blend a high emission of PTB7 is observed which shows inefficient exciton harvesting. Upon increasing the concentration of 2 the emission at 650 nm steadily increases. In contrast, the emission from PTB7 has a minimum at the blend ratio of 1
0.5 the emission from compound 2 is completely quenched, indicating that all excitons created in 2 are efficiently dissociated. For the same blend a high emission of PTB7 is observed which shows inefficient exciton harvesting. Upon increasing the concentration of 2 the emission at 650 nm steadily increases. In contrast, the emission from PTB7 has a minimum at the blend ratio of 1![[thin space (1/6-em)]](https://www.rsc.org/images/entities/char_2009.gif) :
:![[thin space (1/6-em)]](https://www.rsc.org/images/entities/char_2009.gif) 1.5 and then increases again. This clearly shows that for the blend ratio of 1
1.5 and then increases again. This clearly shows that for the blend ratio of 1![[thin space (1/6-em)]](https://www.rsc.org/images/entities/char_2009.gif) :
:![[thin space (1/6-em)]](https://www.rsc.org/images/entities/char_2009.gif) 1.5 most excitons are dissociated into free charges, however complete quenching is not observed at any of the blend ratios. Incomplete quenching of PTB7 can be caused by the rather low LUMO offset to the acceptor of only 0.3 eV and aggregation of the compound 2 at higher concentrations. For further developments of these acceptors we thus suggest to further tune the energy levels, as a slightly higher LUMO offset might be beneficial to improve exciton harvesting from the donor material.
1.5 most excitons are dissociated into free charges, however complete quenching is not observed at any of the blend ratios. Incomplete quenching of PTB7 can be caused by the rather low LUMO offset to the acceptor of only 0.3 eV and aggregation of the compound 2 at higher concentrations. For further developments of these acceptors we thus suggest to further tune the energy levels, as a slightly higher LUMO offset might be beneficial to improve exciton harvesting from the donor material.
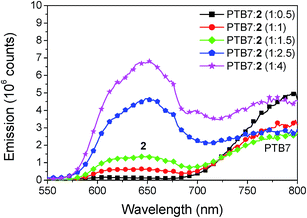 | ||
Fig. 9 Fluorescence emission spectra of PTB7![[thin space (1/6-em)]](https://www.rsc.org/images/entities/char_2009.gif) : :![[thin space (1/6-em)]](https://www.rsc.org/images/entities/char_2009.gif) 2 for varying blend ratio. The excitation wavelength was 280 nm. The emission at 650 originates from compound 2 and the emission at 800 nm from PTB7. 2 for varying blend ratio. The excitation wavelength was 280 nm. The emission at 650 originates from compound 2 and the emission at 800 nm from PTB7. | ||
Conclusions
We have reported solution-processed subphthalocyanine acceptors with up to 3.5% power conversion efficiency which is very favourable over previous reports of 0.1%.26 Other solution-processed non-fullerene acceptor systems typically give results between 2–4% PCE,3–5 although recently a PCE of 6.8% was reported.36 A strong contribution to the photocurrent by absorption in the acceptor phase was observed in all blends with MEH-PPV, P3HT and PTB7. This is a promising direction to enhance the absorption of the thin active layers often required for efficient charge transport and to provide complementary absorption with the donor component to cover a broad band of absorption. After a full optimization of the PTB7:SubPc devices, we identified three loss mechanisms limiting their solar cell efficiency. The first one is limited exciton dissociation especially from excitons created in the PTB7 phase. This loss can be improved by slightly increasing the LUMO offset in future acceptor materials. The second limitation is a high degree of trap-assisted recombination. This recombination can be potentially overcome by further reducing the aggregation and crystallization behaviour by appropriate peripheral (and axial) substitution, as it was observed that the chlorinated compound 2 gave a better performance than the fluorinated compound 1. The third issue is the relatively poor coverage of the solar spectrum that can be improved by reducing the band gap by utilising related derivatives such as subnaphthalocyanines.24,37,38 Following these directions gives a promising route for efficient fullerene-free and solution-processable polymer solar cells.Experimental
Chemical analysis
Melting points were determined in a Stuart Scientific Melting Point apparatus and are uncorrected. MS spectra were recorded using a Bruker microTOF Instrument. NMR spectra were recorded using a Bruker Ultrashield Spectrometer. Elemental analyses were obtained using an Exeter CE 440 Analytical Elemental Analyzer. Column chromatography was carried out using silica gel Si-60 (40–63 μm), and thin layer chromatography was performed on aluminium sheets pre-coated with silica gel (Merck).Synthesis
![[thin space (1/6-em)]](https://www.rsc.org/images/entities/char_2009.gif) :
:![[thin space (1/6-em)]](https://www.rsc.org/images/entities/char_2009.gif) 60) to afford SubPc 1 as a purple solid (0.38 g, 100%). mp > 300 °C, 1H NMR (CDCl3, 500 MHz) δ (ppm) 8.62 (t, J = 7.9 Hz, 6H); 13C NMR (CDCl3, 101 MHz) δ (ppm) 152.8 (dd, J = 257.4 Hz, 16.6 Hz), 150.3 (s), 127.2 (d, J = 2.9 Hz), 110.7 (m); MS (ESI) m/z: 687.1 [M + H]+; anal. calcd for C30H6BF11N6O: C 52.50%, H 0.88%, N 12.24%, found: C 52.56%, H 0.83%, N 12.14%.
60) to afford SubPc 1 as a purple solid (0.38 g, 100%). mp > 300 °C, 1H NMR (CDCl3, 500 MHz) δ (ppm) 8.62 (t, J = 7.9 Hz, 6H); 13C NMR (CDCl3, 101 MHz) δ (ppm) 152.8 (dd, J = 257.4 Hz, 16.6 Hz), 150.3 (s), 127.2 (d, J = 2.9 Hz), 110.7 (m); MS (ESI) m/z: 687.1 [M + H]+; anal. calcd for C30H6BF11N6O: C 52.50%, H 0.88%, N 12.24%, found: C 52.56%, H 0.83%, N 12.14%.
Cyclic and square wave voltammetry
CV and SWV measurements were performed on CH Instruments 440A electrochemical workstation. Voltammograms were recorded as DCM solutions (1 × 10⁻³ M) containing 0.1 M of tetrabutylammonium hexafluorophosphate as the supporting electrolyte. A platinum disc working electrode, a platinum wire counter electrode and a silver wire pseudo-reference electrode were used in all measurements. The redox potentials were referenced to the ferrocene/ferrocenium redox couple (adjusted to 0.0 V). The HOMO/LUMO energies were estimated from the redox potentials derived from SWV data, and were calculated using the relationships: E(HOMO) = (−4.8) − (E(ox)) and E(LUMO) = (−4.8) − (E(red)); where −4.8 eV is the E(HOMO) for Fc against the vacuum.39DFT calculations
DFT calculations were performed using the Spartan '14 (64 bit) software suite.40 Geometries were initially optimized semi-empirically (AM1) and then re-optimized using DFT (B3LYP/6-31G*). The resulting structures were shown to be local minima by inspection of their vibrational frequencies.Solubility and film quality
The quantitative solubility was measured according to the method described in the literature.41 Films were observed with a Nikon Eclipse LV100ND optical microscope.Absorption and fluorescence spectroscopy
Absorption spectra of low-concentrated solutions of chlorobenzene were recorded using a Cary 300 spectrometer and are corrected for the absorption of the solvent. Films were spin-coated from 20 mg mL−1 solutions of chlorobenzene at 1000 rpm and measured with the same instrument. The film thickness (d) was measured with a Dektak surface profilometer. The absorption coefficient, is estimated by A/d × ln(10), where A is the optical density of the film. Errors in the estimation of absorption coefficient are substantial because reflection and thin film interference effects are neglected, and because errors in the film thickness measurement are up to 20%. Emission spectra were recorded using an Edinburgh Instruments fluorimeter at 360 nm excitation. To obtain the quantum yield in solution the emission was compared to a reference of quinine sulphate following the description by Crosby et al., eqn (16).42 Film PLQY was measured with a Hamamatsu U6039-05 integrating sphere.Device fabrication
Glass substrates with a 4 mm wide central stipe of ITO (Xinyan Technology) were cleaned in acetone and isopropanol and plasma treated at 80 W for 3 minutes to remove organic contamination. PEDOT:PSS (poly(3,4-ethylenedioxythiophene):poly(styrenesulfonate) from Heraeus, Clevios VP AI 4083) was then spin-coated at 4000 rpm and baked at 120 °C for 10 minutes. The active layer was then spin coated in a nitrogen glove box at 1000 rpm. Annealing was performed in the glove box on a hot plate. The cathode consisting of 20 nm Ca and more than 100 nm Al was thermally evaporated at a rate lower than 0.5 nm s−1 and a pressure lower than 3 × 10⁻⁶ mbar. The active area, as the overlap of the ITO stripe and the cathode, was 8 mm2.As donor materials for the active layer MEH-PPV (poly[2-methoxy-5-(2-ethylhexyloxy)-1,4-phenylenevinylene] from Sigma Aldrich), P3HT (poly(3-hexylthiophene-2,5-diyl) from Rieke metals) and PTB7 (poly[[4,8-bis[(2-ethylhexyl)oxy] benzo[1,2-b:4,5-b′] dithiophene-2,6-diyl][3-fluoro-2-(2-ethylhexy)carbonyl] thieno[3,4-b]thiophenediyl]), from 1-Material) were used. The solutions contained MEH-PPV![[thin space (1/6-em)]](https://www.rsc.org/images/entities/char_2009.gif) :
:![[thin space (1/6-em)]](https://www.rsc.org/images/entities/char_2009.gif) 1 (1
1 (1![[thin space (1/6-em)]](https://www.rsc.org/images/entities/char_2009.gif) :
:![[thin space (1/6-em)]](https://www.rsc.org/images/entities/char_2009.gif) 5) and MEH-PPV
5) and MEH-PPV![[thin space (1/6-em)]](https://www.rsc.org/images/entities/char_2009.gif) :
:![[thin space (1/6-em)]](https://www.rsc.org/images/entities/char_2009.gif) 2 (1
2 (1![[thin space (1/6-em)]](https://www.rsc.org/images/entities/char_2009.gif) :
:![[thin space (1/6-em)]](https://www.rsc.org/images/entities/char_2009.gif) 3) with a concentration of 12 mg mL−1 in toluene, P3HT
3) with a concentration of 12 mg mL−1 in toluene, P3HT![[thin space (1/6-em)]](https://www.rsc.org/images/entities/char_2009.gif) :
:![[thin space (1/6-em)]](https://www.rsc.org/images/entities/char_2009.gif) SubPc (1
SubPc (1![[thin space (1/6-em)]](https://www.rsc.org/images/entities/char_2009.gif) :
:![[thin space (1/6-em)]](https://www.rsc.org/images/entities/char_2009.gif) 1) with a concentration of 20 mg mL−1 in 1,2-dichlorobenzene and PTB7
1) with a concentration of 20 mg mL−1 in 1,2-dichlorobenzene and PTB7![[thin space (1/6-em)]](https://www.rsc.org/images/entities/char_2009.gif) :
:![[thin space (1/6-em)]](https://www.rsc.org/images/entities/char_2009.gif) SubPc (1
SubPc (1![[thin space (1/6-em)]](https://www.rsc.org/images/entities/char_2009.gif) :
:![[thin space (1/6-em)]](https://www.rsc.org/images/entities/char_2009.gif) 0.5 to 1
0.5 to 1![[thin space (1/6-em)]](https://www.rsc.org/images/entities/char_2009.gif) :
:![[thin space (1/6-em)]](https://www.rsc.org/images/entities/char_2009.gif) 4) with a concentration of 20 mg mL−1 in 1,2-dichlorobenzene. MEH-PPV devices were annealed at 160 °C for 10 min. P3HT devices were annealed at 140 °C for 20 min. PTB7 devices shown in Fig. 4 and 5 were prepared from 1
4) with a concentration of 20 mg mL−1 in 1,2-dichlorobenzene. MEH-PPV devices were annealed at 160 °C for 10 min. P3HT devices were annealed at 140 °C for 20 min. PTB7 devices shown in Fig. 4 and 5 were prepared from 1![[thin space (1/6-em)]](https://www.rsc.org/images/entities/char_2009.gif) :
:![[thin space (1/6-em)]](https://www.rsc.org/images/entities/char_2009.gif) 1.5 blend ratio and annealed at 160 °C for 10 minutes with vol% of the additive DIO (1,8-diiodooctane from Sigma Aldrich). Fabrication details of the device optimisation are given in the main text. Devices of PTB7 blended with PC71BM ([6,6]phenyl C71 butyric acid methyl ester, from Solenne) were fabricated from a 1
1.5 blend ratio and annealed at 160 °C for 10 minutes with vol% of the additive DIO (1,8-diiodooctane from Sigma Aldrich). Fabrication details of the device optimisation are given in the main text. Devices of PTB7 blended with PC71BM ([6,6]phenyl C71 butyric acid methyl ester, from Solenne) were fabricated from a 1![[thin space (1/6-em)]](https://www.rsc.org/images/entities/char_2009.gif) :
:![[thin space (1/6-em)]](https://www.rsc.org/images/entities/char_2009.gif) 1.5 blend ratio, 20 mg mL−1 of 1,2-dichlorobenzene, with 3 vol% DIO and without annealing.
1.5 blend ratio, 20 mg mL−1 of 1,2-dichlorobenzene, with 3 vol% DIO and without annealing.
JV-Characterisation
Solar cell performance was measured under simulated sun-light from a Sciencetech class A simulator. The intensity was calibrated with an ORIEL reference cell (Model 91150V) with KG5 filter. A shadow mask was positioned in front of each device with the same size as the electrode overlap in order to avoid photocurrent contribution from outside the device area. The current–voltage characteristic was then measured with a Keithley 2400 sourcemeter. The spectral mismatch (of 0.950 for MEH-PPV:1, 0.952 for MEH-PPV:2, 1.002 for P3HT:1, 0.982 for P3HT:2, 0.917 for PTB7:1 and 0.901 for PTB7:2) was uncorrected. This means that the real power conversion efficiency of e.g. PTB7:2 is a factor of 1.1 higher than the quoted values in the text. A Cree LED was used as a dimmable light source and calibrated for linearity. The absolute intensity, at a setting of one sun, was obtained from the ratio of the short circuit current when the sample was illuminated by the LED and the short circuit current when illuminated with the solar simulator.EQE measurement
To obtain the external quantum yield, the devices were illuminated with monochromatic light through an optical fibre with dimensions smaller than the active area. The short circuit current of the test solar cell was then compared to an NPL calibrated reference photodiode.Acknowledgements
GC and IDWS thank the EPSRC for funding (Grant EP/I00243X). NBAP thanks Directorate General of Higher Education (DGHE) of Republic Indonesia for PhD Scholarship Grant (948/E4.4/K/2013). IDWS also acknowledges a Royal Society Wolfson Research Merit Award.References
- R. R. Søndergaard, M. Hösel and F. C. Krebs, J. Polym. Sci., Part B: Polym. Phys., 2013, 51, 16 CrossRef.
- A. Anctil, C. W. Babbitt, R. P. Raffaelle and B. J. Landi, Environ. Sci. Technol., 2011, 45, 2353 CrossRef CAS PubMed.
- A. F. Eftaiha, J.-P. Sun, I. G. Hill and G. C. Welch, J. Mater. Chem. A, 2014, 2, 1201 CAS.
- Y. Lin and X. Zhan, Mater. Horiz., 2014, 1, 470 RSC.
- P. Sonar, J. P. Fong Lim and K. L. Chan, Energy Environ. Sci., 2011, 4, 1558 CAS.
- S. Rajaram, R. Shivanna, S. K. Kandappa and K. S. Narayan, J. Phys. Chem. Lett., 2012, 3, 2405 CrossRef CAS.
- Y. Liu, C. Mu, K. Jiang, J. Zhao, Y. Li, L. Zhang, Z. Li, J. Y. L. Lai, H. Hu, T. Ma, R. Hu, D. Yu, X. Huang, B. Z. Tang and H. Yan, Adv. Mater., 2015, 27, 1015 CrossRef CAS PubMed.
- C. G. Claessens, D. González-Rodríguez, M. S. Rodríguez-Morgade, A. Medina and T. Torres, Chem. Rev., 2014, 114, 2192 CrossRef CAS PubMed.
- H. Xu, X.-J. Jiang, E. Y. M. Chan, W.-P. Fong and D. K. P. Ng, Org. Biomol. Chem., 2007, 5, 3987 CAS.
- G. E. Morse and T. P. Bender, ACS Appl. Mater. Interfaces, 2012, 4, 5055–5068 CAS.
- A. Sastre, T. Torres, M. A. Diaz-Garcia, F. Agulló-López, C. Dhenaut, S. Brasselet, I. Ledoux and J. Zyss, J. Am. Chem. Soc., 1996, 118, 2746 CrossRef CAS.
- D. Dini, S. Vagin, M. Hanack, V. Amendola and M. Meneghetti, Chem. Commun., 2005, 3796 RSC.
- D. D. Díaz, H. J. Bolink, L. Cappelli, C. G. Claessens, E. Coronado and T. Torres, Tetrahedron Lett., 2007, 48, 4657 CrossRef PubMed.
- K. L. Mutolo, E. I. Mayo, B. P. Rand, S. R. Forrest and M. E. Thompson, J. Am. Chem. Soc., 2006, 128, 8108 CrossRef CAS PubMed.
- M. G. Walter, A. B. Rudine and C. C. Wamser, J. Porphyrins Phthalocyanines, 2010, 14, 759 CrossRef CAS.
- H. Kumar, P. Kumar, R. Bhardwaj, G. D. Sharma, S. Chand, S. C. Jain and V. Kumar, J. Phys. D: Appl. Phys., 2009, 42, 015103 CrossRef.
- C.-F. Lin, V. M. Nichols, Y.-C. Cheng, C. J. Bardeen, M.-K. Wei, S.-W. Liu, C.-C. Lee, W.-C. Su, T.-L. Chiu, H.-C. Han, L.-C. Chen, C.-T. Chen and J.-H. Lee, Sol. Energy Mater. Sol. Cells, 2014, 122, 264 CrossRef CAS PubMed.
- R. Pandey, Y. Zou and R. J. Holmes, Appl. Phys. Lett., 2012, 101, 033308 CrossRef PubMed.
- C.-C. Lee, S.-W. Liu, C.-W. Cheng, W.-C. Su, C.-C. Chou, C.-F. Lin and C.-T. Chen, Int. J. Photoenergy, 2013, 2013, 585196 Search PubMed.
- P. Sullivan, A. Duraud, I. Hancox, N. Beaumont, G. Mirri, J. H. R. Tucker, R. A. Hatton, M. Shipman and T. S. Jones, Adv. Energy Mater., 2011, 1, 352 CrossRef CAS.
- C. Romero-Nieto, A. Medina, A. Molina-Ontoria, C. G. Claessens, L. Echegoyen, N. Martín, T. Torres and D. M. Guldi, Chem. Commun., 2012, 48, 4953 RSC.
- N. Beaumont, J. S. Castrucci, P. Sullivan, G. E. Morse, A. S. Paton, Z.-H. Lu, T. P. Bender and T. S. Jones, J. Phys. Chem. C, 2014, 118, 14813 CAS.
- J. S. Castrucci, M. G. Helander, G. E. Morse, Z.-H. Lu, C. M. Yip and T. P. Bender, Cryst. Growth Des., 2012, 12, 1095 CAS.
- K. Cnops, B. P. Rand, D. Cheyns, B. Verreet, M. A. Empl and P. Heremans, Nat. Commun., 2014, 5, 3406 Search PubMed.
- G. E. Morse, A. S. Paton, A. Lough and T. P. Bender, Dalton Trans., 2010, 3915 RSC.
- B. Ma, Y. Miyamoto, C. H. Woo, J. M. J. Fréchet, F. Zhang and Y. Liu, ed. Z. H. Kafafi and P. A. Lane, Proc. SPIE 7416, Organic Photovoltaics X, 2009, 74161E Search PubMed.
- C. E. Mauldin, C. Piliego, D. Poulsen, D. A. Unruh, C. Woo, B. Ma, J. L. Mynar and J. M. J. Fréchet, ACS Appl. Mater. Interfaces, 2010, 2, 2833 CAS.
- G. E. Morse and T. P. Bender, Inorg. Chem., 2012, 51, 6460 CrossRef CAS PubMed.
- G. E. Morse, M. G. Helander, J. Stanwick, J. M. Sauks, A. S. Paton, Z.-H. Lu and T. P. Bender, J. Phys. Chem. C, 2011, 115, 11709 CAS.
- K. Shirai, M. Matsuoka and K. Fukunishi, Dyes Pigm., 1999, 42, 95 CrossRef CAS.
- R. Berger, G. Resnati, P. Metrangolo, E. Weber and J. Hulliger, Chem. Soc. Rev., 2011, 40, 3496 RSC.
- Y. Liang, Z. Xu, J. Xia, S.-T. Tsai, Y. Wu, G. Li, C. Ray and L. Yu, Adv. Mater., 2010, 22, E135 CrossRef CAS PubMed.
- G. Ren, E. Ahmed and S. A. Jenekhe, Adv. Energy Mater., 2011, 1, 946 CrossRef CAS.
- A. Maurano, R. Hamilton, C. G. Shuttle, A. M. Ballantyne, J. Nelson, B. O'Regan, W. Zhang, I. McCulloch, H. Azimi, M. Morana, C. J. Brabec and J. R. Durrant, Adv. Mater., 2010, 22, 4987 CrossRef CAS PubMed.
- S. R. Cowan, A. Roy and A. J. Heeger, Phys. Rev. B: Condens. Matter Mater. Phys., 2010, 82, 245207 CrossRef.
- Y. Lin, J. Wang, Z.-G. Zhang, H. Bai, Y. Li, D. Zhu and X. Zhan, Adv. Mater., 2015, 27, 1170 CrossRef CAS PubMed.
- G. Chen, H. Sasabe, T. Sano, X.-F. Wang, Z. Hong, J. Kido and Y. Yang, Nanotechnology, 2013, 24, 484007 CrossRef PubMed.
- S. Shimizu and N. Kobayashi, Chem. Commun., 2014, 50, 6949 RSC.
- J. Pommerehne, H. Vestweber, W. Guss, R. F. Mahrt, H. Bässler, M. Porsch and J. Daub, Adv. Mater., 1995, 7, 551 CrossRef CAS.
- Wavefunction Inc., 18401 Von Karman Ave., Suite 370, Irvine, CA 92612, USA.
- P. A. Troshin, H. Hoppe, J. Renz, M. Egginger, J. Y. Mayorova, A. E. Goryachev, A. S. Peregudov, R. N. Lyubovskaya, G. Gobsch, N. S. Sariciftci and V. F. Razumov, Adv. Funct. Mater., 2009, 19, 779 CrossRef CAS.
- G. A. Crosby and J. N. Demas, J. Phys. Chem., 1971, 75, 991 CrossRef CAS.
Footnotes |
| † Electronic supplementary information (ESI) available. See DOI: 10.1039/c5ta00715a |
| ‡ These authors contributed equally. |
| This journal is © The Royal Society of Chemistry 2015 |

