Room temperature sequential ionic deposition (SID) of Ag2S nanoparticles on TiO2 hierarchical spheres for enhanced catalytic efficiency†
Received
5th December 2014
, Accepted 11th February 2015
First published on 11th February 2015
Abstract
Porous TiO2 hierarchical spheres with high surface area synthesized via a solvothermal method were successfully modified with an Ag2S co-catalyst by a sequential ionic deposition (SID) method at room temperature. The presence of Ag2S facilitated efficient charge separation, thus reducing recombination and enhancing the photocatalytic activity of the photocatalyst. The enhanced photocatalytic performance was demonstrated by water splitting where hydrogen (H2) gas was produced at an evolution rate of 708 μmol h−1 g−1 and methyl orange was degraded with a rate constant of 0.018 min−1. This is the first time that photocatalytic water splitting using a suspension system has been demonstrated on a Ag2S/TiO2 hierarchical heterostructure and the material shows stability in its photocatalytic performance despite being recycled several times. The composite material presents properties which are highly promising for the generation of clean energy and environmental clean up applications.
Introduction
There is currently a pressing demand around the globe for photocatalysts capable of generating H2 as a form of clean and renewable energy source, and also responding to environmental cleaning needs (e.g. wastewater treatment). Titanium(IV) dioxide (TiO2) has always been a material highly regarded for its photocatalytic properties on top of being cheap, non-toxic and environmentally friendly.1 Degussa P25 may have demonstrated a decent performance in photocatalysis,2 but hierarchical structures such as hierarchical spheres have shown an enhanced performance in photocatalytic H2 production due to their high surface area, and also the ability to entrap incident radiation due to the light scattering effect.3 Moreover, such hierarchical spheres possess the advantages of short diffusion length for photocatalytic reactions, and high porosity and stability offered by the robust 3D architecture.4 However, the performance is still far from satisfactory when compared to other photocatalytic materials and the two main reasons are the wide band gap of TiO2 and high recombination rate of the photogenerated electrons and holes.5 To enhance the photocatalytic performance, co-catalysts can be loaded on the TiO2 hierarchical structures to solve both problems. Besides loading nanoparticles of expensive noble metals,6 metal-oxides and sulfides, which are equally if not more effective, can also be used as cheaper alternatives.7,8 In recent years, the development of sulfides as both the core photocatalytic material as well as co-catalysts has attracted increasing amounts of attention.9–11 Silver sulfide (Ag2S), having a direct band gap of 1.0 eV,12 is a potential candidate as a co-catalyst of TiO2. Its conduction band (−0.3 eV) is less anodic than the corresponding TiO2 band (−0.1 eV), and its valence band (+0.7 eV) is more cathodic than the TiO2 valence band (+3.1 eV).13 In addition, α-Ag2S possesses negligible toxicity compared to other commonly used narrow band gap materials.14 Several studies have reported Ag2S loading on TiO2, however, most of them only demonstrated its use in the photocatalytic degradation of dyes and organic materials,15,16 or its use in photoelectrochemical water splitting.17–20 To the best of our knowledge, no paper has reported or investigated its use in photocatalytic water splitting in a photocatalyst suspension system.
One way to synthesize Ag2S nanoparticles is via the SID method which is a simple fabrication methodology that can be carried out at room temperature and normal atmospheric pressure. The overall process is not only cost-effective, it also does not include any toxic by-product making it environmentally friendly, and the density of nanoparticles deposited can be easily controlled by merely varying the deposition cycles. A typical process involves immersing the host photocatalytic material into silver nitrate (AgNO3) and thiourea (SC(NH2)2) solutions successively for as many cycles as desired to achieve a uniform deposition of Ag2S nanoparticles on the host material with good heterojunction. The good interface will promote the transfer of charge carriers between the host photocatalytic material and the co-catalysts, hence producing excellent photocatalytic performance.
In this paper, Ag2S is synthesized as a co-catalyst of TiO2 hierarchical spheres using the SID method. The number of loading cycles is varied to investigate the various loading densities and derive the optimal density of Ag2S nanoparticles for photocatalytic water splitting. The best sample was recycled 5 times to demonstrate its reusability and stability. The performance of the Ag2S/TiO2 composite in the degradation of organic pollutants was also demonstrated via the photodegradation of methyl orange (MO).
Experimental
Synthesis of TiO2 hierarchical spheres
TiO2 hierarchical spheres were synthesized by a solvothermal method following Wu et al.'s work.4 6 ml of dimethylformamide (DMF, Alfa Aesar) was mixed with 20 ml of isopropanol (IPA, HPLC grade, Tokyo Chemical) under stirring. 1 ml of titanium n-butoxide (TBT, Sigma Aldrich) was then added to the mixture and stirred. The mixture was transferred to a Teflon-lined autoclave and heated at 200 °C for 3 h. The synthesized product was washed and centrifuged 3 times with ethanol. After drying at 90 °C for 3 h, the TiO2 hierarchical spheres were annealed at 450 °C for 2 hours at a ramp rate of 5 °C min−1 to obtain anatase TiO2 hierarchical spheres.
Loading of Ag2S nanoparticles
The Ag2S nanoparticles were loaded on the TiO2 hierarchical spheres at room temperature using the SID method. AgNO3 serves as the precursor for Ag+ ions, while SC(NH2)2 is the precursor for S2− ions. AgNO3 was dissolved in ethanol to produce a solution of 0.05 M concentration while SC(NH2)2 was dissolved in methanol to produce a 0.05 M solution. Ethanol and methanol were used instead of water as solvents because of their lower surface tension and high wetting ability which promotes the superior penetration ability of the reacting solution deeply into the pores, resulting in uniform assembly of Ag2S nanoparticles on the TiO2 hierarchical spheres. The TiO2 hierarchical spheres were dispersed in the AgNO3 solution and magnetically stirred for 1 min as shown in Scheme 1(a). The hierarchical spheres were then centrifuged and washed with ethanol to remove loosely bound and excess precursor solution, before placing into the SC(NH2)2 solution and stirring for 3 min. The rinsing step also helps to prevent homogeneous precipitation of Ag2S in the solution. The hierarchical spheres were then centrifuged and washed with methanol. This entire process constitutes 1 cycle of Ag2S loading. The TiO2 hierarchical spheres were loaded with Ag2S through 1 to 5 loading cycles, and the samples are denoted as n-Ag2S/TiO2, where n represents the number of loading cycles. The photocatalyst became darker in colour as the number of cycles increased (Scheme 1(b)). The samples were then dried at 60 °C for 2 hours to complete the loading process.
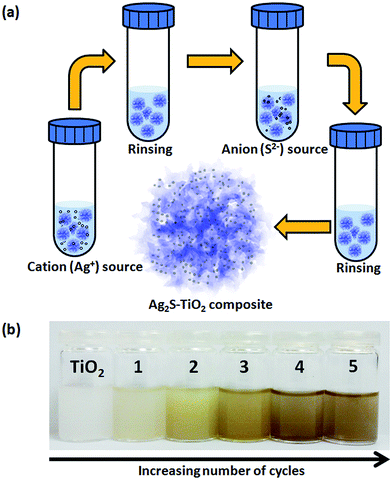 |
| | Scheme 1 (a) Schematic illustration of the SID process in each cycle of Ag2S deposition and (b) changes in the color of the composite with an increasing number of cycles. | |
Photocatalytic testing (water splitting and MO degradation)
The photocatalytic activity of the composites was investigated by dispersing the photocatalysts in a methanol–water solution and illuminating with simulated solar light. 2 mg of n-Ag2S/TiO2 was dispersed in 10 ml of 10% v/v methanol–water solution by sonication in a cylindrical quartz reaction cell (volume 25 ml) which was sealed with a rubber septum. The cell was purged with argon (Ar) gas for 10 min and then irradiated using a 300 W xenon arc lamp (intensity 100 mW cm−2) with magnetic stirring. Gas samples were extracted using a 100 μl gas tight syringe and analyzed with a gas chromatograph (GC2010). For the photodegradation of MO, 15 mg of photocatalyst was dispersed in 15 ml of 0.015 mM aqueous MO solution in the cylindrical quartz reaction cell by sonication. The mixture was then magnetically stirred in the dark for 30 min to attain complete adsorption–desorption equilibrium, before being illuminated using a 300 W xenon arc lamp. The concentration of MO was determined using a UV-vis-NIR spectrophotometer and the maximum absorbance peak value at 462.5 nm was used to plot the amount of MO degraded and thus, determine the photodegradation activity of the composite. Photocatalytic experiments under visible irradiation were carried out with a cut-off filter (λ > 400 nm). After completion of the photocatalytic experiments, the reaction mixtures were centrifuged to separate the photocatalysts from the reaction mixture and disposed properly.
Material characterisation
The morphology of the n-Ag2S/TiO2 composite was characterized by using a scanning electron microscope (SEM, JEOL FEG JSM 7001F) operating at 15 kV. The crystal structure of the composite was investigated by using a transmission electron microscope (TEM, Philips FEG CM300) operating at 200 kV and an X-ray diffractometer (XRD, D5005 Bruker X-ray diffractometer equipped with graphite-monochromated Cu Kα radiation at λ = 1.541 Å). Elemental composition was studied using energy-dispersive X-ray spectroscopy (EDX, Oxford Instruments) while the valence states of the various elements were determined through X-ray photoelectron spectroscopy (XPS). A UV-vis-NIR spectrophotometer (UV-vis, Shimadzu UV-3600) was used to measure the absorbance characteristics of the composites and MO solution. The gas samples from the photocatalytic experiments were analyzed by gas chromatography (Shimadzu GC2010 TCD) to determine the amount of H2 gas produced. Brunauer–Emmett–Teller (BET, Quantachrome Nova 1200) measurements were conducted with nitrogen (N2) as the adsorbate at liquid nitrogen temperature.
Results and discussion
The TiO2 nanostructures initially obtained by the solvothermal synthesis method were layered protonated titanate hierarchical spheres (LTHSs) constructed from thin curved nanosheets.4 After annealing at 450 °C in air, the LTHSs were converted to porous titania hierarchical spheres (PTHSs) which were assembled from small anatase crystallites as shown in Fig. 1(a) and (b). The disappearance of the nanosheets in PTHSs could probably be attributed to the recrystallization of pristine LTHSs into the anatase phase and the sintering process that takes place in the relatively fragile ultrathin nanosheets. The structure of the PTHSs could be observed more clearly in TEM (Fig. 1(c) and (d)). The clear lattice fringes observed in Fig. 1(d) indicate the crystallinity of the TiO2 hierarchical spheres, and the lattice spacing of 0.35 nm is in agreement with the values for the (101) lattice planes of tetragonal anatase TiO2.21 The TiO2 hierarchical spheres exhibit a better H2 production performance when compared to commercial Degussa P25 and TiO2 nanotubes (synthesized based on previous work)22 as shown in Fig. 1(e). The SEM images in the insets of Fig. 1(e) show the morphologies of the various TiO2 nanostructures. P25 has a H2 evolution rate of 70 μmol h−1 g−1 while TiO2 nanotubes produced H2 at a higher rate of 100 μmol h−1 g−1. The as-synthesized TiO2 hierarchical spheres could produce H2 at an improved rate of 167 μmol h−1 g−1. BET measurements of the 3 TiO2 nanostructures revealed specific surface areas of 48, 154 and 71 m2 g−1 for the P25, TiO2 nanotubes and TiO2 hierarchical spheres respectively. Despite not having the highest surface area, TiO2 hierarchical spheres still showed the highest H2 evolution rate due to the faster electron transport rates and slower recombination rates, and also the considerable surface area which facilitates better access and diffusion of liquid and gaseous reactants, which is beneficial for the photocatalytic activity.23 The hierarchical structure also favors the harvesting of light due to multiple scattering within the framework.24–26 The photocatalytic performance of the TiO2 hierarchical spheres can be further improved by loading Ag2S as a co-catalyst on it.
 |
| | Fig. 1 (a) and (b) SEM images, (c) TEM and (d) HRTEM images of TiO2 hierarchical spheres. (e) H2 evolution rates of various types of TiO2 nanostructures. The insets show the SEM images of the various TiO2 nanostructures (scale bar indicates 100 nm). | |
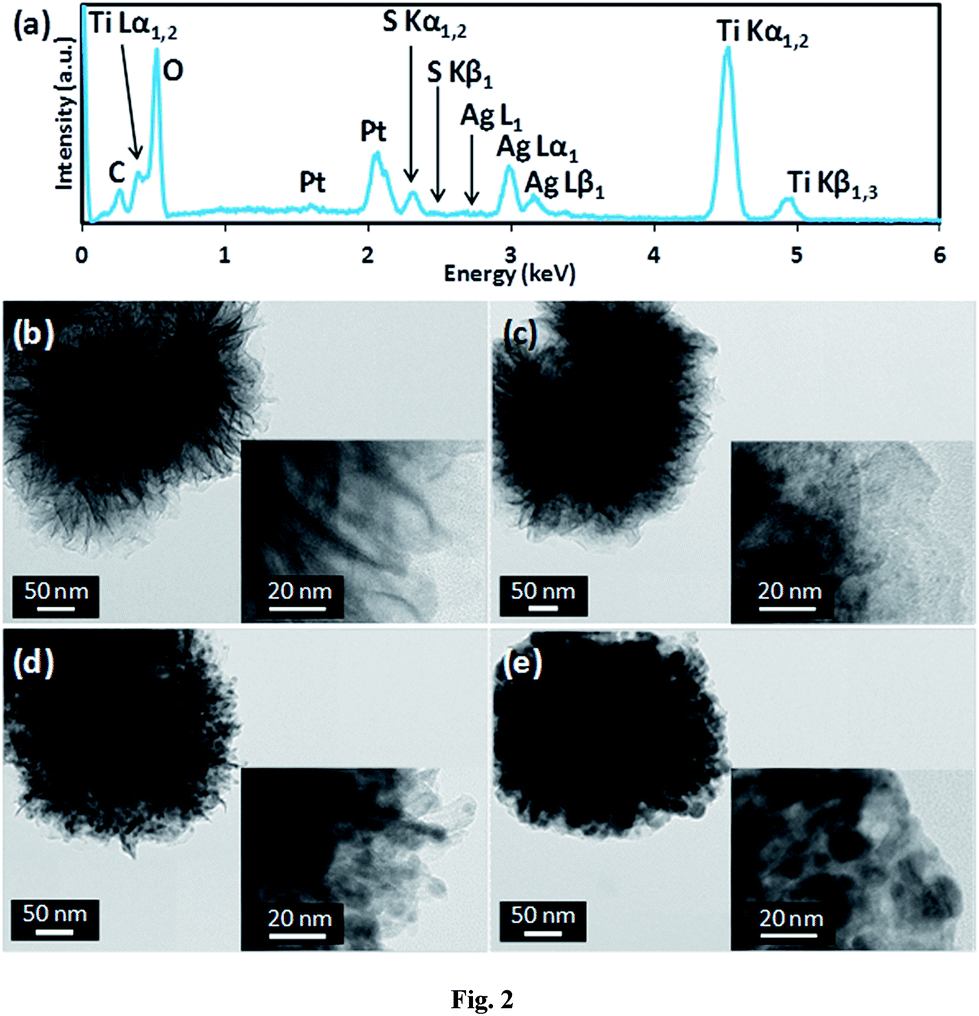
Ag2S nanoparticles were loaded onto the TiO2 hierarchical spheres as co-catalysts by the SID method at room temperature. When the TiO2 hierarchical spheres are dispersed in AgNO3 solution and magnetically stirred, the Ag+ ions are adsorbed on the surface of the TiO2 crystallites. The loosely bound and excess Ag+ ions were then removed by rinsing in ethanol. The Ag+ coated TiO2 hierarchical spheres were subsequently stirred in SC(NH2)2 solution which provides the S2− ions to form Ag2S nanoparticles. The Ag+ ions react with the S2− ions to form Ag2S nanoparticles on the surface of the TiO2 hierarchical spheres. The density of Ag2S nanoparticles deposited on the surface of the TiO2 hierarchical spheres can be varied by varying the number of loading cycles from 1 to 5. The EDX spectra in Fig. 2(a) shows the presence of Ag and S in 3-Ag2S/TiO2, indicating that Ag2S nanoparticles were successfully deposited. Prominent peaks of Ti Lα1,2 at 0.45 keV, Ti Kα1,2 at 4.51 keV and Ti Kβ1,3 at 4.93 eV due to the TiO2 hierarchical spheres were clearly observed in the spectra. Several peaks related to Ag and S were also detected: Ag L1 at 2.63 keV, Ag Lα1 at 2.98 keV, Ag Lβ1 at 3.15 keV, S Kα1,2 at 2.31 keV and S Kβ1 at 2.46 keV. The Pt peaks originated from the sputtered Pt for enhancement of the image contrast. From the EDX spectra, it can be seen that the SID method is a reliable method to deposit Ag2S nanoparticles onto TiO2 hierarchical spheres. The atomic% of Ag and S on the Ag2S/TiO2 composites is presented in Table 1. The atomic% of Ag and S on the TiO2 hierarchical spheres was found to increase as the number of loading cycles increases, indicating a higher density of Ag2S nanoparticles with more loading cycles. This observation is supported by the TEM images in Fig. 2(b)–(e) which show the distribution and density of Ag2S on the LTHSs with loading cycles of 1, 3 and 5 respectively at both low and high (insets of Fig. 2(b)–(e)) magnifications. From the TEM images, the density of Ag2S nanoparticles is observed to increase with an increasing number of loading cycles. It should be noted that the Ag2S nanoparticles were intentionally loaded on LTHSs instead of PTHSs solely for TEM imaging purposes. In doing so, the darker contrast of the Ag2S nanoparticles could be seen clearly against the lighter contrast of the nanosheets in the LTHSs. All other characterization and performance measurements were conducted using PTHSs loaded with Ag2S.
 |
| | Fig. 2 (a) EDX spectrum of 3-Ag2S/TiO2. (b)–(e) Low magnification TEM images of TiO2, 1-, 3- and 5-Ag2S/TiO2 respectively. The insets show the high magnification TEM images of the corresponding composite. | |
Table 1 EDX elemental microanalysis of the n-Ag2S/TiO2 composites
| Sample name |
Atomic (%) |
| Ag (%) |
S (%) |
| 1-Ag2S/TiO2 |
0.15 |
0.06 |
| 2-Ag2S/TiO2 |
0.87 |
0.41 |
| 3-Ag2S/TiO2 |
1.37 |
0.66 |
| 4-Ag2S/TiO2 |
1.95 |
0.98 |
| 5-Ag2S/TiO2 |
2.67 |
1.23 |
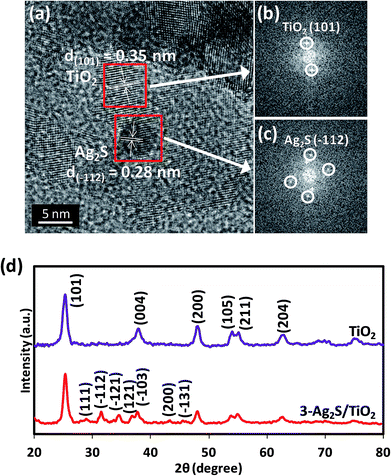
Fig. 3(a) shows a HRTEM image of 3-Ag2S/TiO2 where the lattice planes of the anatase TiO2 and the Ag2S can be clearly observed, indicating that the composite is highly crystalline and a good interface exists between Ag2S and TiO2. The diameter of the Ag2S nanoparticle was measured to be about 5 nm. A lattice spacing of 0.35 nm was determined by the fast Fourier transform (FFT) pattern (Fig. 3(b)) and could be attributed to the (101) plane of anatase TiO221 while the d-spacing of 0.23 nm corresponds to the (−112) plane of Ag2S (Fig. 3(c)).27 The crystalline structure of the composite is also shown by the XRD spectra in Fig. 3(d). The peaks at 25.45, 38.05, 48.25, 54.15, 55.15 and 62.95°, can be indexed to the (101), (004), (200), (105), (211) and (204) crystal planes of the anatase phase of TiO2 (JCPDS card no. 21-1272) respectively, and these peaks are observed for both TiO2 and 3-Ag2S/TiO2. The (111), (−112), (−121), (121), (−103), (200) and (−131) diffraction peaks at 28.97, 31.52, 34.38, 36.81, 37.72, 43.41 and 45.42° respectively can be indexed to monoclinic Ag2S (JCPDS card no. 14-0072).
 |
| | Fig. 3 (a) HRTEM image of 3-Ag2S/TiO2. FFT of (b) TiO2 and (c) 3-Ag2S/TiO2. (d) XRD pattern of TiO2 and 3-Ag2S/TiO2. | |
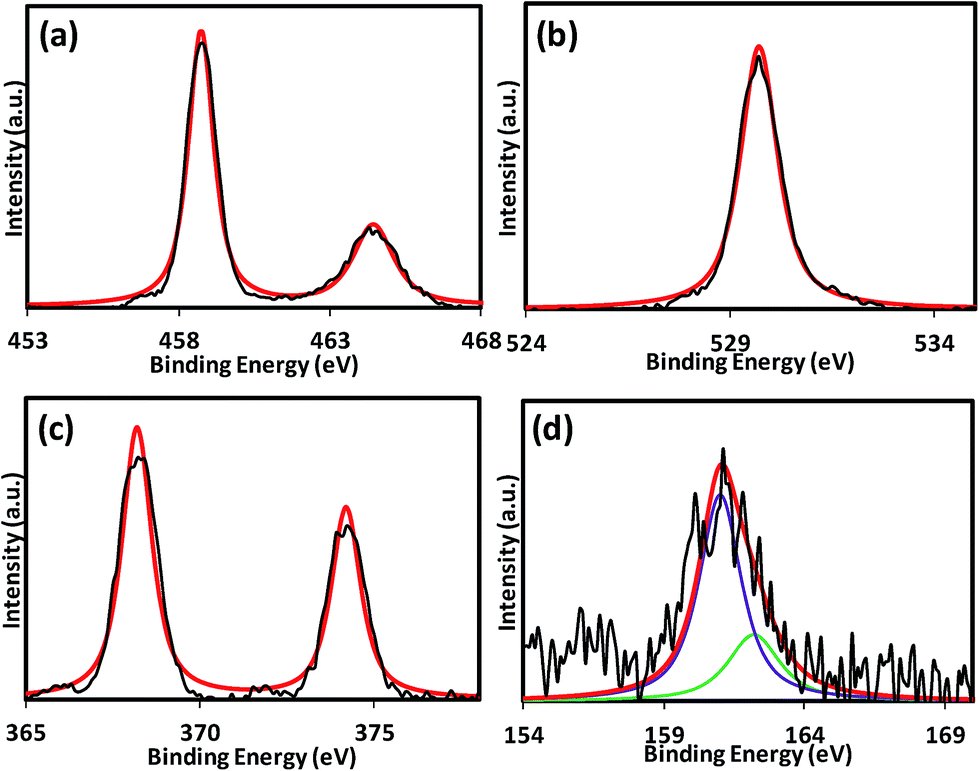
XPS was also carried out to determine the valence states of the elements present in TiO2 (not shown here) and the 3-Ag2S/TiO2 composite (Fig. 4). Ti and O were detected in TiO2 and the 3-Ag2S/TiO2 composite as shown in Fig. 4(a) and (b). The Ti 2p3/2 and 2p1/2 peaks observed at 458.8 and 464.4 eV respectively indicate that Ti is present as Ti4+ in the form of TiO2. The O 1s peak located at 529.7 eV is attributed to the Ti–O–Ti bond, supporting the presence of TiO2.28 Ag and S were not detected in the XPS spectra of the TiO2 hierarchical spheres but were present in the 3-Ag2S/TiO2 composite. The Ag 3d5/2 and 3d3/2 peaks (Fig. 4(c)) were observed to be located at 368.2 and 374.2 eV respectively. The Ag 3d peaks located at these 2 energy levels indicate the presence of Ag in the state of Ag+. No metallic Ag was present in the composite. The S 2p peak (Fig. 4(d)) can be deconvoluted into S 2p3/2 (159.6 eV) and 2p1/2 (160.8 eV) which indicates that S is present as S2−. From the Ag 3d and S 2p peaks, it can be concluded that Ag and S are present as Ag2S.17
 |
| | Fig. 4 XPS spectra of 3-Ag2S/TiO2 composite. (a) Ti 2p, (b) O 1s, (c) Ag 3d and (d) S 2p. | |
BET measurements were carried out on the TiO2 hierarchical spheres and 3-Ag2S/TiO2 to investigate the textural characteristics. The N2 adsorption–desorption isotherms are shown in Fig. 5(a) and (b), and the insets show the corresponding pore size distribution. The isotherms can be categorized as type IV with small hysteresis loops observed at a relative pressure of 0.4 to 0.9. The BET specific surface area obtained from the TiO2 hierarchical spheres is 71 m2 g−1 with a total pore volume of 0.28 cm3 g−1 while that of 3-Ag2S/TiO2 is 63 m2 g−1 with a total pore volume of 0.33 cm3 g−1. The TiO2 hierarchical spheres have pores with a diameter of 5.78 nm while the 3-Ag2S/TiO2 has a larger pore size at 12.49 nm. The slight decrease in the surface area can be attributed to the deposition of Ag2S nanoparticles in the pores of the TiO2 hierarchical spheres. This suggests that the photocatalytic activity is not affected by the slight decrease in the surface area of the composite, and the enhancement in performance is mainly due to the alignment of the energy levels and charge transfer at the Ag2S/TiO2 interface. The absorption spectra of the n-Ag2S/TiO2 composite are shown in Fig. 5(c). The TiO2 hierarchical spheres exhibited an absorption band edge at 380 nm which is in accordance with its large band gap of 3.2 eV, and the absorption in the visible range was weak. However, after loading Ag2S, the absorption in the visible range increased without any observable shift in the band gap. The increase in absorption is attributed to the narrow band gap of Ag2S nanoparticles. With an increased absorption in the visible wavelength, more electron–hole pairs will be generated in the composite under UV-visible illumination.
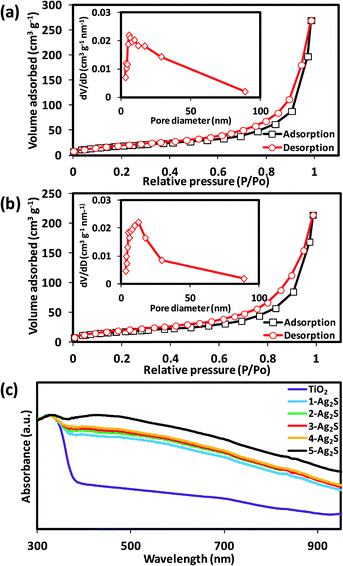 |
| | Fig. 5 BET of (a) TiO2 and (b) 3-Ag2S/TiO2. The insets show the corresponding pore size distributions obtained from desorption isotherms. (c) Absorbance spectra of n-Ag2S/TiO2 composites. | |
The photocatalytic performance of the composites with different loading cycles for water splitting is shown in Fig. 6(a). After one loading cycle of Ag2S, the H2 evolution rate improved from 167 to 412 μmol h−1 g−1, demonstrating the effectiveness of Ag2S as a co-catalyst. The H2 evolution rate continued to increase with more loading cycles and peaked at 708 μmol h−1 g−1 for 3 loading cycles but subsequently decreased for higher loading cycles, plummeting to 330 μmol h−1 g−1 for 5 loading cycles. Despite the drop in performance, the H2 evolution rate is still higher than that of the pristine TiO2 hierarchical spheres, indicating that the presence of Ag2S on TiO2 as a co-catalyst will aid in improving the photocatalytic performance regardless of the amount. In this case, 3 loading cycles provided the highest enhancement to the H2 evolution rate, and the H2 evolution rate of 708 μmol h−1 g−1 was about 4 times better than that of pristine TiO2 hierarchical spheres. The improved performance is due to the charge transfer between Ag2S and TiO2 as shown in Fig. 6(b) which favors the separation of photo-induced electron–hole pairs in the photosensitized TiO2. When the composite is illuminated with UV-visible light, the electrons generated are transferred from the conduction band (CB) of Ag2S to the CB of TiO2, whereas the holes are transferred from the valence band (VB) of TiO2 to the VB of Ag2S (corresponding to eqn (1)–(3)).
| | | TiO2 + hv → TiO2 (e−) + TiO2 (h+) | (1) |
| | | Ag2S + hv → Ag2S (e−) + Ag2S (h+) | (2) |
| | | TiO2 (h+, e−) + Ag2S (h+, e−) → TiO2 (e−, e−) + Ag2S (h+, h+) | (3) |
 |
| | Fig. 6 (a) H2 evolution rates of n-Ag2S/TiO2 composites. (b) Schematic diagram of the charge-transfer processes between Ag2S and TiO2 during water splitting. (c) H2 production cycling of 3-Ag2S/TiO2. | |
This transfer process is thermodynamically more favorable because both the CB and VB of Ag2S lie above that of TiO2, and the electron–hole transfer process is faster than its recombination. The holes will react with methanol in a stepwise reaction producing H+ and several intermediates in the process which were eventually oxidized to CO2, while the electrons reduce the H+ ions to form H2 according to eqn (4) and (5).29–31
| | | CH3OH + h+ → oxidation products (H+, intermediates, and CO2) | (4) |
When the number of loading cycles was increased to more than 3 times, the density of Ag2S nanoparticles populating the surface of the TiO2 hierarchical spheres was too high causing conglomeration. This can be seen from the TEM image of 5-Ag2S/TiO2 which appears much darker than the as-synthesized TiO2 hierarchical spheres, 1-Ag2S/TiO2 and 3-Ag2S/TiO2 (Fig. 2). The darker contrast is attributed to the high density of Ag2S nanoparticles populating the TiO2 hierarchical spheres. This will prevent the photo-induced electrons in Ag2S from fast injection into TiO2, resulting in inefficient separation of the electron–hole pairs and more occurrence of recombination. The high density of Ag2S nanoparticles will also block the light from TiO2, resulting in a fewer photogenerated electrons and holes for the generation of H2. These effects will result in a decline in the H2 evolution rate.32 Besides the H2 evolution rate, another property of the photocatalyst that is of great importance is the stability and consistency of the photocatalytic performance over repeated use. To determine this, the 3-Ag2S/TiO2 composite was tested for H2 evolution repeatedly over 5 cycles (Fig. 6(c)). After each cycle, the photocatalyst was washed with DI water, re-dispersed in a newly prepared 10% v/v methanol–water solution, and purged with Ar gas before irradiating with the xenon arc lamp again. The H2 evolution rate exhibited only a slight drop from 708 to 628 μmol h−1 g−1 after 5 cycles, proving that the photocatalyst is stable and can be recycled over repeated runs.
Besides photocatalytic water splitting, the n-Ag2S/TiO2 composites can also be used for photodegradation of MO, which is akin to demonstrating its wastewater treatment capabilities. The degradation kinetics of MO was measured via the changes in their concentration, which was calculated from the absorbance peaks at 462.5 nm. From the plot in Fig. 7(a), the TiO2 hierarchical spheres needed 180 min to fully degrade MO. After loading with Ag2S nanoparticles, the time needed to fully degrade MO was reduced to 150 min. The 3-Ag2S/TiO2 composite performed the best and was able to degrade MO completely in 120 min. The photodegradation activity was further analyzed by studying the pseudo-first order kinetics of the various photocatalysts as shown in Fig. 7(b). This quantitative analysis is derived using the pseudo-first order model33 as follows:
where
C0 and
Ct are the concentrations of MO at time 0 and
t respectively, and
k is the pseudo-first order rate constant. The pseudo-first order rate constants,
k, of the TiO
2 hierarchical spheres and
n-Ag
2S/TiO
2 composites are summarized in
Table 2. The constant
k of TiO
2 is the lowest at 0.011 min
−1, but it increases with Ag
2S loading. The 3-Ag
2S/TiO
2 composite has the highest
k constant at 0.018 min
−1, indicating its enhanced dye degradation capability. The degradation results clearly show that the photodegradation of MO improved after loading Ag
2S on TiO
2 hierarchical spheres, and the 3-Ag
2S/TiO
2 composite produced the highest rate of photodegradation. This is most likely attributed to the optimal loading of Ag
2S nanoparticles on TiO
2, where the light harvesting ability is the best and the recombination rate is the lowest. The enhancement in photodegradation is also due to the charge transfer between Ag
2S and TiO
2, and the reduced recombination between the photo-generated electron–hole pairs (
Fig. 7(c)). The generated electrons react with dissolved oxygen molecules and produce oxygen peroxide radicals (
eqn (7)), while the positively charged holes (h
+) react with OH
− derived from H
2O to form hydroxyl radicals OH˙ (
eqn (8) and
(9)). O
2˙
− and OH˙ are powerful oxidizing agents capable of degrading most pollutants.
34,35 The MO molecules can be photodegraded by the O
2˙
− and OH˙ radicals to CO
2, H
2O, or other mineralization products (
eqn (10)).
| | | O2˙− or OH˙ + MO → degradation products | (10) |
 |
| | Fig. 7 (a) Degradation kinetics and (b) pseudo-first order kinetics of time evolution MO photodegradation study in the presence of n-Ag2S/TiO2 composites. (c) Schematic diagram of the charge-transfer processes between Ag2S and TiO2 during MO photodegradation. | |
Table 2 Pseudo-first order rate constants k of the n-Ag2S/TiO2 composites
| Photocatalysts |
Kinetic constants, k (min−1) |
Correlation coefficient, R2 |
| TiO2 |
0.011 |
0.981 |
| 1-Ag2S/TiO2 |
0.014 |
0.945 |
| 2-Ag2S/TiO2 |
0.014 |
0.972 |
| 3-Ag2S/TiO2 |
0.018 |
0.988 |
| 4-Ag2S/TiO2 |
0.016 |
0.985 |
| 5-Ag2S/TiO2 |
0.013 |
0.973 |
The Ag2S/TiO2 composite material is also capable of showing photcatalytic activity under visible illumination. 3-Ag2S/TiO2 was used to photodegrade MO under visible light irradiation. MO was completely degraded after 210 min and from the analysis of the pseudo-first order kinetics, the rate constant k of the Ag2S/TiO2 composite was determined to be 0.011 min−1 as shown in Fig. S1.† This shows that the Ag2S/TiO2 composite material is photoactive towards visible light irradiation, and it is a promising candidate for photocatalytic applications under visible light.
Conclusions
Ag2S nanoparticles were successfully deposited on TiO2 hierarchical spheres at room temperature via the SID method. The efficient charge separation induced by Ag2S helped to reduce recombination, thus enhancing the photocatalytic activity of the photocatalyst. The Ag2S nanoparticles deposited over 3 loading cycles gave the best performance and could produce H2 gas at an evolution rate of 708 μmol h−1 g−1. The composite material also exhibited stability when it was recycled 5 times for photocatalytic water splitting without any drastic drop in performance. The 3-Ag2S/TiO2 composite was capable of degrading organic pollutants, and it photodegraded MO fully within 2 hours with a rate constant of 0.018 min−1. The photocatalytic activity of the composite towards visible light illumination was also demonstrated.
Acknowledgements
This work is supported by the MOE grant R-263-000-B38-112 and A*STAR grant R-263-000-A96-305.
Notes and references
- A. L. Linsebigler, G. Q. Lu and J. T. Yates, Chem. Rev., 1995, 95, 735 CrossRef CAS.
- G. Wang, L. Xu, J. Zhang, T. Yin and D. Han, Int. J. Photoenergy, 2012, 2012, 9 Search PubMed.
- Z. Haider and Y. S. Kang, ACS Appl. Mater. Interfaces, 2014, 6, 10342 CAS.
- H. B. Wu, X. W. Lou and H. H. Hng, Chem.–Eur. J., 2012, 18, 2094 CrossRef CAS PubMed.
- M. Ni, M. K. H. Leung, D. Y. C. Leung and K. Sumathy, Renewable Sustainable Energy Rev., 2007, 11, 401 CrossRef CAS PubMed.
- R. Liu and A. Sen, J. Am. Chem. Soc., 2012, 134, 17505 CrossRef CAS PubMed.
- W. J. Foo, C. Zhang and G. W. Ho, Nanoscale, 2013, 5, 759 RSC.
- J. Shen, Y. L. Meng and G. Xin, Rare Met., 2011, 30, 280 CrossRef CAS.
- T. Zhu, C. K. N. Peh, M. H. Hong and G. W. Ho, Chem.–Eur. J., 2014, 20, 11505 CrossRef CAS PubMed.
- J. Hong, Y. Wang, Y. Wang, W. Zhang and R. Xu, ChemSusChem, 2013, 6, 2263 CrossRef CAS PubMed.
-
H. Sheng, L. Yu, Y. Jian-Hua and Y. Ying, Nanotechnology for Sustainable Energy, American Chemical Society, 2013, p. 219 Search PubMed.
- Y. Xie, S. H. Heo, Y. N. Kim, S. H. Yoo and S. O. Cho, Nanotechnology, 2010, 21, 015703 CrossRef PubMed.
- M. C. Neves, J. M. F. Nogueira, T. Trindade, M. H. Mendonça, M. I. Pereira and O. C. Monteiro, J. Photochem. Photobiol., A, 2009, 204, 168 CrossRef CAS PubMed.
- Y. P. Du, B. Xu, T. Fu, M. Cai, F. Li, Y. Zhang and Q. B. Wang, J. Am. Chem. Soc., 2010, 132, 1470 CrossRef CAS PubMed.
- L. Zhu, Z. Meng, G. Trisha and W. C. Oh, Chin. J. Catal., 2012, 33, 254 CrossRef CAS.
- L. Zhu, Z. D. Meng and W. C. Oh, J. Nanomater., 2012, 2012, 1 Search PubMed.
- M. Gholami, M. Qorbani, O. Moradlou, N. Naseri and A. Z. Moshfegh, RSC Adv., 2014, 4, 7838 RSC.
- W. G. Fan, S. Jewell, Y. Y. She and M. K. H. Leung, Phys. Chem. Chem. Phys., 2014, 16, 676 RSC.
- Z. Shan, D. Clayton, S. Pan, P. S. Archana and A. Gupta, J. Phys. Chem. B, 2014, 118, 14037 CrossRef CAS PubMed.
- Y. Xie, S. H. Yoo, C. Chen and S. O. Cho, Mater. Sci. Eng., B, 2012, 177, 106 CrossRef CAS PubMed.
- W. G. Yang, F. R. Wan, Q. W. Chen, J. J. Li and D. S. Xu, J. Mater. Chem., 2010, 20, 2870 RSC.
- W. L. Ong, M. Gao and G. W. Ho, Nanoscale, 2013, 5, 11283 RSC.
- J. Y. Liao, B. X. Lei, D. B. Kuang and C. Y. Su, Energy Environ. Sci., 2011, 4, 4079 CAS.
- A. Usami, Chem. Phys. Lett., 1997, 277, 105 CrossRef CAS.
- J. Ferber and J. Luther, Sol. Energy Mater. Sol. Cells, 1998, 54, 265 CrossRef CAS.
- G. Rothenberger, P. Comte and M. Gratzel, Sol. Energy Mater. Sol. Cells, 1999, 58, 321 CrossRef CAS.
- J. L. Wang, H. Feng, K. M. Chen, W. L. Fan and Q. Yang, Dalton Trans., 2014, 43, 3990 RSC.
- Y. F. Gao, Y. Masuda, Z. F. Peng, T. Yonezawa and K. Koumoto, J. Mater. Chem., 2003, 13, 608 RSC.
- L. S. Yoong, F. K. Chong and B. K. Dutta, Energy, 2009, 34, 1652 CrossRef CAS PubMed.
- T. Sreethawong and S. Yoshikawa, Catal. Commun., 2005, 6, 661 CrossRef CAS PubMed.
- H. J. Choi and M. Kang, Int. J. Hydrogen Energy, 2007, 32, 3841 CrossRef CAS PubMed.
- B. K. Liu, D. J. Wang, Y. Zhang, H. M. Fan, Y. H. Lin, T. F. Jiang and T. F. Xie, Dalton Trans., 2013, 42, 2232 RSC.
- J. M. Herrmann, H. Tahiri, Y. Ait-Ichou, G. Lassaletta, A. R. González-Elipe and A. Fernández, Appl. Catal., B, 1997, 13, 219 CrossRef CAS.
-
M. Kaneko and I. Okura, Photocatalysis: Science and Technology, Springer, 2002 Search PubMed.
-
A. J. Bard, R. Parsons and J. Jordan, Standard Potentials in Aqueous Solution, Taylor & Francis, 1985 Search PubMed.
Footnote |
| † Electronic supplementary information (ESI) available. See DOI: 10.1039/c4ta06674j |
|
| This journal is © The Royal Society of Chemistry 2015 |
Click here to see how this site uses Cookies. View our privacy policy here. 
 Open Access Article
 This Open Access Article is licensed under a
  b,
June Lay
Ting Ong
b and
Ghim Wei
Ho
*ab
b,
June Lay
Ting Ong
b and
Ghim Wei
Ho
*ab