 Open Access Article
Creative Commons Attribution 3.0 Unported Licence
Is there a universal reaction mechanism of Li insertion into oxidic spinels: a case study using MgFe2O4†
Stefan
Permien
a,
Sylvio
Indris
b,
Marco
Scheuermann
b,
Ulrich
Schürmann
c,
Valeriu
Mereacre
d,
Annie K.
Powell
d,
Lorenz
Kienle
c and
Wolfgang
Bensch
*a
aInstitute of Inorganic Chemistry, University of Kiel, Max-Eyth-Straße 2, 24118 Kiel, Germany. E-mail: wbensch@ac.uni-kiel.de
bInstitute for Applied Materials – Energy Storage Systems, Karlsruhe Institute of Technology, P.O. Box 3640, 76021 Karlsruhe, Germany
cInstitute for Materials Science, University of Kiel, Kaiserstr. 2, 24143 Kiel, Germany
dInstitute of Inorganic Chemistry, Karlsruhe Institute of Technology, Engesser Str. 15, 76131 Karlsruhe, Germany
First published on 20th November 2014
Abstract
Structural and electronic changes during Li insertion into spinel-type MgFe2O4 particles with different sizes were studied applying a multi-method approach yielding a detailed picture about distinct reaction steps during Li uptake. A small amount of Li is intercalated into the smaller particles (8 nm) at the beginning of the reaction while no such reaction step occurs for the large crystallites (ca. 100 nm). Li uptake is accompanied by a reduction of Fe3+ ions and simultaneous movement from the tetrahedral to an empty octahedral site. After uptake of 2 Li per formula unit all ions have moved from tetrahedral to free octahedral voids resulting in the formation of a disordered NaCl-type material. Insertion of 4 further Li atoms transforms the crystalline material to an amorphous and inhomogeneous product consisting of a Li2O matrix with embedded nanosized metallic Fe and MgO particles. During the charge process Fe is oxidized to FeO and Li2O is converted to Li.
1. Introduction
Today's portable consumer electronics and electronic vehicles are under development and demand for new battery materials with high energy density and fast charge/discharge kinetics.1–4 On the one hand new materials for Li-ion batteries (LiBs) need to be developed.5–7 On the other hand characterization of reversible and irreversible phase transitions during charge and discharge is vital for the understanding of processes which determine the applicability of battery materials.8–10 In conventional batteries graphite is used as an anode material, and Li intercalation and deintercalation are the basic reactions in this type of batteries.11 Alternatives for graphite are nanomaterials like transition metal oxides. The advantages and disadvantages of nanomaterials in LiBs were discussed extensively in the literature.12–14 A careful control of the nanoparticle size and shape can greatly improve the performance, capacity and cyclability of nanoparticle based Li batteries.13,15 Using nanoparticulate metal oxides as anode materials leads to a change in the reaction mechanism from “classic” intercalation to a so-called conversion reaction. The reversible electrochemical reaction mechanism of Li with transition metal oxides like MO (M = Co, Ni, Cu or Fe) proceeds like a displacive redox reaction (eqn (1)).16–18| M+IIO + 2Li+ + 2e− ↔ Li2O + M±0 | (1) |
Such conversion reactions are not limited to oxides and they can be generally formulated with eqn (2):
| TMxQy + 2ye− + 2yLi+ ↔ x[TM]±0 + yLi2Q (TM = transition metal, Q = O, S, Se). | (2) |
At the end of the conversion reaction a Li2Q matrix is formed with embedded nanosized metal particles. 2y/x Li ions can be converted per TM ion leading to specific capacities beyond 500 mA h g−1. A disadvantage of conversion reactions is that the formation of a new phase may lead to large volume changes, often resulting in strong capacity fading during the first cycles, or even to the total loss of contact to the current collector.19
The conversion materials exhibit higher capacities if TM ions with higher oxidation states are applied, and the potential of the battery cell can be adjusted by the strength of the metal-oxygen bond.13 Transition metal spinel oxides with the general formula AB2O4 (A = Zn, Fe, Mn, Ni, Co; B = Fe, Co, Mn) are intensively investigated because their theoretical capacities are larger than 1000 mA h g−1.20–24 Ferrites with the formula MFe2O4 (M = transition metal) with carbon coating, graphene supported surfaces and special morphology show good cycle stability over more than 100 cycles.25–30
MgFe2O4 is environmentally friendly, non-toxic, based on earth abundant elements and hence the material is cheap. Some groups already investigated MgFe2O4 nanoparticles as an anode material for LiBs: Sivakumar et al. used nanoparticles obtained via ball milling showing a capacity of 1480 mA h g−1, but the cycling performance was poor with only 300 mA h g−1 after ten cycles.31 Pan et al. synthesized nanoparticles by the sol-gel method by mixing nanoparticles with 20 wt% carbon black, leading to a better cyclic stability and after 50 cycles the capacity was still 493 mA h g−1.32 Yin et al. prepared 33 nm particles mixed with 40 wt% Super P Carbon and 20 wt% PVDF showing an initial discharge capacity of 1123 mA h g−1 and 635 mA h g−1 after 50 cycles.33 Gong et al. used carbon coated polydispersive nanoparticles (20 to 175 nm) providing a better cyclic stability after 50 cycles of about 600 mA h g−1.34
The capacity loss between the first and the following cycles is a general observation made for ferrites MFe2O4 (Mn, Fe, Co, Ni). One reason may be that the elemental metallic nanoparticles formed in the Li2O matrix generate a large interface area where the formation of a solid-electrolyte interface (SEI) irreversibly consumes Li and significantly reduces the reversibility of Li introduction and extraction.20–30
In the last few years we investigated the Li insertion behavior of several compounds with the focus on the reaction mechanism, structural and magnetic properties as well as Li mobility properties.35–37 The studies exhibited remarkable differences in Li insertion behavior for different selenides e.g. Cr4TiSe8 or CuCr2Se4 and the spinel MnFe2O4.19,38–42 For MnFe2O4 we were able to formulate a step-by-step reaction mechanism from the beginning of Li uptake until full conversion was reached applying a multi-method approach including in situ QuickXAFS, 57Fe Mössbauer spectroscopy, X-ray diffraction, HRTEM, 7Li MAS NMR spectroscopy and electrochemical experiments. The main findings of this investigation are: (i) only a very small amount of Li can be intercalated while simultaneously Fe3+ on the tetrahedral site is reduced and moves to an empty octahedral site; (ii) insertion of 1 Li/MnFe2O4 further reduces Fe3+ which is accompanied by the movement of Mn2+ to empty octahedral sites generating NaCl-like oxide domains and Li2O is simultaneously formed; (iii) after uptake of 2 Li per MnFe2O4 all Fe3+ ions are reduced and only NaCl-type monoxide and Li2O could be detected; (iv) full conversion of the monoxide into metallic Fe and Mn nanoparticles in a Li2O matrix is achieved after insertion of 8 Li/MnFe2O4; (v) during the charge cycle nanosized transition metal oxides are formed. The key question is whether oxidic spinels follow an identical Li insertion mechanism independent from the chemical composition. Because only a few investigations of the reaction mechanisms were reported until now, a detailed understanding of conversion reactions during Li insertion is important for systematic future battery development.19,38–42 A suitable spinel to examine whether the reaction steps proceed in a similar or different way is MgFe2O4 with Mg2+ on the tetrahedral site exhibiting distinct electrochemical behavior compared to transition metal cations on this site. Here we report a detailed reaction mechanism for the conversion of MgFe2O4 particles of two different sizes during Li uptake. The comparison of the progress of the reaction applying one material with two different sizes should give hints about the advantages/disadvantages of using small nanoparticles compared to major large particles and its impact on the mechanisms. The pristine materials were thoroughly characterized using XRD, EDX, SEM, TEM and N2-sorption. Electrochemical performance was investigated by cyclovoltametry (CV) and galvanostatic discharge/charge. Samples with distinct Li contents were characterized by XRD, 7Li MAS NMR and 57Fe Mössbauer spectroscopy.
2. Experimental section
2.1 Synthesis
MgFe2O4 was synthesized applying a precursor route. All chemicals were of analytical grade and used without purification. 5.0 mmol Mg(NO3)2·6H2O (98%, ABCR), 10 mmol Fe(NO3)3·9H2O (98%, Riedel-de Haen) and 15 mmol citric acid (99%, Merck) were ball milled for 2 h in a Fritsch Pulverisette with 15 mm agate balls, at 500 rpm in air. The viscous product was transferred to an open cup and heated in a pre-heated oven at 500 °C (MgFe2O4_A) and 1000 °C (MgFe2O4_B) for 3 h.432.2 Characterization
XRD patterns were recorded with a X'PERT PRO PANalytical with a Göbel mirror and a PIXcel detector using Cu Kα radiation. EDX spectra were recorded on a Philips ESEM XL 30 with an EDAX New XL-30 Detecting Unit. SEM images were taken in a Zeiss Ultra 55 with an FE-Cathode. Nitrogen sorption experiments were performed with a BELSORP Max from Bel Japan INC. The samples were activated for 14 h at 200 °C under a vacuum (0.1 mbar). TEM investigations were performed in a Tecnai F30 G2-STwin microscope at 300 kV with a field emission gun cathode and a Si/Li detector for nanoprobe EDX (EDAX system). For TEM experiments the samples were suspended in n-butanol and treated in an ultrasonic bath to induce particle separation. The dispersions were dropped onto a holey-carbon copper grid.2.3 Electrochemical measurements
For the electrochemical characterization 80 wt% MgFe2O4 powder was mixed with 10 wt% SUPER C65 Carbon (Timcal, Switzerland) and 10 wt% PVdF (Solvay, Germany). The mixture was dissolved with NMP (N-methyl-2-pyrrolidone), deposited on copper foil, dried overnight at room temperature and sintered at 100 °C for 24 h in a vacuum drying chamber. Afterwards 10 mm discs were cut with about 2 mg active material and applied as a cathode in a Swagelok type test cell, using Li metal as the anode, glass fiber filter disks (Whatman, United Kingdom) as the separator, and a solution of 1 M LiPF6 in an ethylene carbonate/dimethyl carbonate mixture (Merck, Germany) as the electrolyte. Test cells were discharged/charged with C/10 rate, performed with a Materials Mates 510 DC.For XRD, Mössbauer and 7Li NMR experiments on lithiated samples, 70 wt% MgFe2O4 was mixed with 15 wt% SUPER C65 Carbon and 15 wt% PVdF as a binder. The mixture was pressed into pellets (210 kg m−2) and used as a cathode in a Swagelok type test cell with Li metal as the anode, glass fiber filter disks as the separator, and the electrolyte mentioned above. The cells were assembled in an argon filled glove box (<1 ppm O2, <1 ppm H2O). A test cell was discharged with C/20 rate until the desired formal composition LixMgFe2O4 was reached (Materials Mates 510 DC). The cells were opened in the glove box and the recovered powders were used for further measurements without purification. Typically about 25 mg of Li containing powder could be obtained in a 10 mm Swagelok cell. For XRD measurements, materials were transferred to an iron sample holder and protected with Kapton foil.
7Li magic-angle spinning (MAS) NMR was performed at room temperature on a Bruker Avance 200 MHz spectrometer at a magnetic field of 4.7 T corresponding to a Larmor frequency of vL = 77.8 MHz. A spinning speed of 60 kHz was applied using 1.3 mm rotors in a dry nitrogen atmosphere. A 1 M LiCl solution served as a 7Li reference (0 ppm). The typical value for the recycling delay of 7Li was 1 s. 7Li MAS NMR experiments were implemented with a rotor-synchronized Hahn-echo sequence (π/2–τ–π–τ–acquisition) and a typical π/2 pulse length of 2 μs. 57Fe Mössbauer spectra were acquired using 57Co(Rh) as the γ-ray source in the transmission geometry. The velocity scale was calibrated with metallic α-Fe foil. Isomer shifts are given relative to that of α-Fe at room temperature.
3. Results
3. 1 Characterization of the pristine materials
In Fig. 1 X-ray powder patterns of the two samples together with the calculated diagram are shown. Only reflections of cubic MgFe2O4 can be observed. Reflections of the sample MgFe2O4_A are significantly broadened compared to MgFe2O4_B indicating coherently scattering domains within the nanoregime and the average size of the domains was estimated from the XRD pattern using the fundamental approach implemented in the TOPAS-4 software44 yielding 8(0.1) nm for MgFe2O4_A. The refined lattice parameter a of sample A is 8.386(1) Å. The domain size of MgFe2O4_B is 96(1) nm and the refined lattice parameter a is slightly larger (8.3955(1) Å). The smaller value for a for sample A could be attributed to defects and stress/strain as observed for MgO or CeO2 (ref. 45 and 46) and also for nanoparticles of MgFe2O4 with a between 8.386 and 8.430 Å,47,48 depending on the synthesis conditions.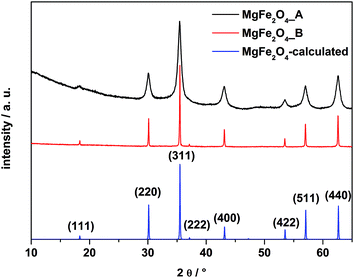 | ||
| Fig. 1 XRD patterns of the as-prepared samples MgFe2O4_A, MgFe2O4_B and the calculated pattern of MgFe2O4. | ||
The EDX elemental analysis yields a ratio of Mg to Fe of about 1![[thin space (1/6-em)]](https://www.rsc.org/images/entities/char_2009.gif) :
:![[thin space (1/6-em)]](https://www.rsc.org/images/entities/char_2009.gif) 1.71 for A and 1
1.71 for A and 1![[thin space (1/6-em)]](https://www.rsc.org/images/entities/char_2009.gif) :
:![[thin space (1/6-em)]](https://www.rsc.org/images/entities/char_2009.gif) 1.97 for B (ESI†). The root mean square deviation of four measured locations is 3.5% for A and 4.4% for B, and therefore they are less than the experimental standard deviation of EDX analysis (about 5%).
1.97 for B (ESI†). The root mean square deviation of four measured locations is 3.5% for A and 4.4% for B, and therefore they are less than the experimental standard deviation of EDX analysis (about 5%).
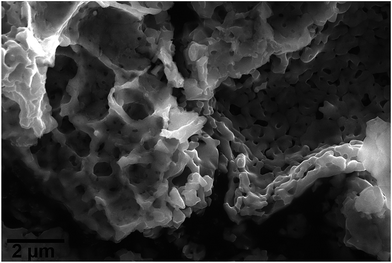
SEM images of MgFe2O4_B display spongy agglomerated particles with sizes in the range of micrometers (Fig. 2). The N2-sorption curve for MgFe2O4_A shows a type-IV-isotherm (ESI†) typically for particles with textural porosity. The specific surface area according to the Brunauer–Emmett–Teller (BET) method is SBET = 48 m2 g−1 for A. The sample MgFe2O4_B exhibits no N2-sorption due to a very small specific surface area.
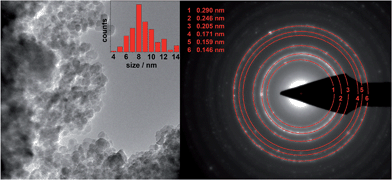
TEM results of MgFe2O4_A and MgFe2O4_B are presented in Fig. 3 and 4, respectively. Nanoprobe EDX analyses gave no indication for chemical inhomogeneity, and the SAED pattern exhibits only reflections of cubic MgFe2O4. The SAED pattern of sample A shows smaller d-values compared to B as also observed in the XRD patterns. A polydisperse size distribution of particles ranging from about 4 to 14 nm with an average particle size of 8.7 nm as determined via statistical analysis is observed for sample A (Fig. 3, left). This value matches well with that estimated from the XRD data (8 nm). MgFe2O4_B mainly consists of particles larger than 100 nm, but also some smaller crystallites smaller than 100 nm can be identified.
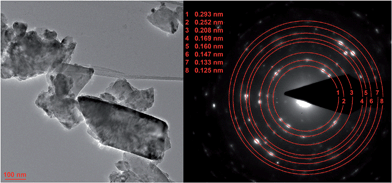 | ||
| Fig. 4 TEM image of MgFe2O4_B with polydisperse size distribution (left) and the corresponding SAED pattern. | ||
The room temperature 57Fe Mössbauer spectrum of MgFe2O4_B (Fig. 5, top) is dominated by a broadened sextet without a central doublet. The sextet consists of two superimposed individual sextets caused by Fe3+ in tetrahedral (A) and octahedral (B) sites. In contrast, the spectrum of MgFe2O4_A (Fig. 5, bottom) exhibits a sextet and a central doublet with broadened lines, suggesting a mixture of magnetic and superparamagnetic particles with isomer shift (IS) values characteristic for Fe3+ (Table 1). The very small value for the quadrupole splitting (QS) of the doublet is typical for Fe3+ in a highly symmetric environment. The broad asymmetric lines of the sextet are caused by a distribution of hyperfine fields with a maximum of 41 T for sample A and about 46 T for B (Table 1). The spectrum of MgFe2O4_B (Fig. 5, top) is very similar to that reported in ref. 49 and 50 and also similar to the spectrum of 72 nm particles presented in ref. 51, while that for MgFe2O4_A is similar to the spectrum presented in ref. 52 for 20 nm particles. Smaller particles just lead to the broadened doublet because of superparamagnetic behavior of the particles.53
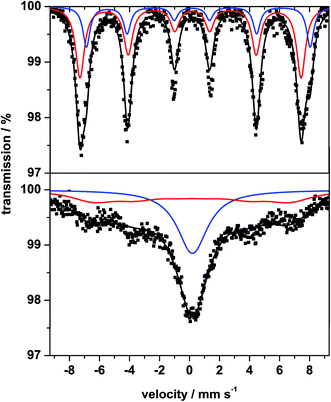 | ||
| Fig. 5 57Fe Mössbauer spectrum of sample B (top) and sample A (bottom) measured at room temperature. | ||
| Sample | IS/mm s−1 | QS/mm s−1 | Line width/mm s−1 | B hf/T |
|---|---|---|---|---|
| MgFe2O4_A (8 nm) | 0.305 ± 0.011 | −0.011 ± 0.071 | 2.468 ± 0.046 | 40.56 ± 0.47 |
| 0.252 ± 0.052 | 3.601 ± 0.300 | |||
| MgFe2O4_B (96 nm) | 0.228 ± 0.009 | 0.111 ± 0.020 | 0.709 ± 0.017 | 45.73 ± 0.02 |
| 0.475 ± 0.018 | 0.430 ± 0.036 | 0.571 ± 0.034 | 46.28 ± 0.05 |
| Sample | Capacity | Region I | Region II | Region III | Charge capacity |
|---|---|---|---|---|---|
| MgFe2O4_A | 1232 mA h g−1 | 1.5 V; 23 mA h g−1 | 0.8 V; 79 mA h g−1 | 0.4 V; 580 mA h g−1 | 798 mA h g−1 |
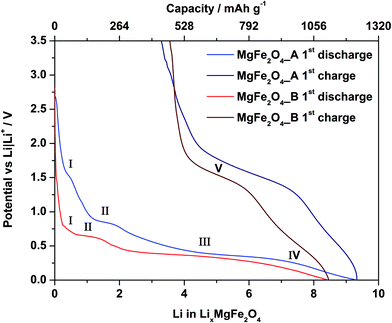
| MgFe2O4_B | 1118 mA h g−1 | 0.7 V; 44 mA h g−1 | 0.6 V; 83 mA h g−1 | 0.3 V; 600 mA h g−1 | 648 mA h g−1 |
At 3 K, a sextet is seen in the Mössbauer spectrum for both samples due to magnetic ordering (Fig. 6, upper spectra). The width of the absorption lines indicates that the sextet is a superposition of two individual sextets corresponding to Fe3+ located on two different crystallographic positions (also seen in Fig. 5, upper spectrum). Because the resolution is not good enough to evaluate the relative fractions of the two contributions, an external field was applied vertical to the γ-ray direction. This experiment allows separation of the two sextets and two well-defined absorption lines can be seen, as expected for ferrimagnetic MgFe2O4 (Fig. 6, middle and bottom). The two hyperfine sextets were least-squares fitted applying the following model, (MgxFe1−x)A[Mg1−xFe1+x]BO4, where the subscripts A and B denote the tetrahedral and octahedral sites, respectively. The degree of inversion was calculated from the areas of the Mössbauer sub-spectra. For MgFe2O4_A a distribution of cations according to (Mg0.30Fe0.70)A[Mg0.70Fe1.30]BO4 is obtained and a quite similar distribution is observed for MgFe2O4_B with (Mg0.24Fe0.76)A[Mg0.76Fe1.24]BO4. We note that different Fe3+/Mg2+ distributions are reported in the literature e.g. (Mg0.64Fe0.36)A[Mg0.36Fe1.64]BO4 or (Mg0.12Fe0.82)A[Mg0.82Fe1.12]BO4 depending on the synthesis conditions like calcination temperature and the preparation method.51–56 The degree of inversion is comparable for the two samples while the lattice parameter differs and it can be assumed that the difference is an effect of the particle sizes as discussed above.
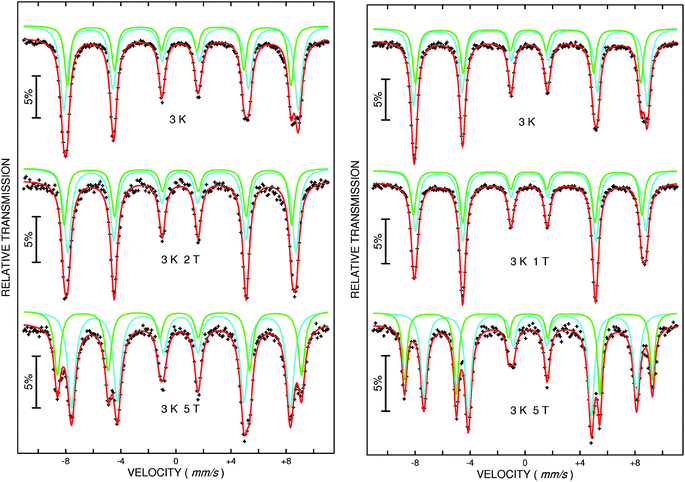 | ||
| Fig. 6 57Fe Mössbauer spectra of MgFe2O4_A (left) and MgFe2O4_B (right) measured at 3 K without (top) and with an external field of 1 T, 2 T (middle) and 5 T (bottom) respectively. | ||
3.2 Electrochemical performance of the differently sized MgFe2O4 particles
The first discharge curve of both samples MgFe2O4_A and MgFe2O4_B shows four regions (Fig. 7). In the first region (region I) the potential drops very fast. The discharge curve of MgFe2O4_A exhibits a narrow plateau at 1.5 V with a length of ca. 26 mA h g−1, while for MgFe2O4_B a broader plateau (44 mA h g−1) at a lower potential of 0.74 V is observed. During discharge of MgFe2O4_A a second plateau at 0.8 V (region II, 79 mA h g−1) appears. The second plateau of sample B is located at 0.6 V (region II, length: 83 mA h g−1). Afterwards both samples exhibit a broad plateau at about 0.4 V with a length of 580 mA h g−1 (region III) for MgFe2O4_A, respectively at 0.3 V for MgFe2O4_B with a length of 600 mA h g−1 (region III). At this plateau for both samples a potential drop to 0.01 V follows (region IV). During charging the cell a not well resolved plateau at 1.6 V (MgFe2O4_B) and 1.7 V (MgFe2O4_A) appears (region V). The insertion of 1 Li+ into MgFe2O4 corresponds to a capacity of 132 mA h g−1. The theoretical discharge capacity is 792 mA h g−1 per MgFe2O4 assuming a full conversion of Fe3+ to the metal. Pure MgO nanoparticles show no Li uptake (ESI,†Fig. 3) due to the fact that a conversion of Mg2+ cannot be realized.31,32 Sample MgFe2O4_A exhibits an entire first discharge capacity of 1232 mA h g−1 which is larger than theoretically expected. The phenomenon of an overcapacity is well documented and explained by additional capacitive charge storage at interfaces of nanoparticles57,58 and/or electrolyte decomposition.59–62 After the first discharge–charge cycle the reversible capacity of MgFe2O4_A is 798 mA h g−1 (35%, irreversible capacity loss: 434 mA h g−1) corresponding to an uptake of ≈6.04 Li per formula unit. The sample MgFe2O4_B shows a somewhat lower entire capacity of 1118 mA h g−1 and a reversible capacity of 648 mA h g−1 (42%, irreversible capacity loss: 470 mA h g−1) corresponding to an uptake of 4.9 Li per formula unit. The capacity loss is most likely caused by irreversible reactions with the electrolyte when the potential approaches 0 V vs. Li/Li+ forming passivating layers on the surface of the particles, i.e. the formation of a SEI.63 During the discharge process Fe3+ is reduced to Fe0, and charging can oxidize elemental Fe either to Fe3+ or Fe2+. If Fe2+ is formed the capacity loss amounts to 2 Li per formula unit.3.3 Cyclovoltammetry (CV)
CV curves for MgFe2O4_A and MgFe2O4_B against Li metal are shown in Fig. 8. Cycling was performed in a range from 0.01 to 3.5 V at a slow sweep rate of 0.05 mV s−1. For the first cycle of MgFe2O4_A (left) three cathodic peaks are visible at 1.6 V, 0.8 V and 0.3 V and two anodic peaks at 0.5 and 1.6 V, matching with the plateaus I–III and V in the galvanostatic cycling (Table 2). The second cycle is completely different, and only one cathodic peak at 0.6 V and an anodic peak at 1.6 V can be detected. For MgFe2O4_B the first and second cycles are almost identical compared to first and second cycles of MgFe2O4_A. There is just one difference at 1.6 V in the first cycle. Here the cathodic peak is missing in the CV curve of MgFe2O4_B, in agreement with the galvanostatic cycling (Fig. 7) where also no plateau at 1.6 V was observed. The missing cathodic peak at 1.6 V for MgFe2O4_B may be regarded as evidence that the first Li intercalation/insertion takes places at a lower potential, i.e. more energy is needed due to the lower surface area of sample B.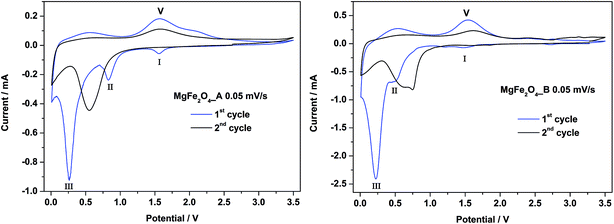 | ||
| Fig. 8 CV curves for MgFe2O4_A (left) and MgFe2O4_B (right) in a potential range from 0–3.0 V with a scan rate of 0.05 mV s−1. | ||
For both samples the first cycle is different compared to the second cycle being a clear hint that a new phase is formed. For similar spinel oxides the same phenomenon was reported.25,64
3.4 Ex situ XRD on lithiated MgFe2O4_A
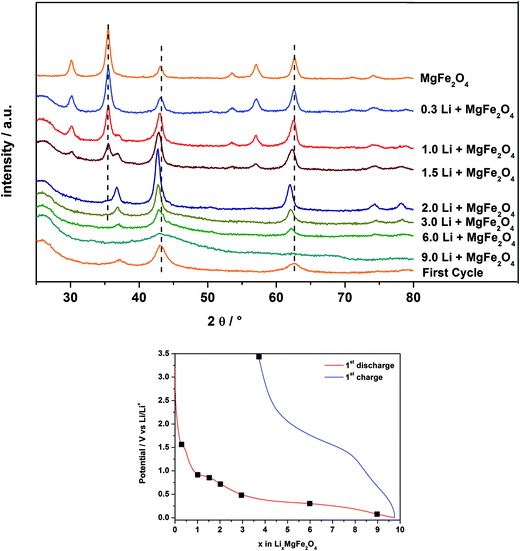
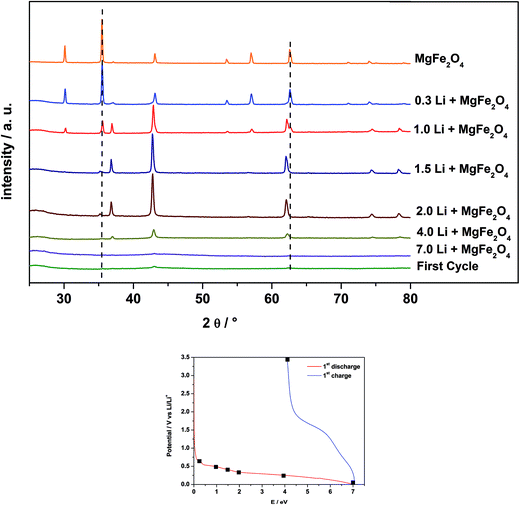
In Fig. 9 are displayed the ex situ XRD patterns of MgFe2O4_A after electrochemical insertion of 0.3, 1, 1.5, 2, 3, 6 and 9 Li per formula unit and after the first charge/discharge cycle. Note that for these experiments pellets consisting of MgFe2O4_A, a binder and carbon were prepared as described in Section 2.3.After insertion of 0.3 Li (Fig. 7 and 8; region I) the reflections slightly shift to lower scattering angles which is typical for an intercalation reaction (ESI,†Fig. 4). For Li0.3MgFe2O4 the refined value for the a axis of 8.4023(2) Å (expansion: ≈0.2%) is slightly larger than that for the pristine material which may be caused by intercalation of a small amount of Li. The average size of the coherently scattering domains amounts to 8(1) nm. Increasing the Li content to 1 per formula unit, a two phase refinement of the powder pattern was obtained. The second phase was identified as the monoxide, i.e. a mixed crystal Mg0.33Fe0.66O (cubic symmetry, space group: Fm![[3 with combining macron]](https://www.rsc.org/images/entities/char_0033_0304.gif) m) with all metal cations occupying octahedral sites with a slightly larger Mg/Fe–O bond length (2.1150 Å) compared to the spinel type phase (2.0631 Å for Fe/Mg–O on the octahedral site and 1.8887 Å for Fe/Mg–O on the tetrahedral site).65 The a axis for the monoxide was refined to 4.222(5) Å, being between that of FeO (4.334 Å) and MgO (4.211 Å)65 indicating the formation of a mixed Mg2+/Fe2+/Fe3+ containing oxide. We note that the a axis is smaller than that reported for Mg0.24Fe0.76O of 4.296 Å exhibiting a composition near to that proposed here.66 But one should keep in mind that after insertion of 1 Li into the host not all Fe3+ cations are reduced to Fe2+ with the former exhibiting a smaller ionic radius. In addition, the monoxide-like crystalline domains within the spinel material may be slightly non-stoichiometric, and it can be expected that the structure contains an appreciable number of defects and also some distortion which also affect the lattice parameter. The ratio of the spinel phase to monoxide is about 50
m) with all metal cations occupying octahedral sites with a slightly larger Mg/Fe–O bond length (2.1150 Å) compared to the spinel type phase (2.0631 Å for Fe/Mg–O on the octahedral site and 1.8887 Å for Fe/Mg–O on the tetrahedral site).65 The a axis for the monoxide was refined to 4.222(5) Å, being between that of FeO (4.334 Å) and MgO (4.211 Å)65 indicating the formation of a mixed Mg2+/Fe2+/Fe3+ containing oxide. We note that the a axis is smaller than that reported for Mg0.24Fe0.76O of 4.296 Å exhibiting a composition near to that proposed here.66 But one should keep in mind that after insertion of 1 Li into the host not all Fe3+ cations are reduced to Fe2+ with the former exhibiting a smaller ionic radius. In addition, the monoxide-like crystalline domains within the spinel material may be slightly non-stoichiometric, and it can be expected that the structure contains an appreciable number of defects and also some distortion which also affect the lattice parameter. The ratio of the spinel phase to monoxide is about 50![[thin space (1/6-em)]](https://www.rsc.org/images/entities/char_2009.gif) :
:![[thin space (1/6-em)]](https://www.rsc.org/images/entities/char_2009.gif) 50% after insertion of 1 Li. For the spinel phase the a axis is slightly larger at 8.4078(3) Å and the size of coherent scattering domains is not significantly altered.
50% after insertion of 1 Li. For the spinel phase the a axis is slightly larger at 8.4078(3) Å and the size of coherent scattering domains is not significantly altered.
A further decrease of the intensity of the reflections of the spinel phase occurs for the sample containing 1.5 Li per formula unit (Fig. 7 and 8; region II), while the intensity of the reflections of the monoxide increased. The two phase Rietveld refinement yields for the spinel type phase a = 8.411(4) Å and a = 4.231(2) Å for the monoxide. Increasing the Li content to 2 per formula unit (Fig. 7 and 8; beginning of region III) only small amounts of the spinel phase exist (≈1%), and the monoxide phase is dominating (99%) with a = 4.237(2) Å and 7(1) nm for the coherently scattering domains. The formation of a monoxide with a NaCl-type structure requires that Mg and Fe cations located on tetrahedral position 8a in the spinel move to the neighboring octahedral position 16c while Fe3+ is reduced to Fe2+. When 16c and 16d are occupied in the spinel phase the symmetry changes and space group Fm![[3 with combining macron]](https://www.rsc.org/images/entities/char_0033_0304.gif) m is adopted with about half of the a axis (8.4023 Å/2 = 4.2012 Å). Increasing the Li amount per formula unit leads to an increase of the size of the coherently scattering domains and an enlargement of the a axis due to the formation of larger particles with less defects, less strain and a monoxide consisting of Mg2+ and solely Fe2+ in the matrix of O2− anions.
m is adopted with about half of the a axis (8.4023 Å/2 = 4.2012 Å). Increasing the Li amount per formula unit leads to an increase of the size of the coherently scattering domains and an enlargement of the a axis due to the formation of larger particles with less defects, less strain and a monoxide consisting of Mg2+ and solely Fe2+ in the matrix of O2− anions.
The XRD patterns of the samples after insertion of 3 and 6 Li per formula unit show a decrease of the intensity of the reflections of the monoxide during the long plateau at about 0.3 V (see Fig. 7 and 8, region III). The particle size is further reduced from 5.4(1) nm (3 Li) to 3.0(1) nm (6 Li). Finally, no reflections can be detected for the material containing 9.0 Li per formula unit (Fig. 7 and 8; end of region IV). The very broad modulation centered at 43° 2θ may be caused by nanosized metallic Fe. During the long plateau at 0.3 V the monoxide is converted to an amorphous product or the crystallites are too small to be detected by XRD. After the first charge/discharge cycle the reflections for the monoxide appear again, with a size of coherently scattering domains of 2.6(3) nm and a slightly smaller value for the a axis of 4.209(4) Å. The value for the a axis after the first cycle is very close to that of MgO (4.211 Å).65
3.5 Ex situ XRD on lithiated MgFe2O4_B
Fig. 10 shows the ex situ XRD patterns of MgFe2O4_B, after electrochemical insertion of 0.3, 1, 1.5, 2, 4, and 7 Li per formula unit and after a full charge/discharge cycle. The pellets of MgFe2O4_B were prepared as mentioned in Section 2.3.After insertion of 0.3 Li (Fig. 7 and 8, corresponding to region I) the reflections do not shift in contrast to the observation made for sample A. For Li0.3MgFe2O4 the value for the a axis is 8.3969(3) Å, which is only about 0.02% larger than that for the pristine material and compared with sample A (expansion = 0.2%) the expansion can be neglected. The average sizes of the coherently scattering domains decreased to 74(2) nm, being 32% smaller than that for the starting material. The data suggest that no intercalation takes place in MgFe2O4_B. Despite that no shift of the reflection can be observed, the asymmetry of the (400) reflection (ESI,†Fig. 5) indicates the presence of small amounts of a second phase and the two phase Rietveld refinement yields better reliability factors. It seems that the monoxide phase is formed immediately by Li insertion in contrast to what is found for sample A. Increasing the Li content to 1 per formula unit, the amount of the second phase starts to grow. The a axis value for the monoxide was refined to 4.2288(2) Å and the particle size was obtained as 45(1) nm. For the spinel phase the size of coherent scattering domains decreases to 61(4) nm and the a axis is now slightly larger with a = 8.3993(5) Å. After insertion of 1.5 Li, the particle size of the monoxide is nearly constant at 46(1) nm, but the intensity of the reflections is enhanced, while the intensity of the reflections of the spinel phase decreases. Reflections of the spinel can hardly be detected in the XRD pattern after insertion of 2 Li per formula unit and the transformation to Mg0.33Fe0.66O (d = 36(1) nm) with a lattice parameter of 4.2278(4) Å seems to be completed. A possible explanation for the decrease of the crystallite size may be that some Li inserted into the material leads to the conversion of the domains to form nanosized metal particles.
The results of the Rietveld refinements suggest that the sizes of coherently scattering domains of the newly formed monoxide depend on the particle size of the pristine particles, indicating that the monoxide is directly formed out of the spinel structure by movement of Fe and Mg cations from tetrahedral to octahedral sites. Compared to sample A, the a axis value is nearly identical at this stage of Li insertion (difference: 0.2%).
During the broad plateau (Fig. 7, region III) and the large peak in the CV curve (Fig. 8, III) the monoxide is converted to amorphous products as observed for sample A. After a full charge/discharge cycle the XRD pattern shows only reflections with very low intensity and a monoxide consisting of very small particles is formed as also seen for sample A (Section 3.4). But for sample B the particles are much smaller than A.
3.6 Ex situ Li-NMR spectra of LixMgFe2O4
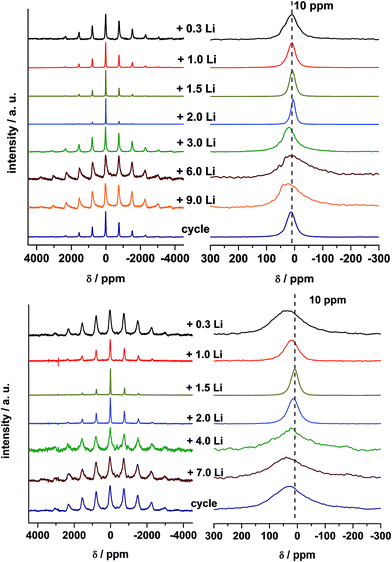
7Li MAS NMR spectra of lithiated samples A and B are presented in Fig. 11. Solid state NMR in common provides a probe for the local environment of lithium ions.67,68 It is well known that paramagnetic ions in the neighborhood of Li+ ions can have strong effects on the NMR spectra due to the Fermi-contact interaction, i.e. the transfer of spin density from the unpaired electrons of the paramagnetic ions to the Li nucleus. The value of the resulting hyperfine shift depends on the specific local environment. Furthermore, dipolar coupling between the Li nuclei and the unpaired electrons constitutes a major source of large spinning sideband manifolds in MAS spectra.67,69 For the Li insertion of MnFe2O4 nanoparticles a strong shift was observed for the samples with low Li content.42 MgFe2O4_A (Fig. 11) does not show such a strong shift, because the paramagnetic Mn2+ ions are replaced by diamagnetic Mg2+ ions. For a Li content of 0.3 Li per formula unit the shift is 10 ppm with broad sideband patterns, indicating that Fe–O–Li bridges are formed. Small amounts of Li are intercalated into the spinel structure which is consistent with the results of XRD observations. Similar shifts in NMR spectra were also observed for o-LiFeO2 suggesting a lower limit of 20 ppm per Li–O–Fe linkage in such ternary compounds.70 Increasing the Li amount up to 2 Li the shift is close to 0 ppm revealing that the local environment of the Li nuclei is diamagnetic. According to the results discussed above the existence of direct Li–O–Fe bonds can be now excluded and diamagnetic Li2O is formed. In the next steps Fe is reduced to the metallic state and more diamagnetic Li2O is generated. Consistently, the huge width of the spinning sideband manifold is caused by the presence of metallic Fe particles close to the Li+ ions. The width of the sideband manifold grows significantly and also the width of the isotropic peak increases when the number of incorporated Li+ ions per formula unit increases from 2 to 9 because more Fe metal particles are formed, as also reported for MnFe2O4.42 For Li contents of 3, 6, and 9 Li, the Fe metal particles are growing in size and thus the isotropic peaks are even broader than that of the sample with 0.5 Li and also the NMR shift is larger. After the first full cycle the width of the sideband pattern decreases and the width of the isotropic peak is reduced.For MgFe2O4_B the shift is slightly larger after insertion of 0.3 Li per formula unit than for MgFe2O4_A (Fig. 11). The larger shift can be explained because the particles are not superparamagnetic but show strong ferrimagnetic interactions leading to a stronger shift of the peak maxima at the low Li content. XRD investigations evidenced that no Li intercalation into the particles occurred (Section 3.5), but Li–O–Fe can be formed at the surface of the particles. The formation of the monoxide in sample B takes place at a low Li content (Section 3.5) also seen by comparing Li NMR spectra of MgFe2O4_B + 1.5 Li with spectra of MgFe2O4_A + 2 Li. The shift of both spectra is 0 ppm and the spinning sidebands are very small. After insertion of 4 and 7 Li into sample B the Fe is reduced to the metallic state and more diamagnetic Li2O is formed. Like for sample A the huge width of the spinning sideband manifold can be explained by the presence of metallic Fe particles close to the Li ions. After the first full cycle the width of the sideband pattern decreases and the width of the isotropic peak is reduced, but compared to sample A the effect is less pronounced.
3.7 57Fe Mössbauer spectroscopy on lithiated MgFe2O4_A
The 57Fe Mössbauer spectra of sample A collected at RT without external field after insertion of 2 and 9 Li and after the full discharge/charge cycle are displayed in Fig. 12. After uptake of 2 Li a broad absorption occurs between +1 and +2 mm s−1 consisting of two doublets (Fig. 12, top). At this stage of Li insertion the reflections of the spinel phase in the XRD pattern (Fig. 9) disappeared and the signature of two overlapping doublets appears in the Mössbauer spectrum being reminiscent of FeO.71 The doublet with the larger QS value and the larger IS clearly belongs to Fe2+ and the second doublet (with smaller QS and smaller IS) is caused by small amounts of Fe3+.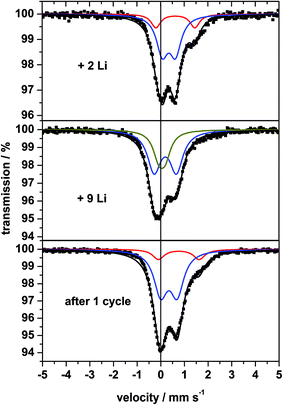 | ||
| Fig. 12 57Fe Mössbauer spectra of nanocrystalline MgFe2O4_A measured at room temperature after insertion of 2, 9 Li and after the first discharge/charge cycle. | ||
After insertion of 9 Li the XRD pattern exhibits no structural information due to the amorphous nature of the material (Fig. 9). More information can be extracted from the Mössbauer spectrum (Fig. 12, middle) being composed of two overlapping doublets with very small values for the IS (Table 3), which was also observed for fully discharged CoFe2O4 and NiFe2O4.72,73 The central absorption is caused by superparamagnetic metallic Fe nanoparticles, i.e. metallic Fe is formed during insertion of 9 Li per formula unit. These particles are not isolated but rather intimately dispersed in the Li2O matrix (see Li-NMR). The second doublet may be assigned also to metallic Fe atoms which are located at the surface of the particles being in a different environment compared to those in the centre of the particles. While fully converted CoFe2O4 (ref. 72) exhibits a similar strong split signal, the splitting for converted MnFe2O4 and CuFe2O4 is less pronounced.42,72,74
| Sample | IS/mm s−1 | QS/mm s−1 | Line width/mm s−1 |
|---|---|---|---|
| MgFe2O4_A + 2Li | 0.456 ± 0.002 | 0.560 ± 0.005 | 0.596 ± 0.011 |
| 0.729 ± 0.008 | 1.648 ± 0.015 | 0.481 ± 0.024 | |
| MgFe2O4_A + 9Li | 0.298 ± 0.007 | 0.943 ± 0.010 | 0.680 ± 0.017 |
| 0.155 ± 0.006 | 0.270 ± 0.019 | 0.582 ± 0.090 | |
| MgFe2O4_A 1 cycle | 0.449 ± 0.003 | 0.698 ± 0.005 | 0.690 ± 0.008 |
| 0.867 ± 0.012 | 1.723 ± 0.023 | 0.585 ± 0.029 |
After the first discharge/charge cycle the Mössbauer spectrum of MgFe2O4_A exhibits no sextet as expected for magnetic ordering, and is characterized by asymmetric broadened doublets which could be separated into two split signals (Fig. 12, bottom) similar to the spectrum after insertion of 2 Li per formula unit. The small particles are superparamagnetic with the doublet exhibiting the larger IS and QS values belonging to Fe2+ and the second doublet is caused by a small amount of Fe3+. These observations indicate that during charging metallic Fe is oxidized to Fe2+ as predicted in ref. 31 and 32.
4. Discussion
In the structure of MgFe2O4 the Li+ ions can either enter empty tetrahedral (8b and 48f) or octahedral (16c) sites. But for all sites Li+–Mg2+/Fe3+ distances are below 2 Å leading to strong repulsive interactions (ESI,†Fig. 5 and 6). During Li uptake sample A consisting of nanosized crystallites shows an expansion of the lattice parameter, indicating that a small amount of Li can be incorporated. Further indication for the Li insertion is given by 7Li NMR spectra exhibiting a large shift of the resonance line which may be interpreted by magnetic interactions via Li–O–Fe bonds. But during Li insertion Fe3+ is reduced to Fe2+ which has a larger ionic radius and the lattice parameter expansion may be caused by this effect. The intercalation takes place at 1.6 V visible by the cathodic peak in the CV curve (Fig. 8) and by the plateau in the galvanostatic discharge curve (Fig. 7, region I). The Li atoms reduce Fe3+ on the tetrahedral site (8a) to Fe2+, which moves to the empty 16c site, as was observed in a previous study for MnFe2O4.42 The uptake of the first 0.3 Li may then be formulated according to eqn (3):| (Mg0.30Fe3+0.70)A[Mg0.70Fe3+1.30]BO4 + 0.3Li ↔ (Mg0.30Li0.3Fe3+0.40)A[Mg0.70Fe3+1.30]B{Fe2+0.3}CO4 | (3) |
Assuming that 0.3 Fe3+ moved from the 8a site to the empty 16c site yielding the formula (Mg0.30Li0.3Fe3+0.40)A[Mg0.70Fe3+1.30]B{Fe2+0.3}CO4 an average cation radius can be calculated for the three cations located on the tetrahedral site. Using the Shannon radii a value of 0.514 Å is calculated for the pristine material and an average radius of 0.544 Å for the intercalated sample. Hence, one would expect a lattice parameter expansion of about 5% instead of 0.2% obtained experimentally. Therefore, on the basis of this consideration one can assume that only a very small amount of Li is intercalated during this reaction step.
In contrast to sample A, sample B consists of larger particles (96 nm) and no expansion of the lattice parameter could be detected. This finding is in agreement with the CV curve of this material which shows no cathodic peak at 1.6 V. In addition, the absence of a plateau at 1.6 V in the galvanostatic discharge curve points to a different mechanism. The smaller surface of the larger particles may lead to a higher energy barrier for the intercalation process or just kinetic barriers caused by slow diffusion in the larger particles. The domain size of sample B is decreasing (30%) in comparison to sample A (no decrease in particle size) during the first Li uptake step. In 7Li NMR spectra a strong shift is visible, caused by Li–Fe–O bonds on the surface of the ferrimagnetic particles. XRD and NMR data suggest that a monoxide is deposited at the surface of the pristine particles while the core of the particles is still consisting of the spinel. In contrast to sample A, Li2O is formed from the beginning of Li uptake because Li+ ions are not intercalated into the spinel structure (eqn (4)). Due to the strong shift in the 7Li NMR spectrum the newly formed small amounts of Li2O must be located close to the ferromagnetic spinel core.
| (Mg0.24Fe3+0.76)A[Mg0.76Fe3+1.24]BO4 + 0.3Li ↔ (Mg0.24Fe3+0.46)A[Mg0.76Fe3+1.24]B{Fe2+0.3}CO3.85 + 0.15Li2O | (4) |
At this stage it is interesting to compare the behavior with Co3O4 (particle size: 15–100 nm) where the trend of Li uptake occurs in the opposite way: larger particles lead to formation of an intercalated phase LixCo3O4 while smaller particles undergo a direct conversion.75
Subsequently, the insertion of 0.7 Li in sample A generates a rock salt type phase with sizes of the coherently scattering domains large enough to be clearly identified by XRD (Fig. 9). The Rietveld refinement indicates a further reduction of the sizes of coherently scattering domains of the spinel phase and an increase of the NaCl-type domains. The generation of appreciable amounts of Li2O in this reaction step is evidenced by the 7Li NMR results. During insertion of 1.5 and 2 Li per formula unit, for both samples the reflections of the spinel phase decrease and the intensity of the reflections of the rock salt phase increases in the XRD patterns. After insertion of 2 Li all Fe3+ are reduced to Fe2+ and all Mg/Fe ions are now on octahedral 16c sites. Moreover, the 57Fe Mössbauer spectrum of the sample containing 2 Li shows the signature of paramagnetic FeO and the 7Li NMR spectrum is dominated by a narrow line due to the presence of Li2O for samples A and B. For sample A eqn (5) can be formulated as:
| (Mg0.30Li0.3Fe3+0.40)A[Mg0.70Fe3+1.30]B{Fe2+0.3}CO4 + 1.7Li ↔ [Mg0.70Fe2+1.30]B{Fe2+0.70Mg0.30}CO3 + 1Li2O | (5) |
| (Mg0.24Fe3+0.46)A[Mg0.76Fe3+1.24]B{Fe2+0.3}CO3.85 + 0.15Li2O + 1.7Li ↔ [Mg0.76Fe2+1.24]B{Fe2+0.76Mg0.24}CO3 + 1Li2O | (6) |
The occupation of all 16c sites changes the symmetry and space group Fm![[3 with combining macron]](https://www.rsc.org/images/entities/char_0033_0304.gif) m is adopted by the monoxide with the chemical formula Mg0.33Fe0.66O. The formation of the monoxide takes place directly by rearrangement of the spinel structure. The formation of a rock salt structure during Li uptake has already been reported for Fe3O4, Co3O4 and Mn3O4 proposing mechanisms being in remarkable difference to what is observed in the present study. According to the results obtained for Fe3O4, the first Li uptake step involves a movement of Fe from the tetrahedral site 8a to empty octahedral site 16c, a mechanism proposed also in our work. But further Li is intercalated occupying remaining 16c and accessible 8a/48f sites up to 2 Li per formula unit involving a 2.8% increase in the unit cell volume.76 For Co3O4 an even larger expansion of the unit cell volume of 8.6% was observed during Li intercalation within the stability range for LixCo3O4 of 1 < x 1.92.77 These findings are in contrast to our results where the maximum unit cell volume expansion is 0.9% for the nanosized sample A and only 0.14% for sample B with the larger crystallites. For tetragonally distorted Mn3O4 different mechanisms must be formulated because of the formation of a non-cubic intermediate phase LiMn3O4.78 But after insertion of 2 Li per formula unit the formation of a rock salt structured intermediate MnO was also observed.79
m is adopted by the monoxide with the chemical formula Mg0.33Fe0.66O. The formation of the monoxide takes place directly by rearrangement of the spinel structure. The formation of a rock salt structure during Li uptake has already been reported for Fe3O4, Co3O4 and Mn3O4 proposing mechanisms being in remarkable difference to what is observed in the present study. According to the results obtained for Fe3O4, the first Li uptake step involves a movement of Fe from the tetrahedral site 8a to empty octahedral site 16c, a mechanism proposed also in our work. But further Li is intercalated occupying remaining 16c and accessible 8a/48f sites up to 2 Li per formula unit involving a 2.8% increase in the unit cell volume.76 For Co3O4 an even larger expansion of the unit cell volume of 8.6% was observed during Li intercalation within the stability range for LixCo3O4 of 1 < x 1.92.77 These findings are in contrast to our results where the maximum unit cell volume expansion is 0.9% for the nanosized sample A and only 0.14% for sample B with the larger crystallites. For tetragonally distorted Mn3O4 different mechanisms must be formulated because of the formation of a non-cubic intermediate phase LiMn3O4.78 But after insertion of 2 Li per formula unit the formation of a rock salt structured intermediate MnO was also observed.79
The particle sizes of the monoxide are determined by the particle sizes of the pristine material. In case of sample A the particle size is 8 nm, and the refined size of coherent scattering domains of the monoxide is 7 nm with the lattice parameter a = 4.237 Å, formed after insertion of 1.5 Li per formula unit. Starting with larger particles of 96 nm, larger coherently scattering domains of the monoxide (dmax = 46 nm) are obtained with a nearly identical parameter a = 4.2278 Å (difference between A and B: 0.2%). The refined a axis is slightly smaller than that reported in the literature (4.2710 Å, Mg0.24Fe0.76O)66 but confirms the existence of a mixed Mg/Fe oxide (see also Section 3.3).
The insertion of another 4 Li per formula unit leads to reduction of Fe2+ to the metallic state according to eqn (7):
| [Mg0.70Fe2+1.30]B{Fe2+0.70Mg0.30}CO3 + 1Li2O + 4Li ↔ MgO + 2Fe0 + 3Li2O | (7) |
This reaction occurs in both samples during the intensive cathodic peak at 0.3 V in the CV curve (Fig. 8). During Li uptake, the intensity of the reflections of the monoxide decreases continuously during Li insertion as demonstrated by XRD. The Mössbauer spectrum evidences the presence of nanosized metallic Fe with an appreciable amount of Fe atoms on the surface of the particles. At the end of the first discharge metallic Fe nanoparticles are embedded in a Li2O matrix as also described for MnFe2O4, NiFe2O4 and ZnFe2O4.42,80,81 Assuming a statistical occupancy of the cationic sites in the monoxide by Mg2+/Fe2+ the reaction formulated in eqn (5) requires destruction of long-range order and phase separation which explain the absence of reflections of MgO in the X-ray powder patterns.
A reduction of Mg2+ to Mg0 or formation of a Mg–Li alloy as reported for Mg2Si82 can be excluded due to the investigation of pure MgO (see ESI†). The stronger Mg–O bond in comparison to the Mg–Si bond may suppress the formation of Mg0. The difference in capacity between samples A and B can be explained by the larger surface area of the nanoparticles. After discharge of the cell to 0.01 V metallic iron nanoparticles and amorphous MgO are embedded in a Li2O matrix as schematically depicted in Fig. 13. Mössbauer spectra allow differentiation between iron atoms at the surface and in the core of the small particles.
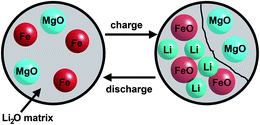 | ||
| Fig. 13 Schematic illustration of metallic Fe nanoparticles and amorphous MgO embedded in the Li2O matrix after discharge (left) and the charge/discharge process after the first cycle. | ||
During the charge process Fe0 can be oxidized to either Fe2+ or Fe3+. Using Fe2O3 as the pristine material Fe is oxidized to Fe3+ after the first cycle.83 For other spinels with trivalent transition metals like Mn3O4 the formation of MnO after the first cycle was reported.79 According to the capacity fading after the first cycle, the different CV curves of the first and second cycle, 7Li NMR and the Mössbauer results, the charge process and following discharge/charge processes for both samples can be written according to eqn (8).
| 2FeO + 4Li ↔ 2Fe + 2Li2O | (8) |
The formation of the iron monoxide was also proposed for converted MgFe2O4, Ca2Fe2O5 and Ca2Co2O5.31,84 XRD investigations demonstrate that small particles of a monoxide are formed with NaCl-type during the charge process. The charge process is again accompanied by phase separation because only nanosized Fe particles are involved in this reaction while MgO is inactive. Such a phase separation phenomenon was reported as a mechanism for interfacial storage of lithium and may also proceed for the material investigated here.85
5. Conclusion
The present study highlights the value of combined and complementary chemical, structural and electronic characterization for the elucidation of the reaction pathways and ion-transport mechanisms interrelated with charge and discharge reactions of potential battery materials. According to the results obtained in the present study the mechanisms for Li insertion strongly depend on the average particle size of the host material. In case of nanosized particles, the complex pathway of the discharging reactions starts with an intercalation of very small amounts of Li. Subsequently, the successive formation of a NaCl-type ternary oxide is induced by movement of the cations located on tetrahedral sites to empty octahedral ones followed by successive conversion for Li contents larger than 2 per formula unit. Li cannot be intercalated into larger crystallites and the material is directly converted first to the NaCl-type monoxide material. Independent from the initial particle sizes, the formation of a composite consisting of a Li2O matrix with embedded Fe nanoparticles and nanosized MgO is observed during the final step of the discharging reaction. The particle sizes of the monoxide formed by conversion depend on those of the pristine spinel-type material due to the affinity between rock salt and the spinel structure. During the charge process Li is recovered and Fe is oxidized to FeO while MgO is not affected.Acknowledgements
We are grateful to the Deutsche Forschungsgemeinschaft and to the German Federal Ministry of Education and Research for financial support.References
- J.-M. Tarascon and M. Armand, Nature, 2001, 414, 359 CrossRef CAS PubMed
.
- B. Scrosati, Nature, 1995, 373, 557 CrossRef CAS
.
- V. Etacheri, R. Marom, R. Elazari, G. Salitra and D. Aurbach, Energy Environ. Sci., 2011, 4, 3243 CAS
.
- J. B. Goodenough and K.-S. Park, J. Am. Chem. Soc., 2013, 135, 1167 CrossRef CAS PubMed
.
- N.-S. Choi, Z. Chen, S. A. Freunberger, X. Ji, Y.-K. Sun, K. Amine, G. Yushin, L. F. Nazar, J. Cho and P. G. Bruce, Angew. Chem., Int. Ed., 2012, 51, 9994 CrossRef CAS PubMed
.
- M. Armand and J.-M. Tarascon, Nature, 2008, 451, 652 CrossRef CAS PubMed
.
- R. Marom, S. F. Amalraj, N. Leifer, D. Jacob and D. Aurbach, J. Mater. Chem., 2011, 21, 9938 RSC
.
- P. Gibot, M. Casas-Cabanas, L. Laffont, S. Levasseur, P. Carlach, S. Hamelet, J.-M. Tarascon and C. Masquellier, Nat. Mater., 2008, 7, 741 CrossRef CAS PubMed
.
- A. Nyten, S. Kamali, L. Häggström, T. Gustafsson and J. O. Thomas, J. Mater. Chem., 2006, 16, 2266 RSC
.
- J. B. Goodenough, J. Solid State Electrochem., 2012, 16, 2019 CrossRef CAS PubMed
.
-
G. A. Nazri and G. Pistoia, Lithium Batteries: Science and Technology, Springer, US, 2008 Search PubMed
.
- P. G. Bruce, B. Scrosati and J.-M. Tarascon, Angew. Chem., Int. Ed., 2008, 47, 2930 CrossRef CAS PubMed
.
- A. S. Arico, P. Bruce, B. Scrosati, J.-M. Tarascon and W. van Schalwijk, Nat. Mater., 2005, 4, 366 CrossRef CAS PubMed
.
- P. Poizot, S. Laruelle, S. Grugeon, L. Dupont and J.-M. Tarascon, Nature, 2000, 407, 496 CrossRef CAS PubMed
.
- H. Long, T. Shi, S. Jiang, S. Xi, R. Chen, S. Liu, G. Liao and Z. Tang, J. Mater. Chem. A, 2014, 2, 3741 CAS
.
- J. Cabana, L. Monconduit, D. Larcher and M. R. Palacin, Adv. Mater., 2010, 22, 170 CrossRef PubMed
.
- L. F. Nazar, G. Goward, F. Leroux, M. Duncan, H. Huang, T. Kerrr and J. Gaubicher, Int. J. Inorg. Mater., 2001, 3, 191 CrossRef CAS
.
- D. W. Murphy and P. A. Christian, Science, 1979, 205, 651 CAS
.
- W. Bensch, J. Ophey, H. Hain, H. Gesswein, D. Chen, R. Mönig, P. A. Gruber and S. Indris, Phys. Chem. Chem. Phys., 2012, 14, 7509 RSC
.
- D. Larcher, G. Sudant, J.-B. Leriche, Y. Chabre and J.-M. Tarascon, J. Electrochem. Soc., 2002, 149, A234 CrossRef CAS PubMed
.
- P. Lavela and J. L. Tirado, J. Power Sources, 2007, 172, 379 CrossRef CAS PubMed
.
- Y. Zhao, J. Li, Y. Ding and L. Guan, J. Mater. Chem., 2011, 21, 19101 RSC
.
- C. T. Cherian, M. V. Reddy, G. V. S. Rao, C. H. Sow and B. V. R. Chowdari, J. Solid State Electrochem., 2012, 16, 1823 CrossRef CAS PubMed
.
- M. V. Reddy, G. V. Subba Rao and B. V. R. Chowdari, Chem. Rev., 2013, 113, 5364 CrossRef CAS PubMed
.
- Z. Ding, B. Yao, J. Feng and J. Zhang, J. Solid State Electrochem., 2014, 18, 19 CrossRef CAS PubMed
.
- T. Li, Y.-Y. Wang, R. Tang, Y.-X. Qi, N. Lun, Y.-J. Bai and R.-H. Fan, ACS Appl. Mater. Interfaces, 2013, 5, 9470 CAS
.
- F. Mueller, D. Bresser, E. Paillard, M. Winter and S. Passerini, J. Power Sources, 2013, 236, 87 CrossRef CAS PubMed
.
- Y. Xiao, J. Zai, L. Tao, B. Li, Q. Han, C. Yu and X. Qian, Phys. Chem. Chem. Phys., 2013, 15, 3939 RSC
.
- Z. Zhang, Y. Wang, M. Zhang, Q. Tan, X. Lv, Z. Zhong and F. Su, J. Mater. Chem. A, 2013, 1, 7444 CAS
.
- K. M. Shaju, F. Jiao, A. Debart and P. G. Bruce, Phys. Chem. Chem. Phys., 2007, 9, 1837 RSC
.
- N. Sivakumar, S. R. P. Gnanakan, K. Karthikeyan, S. Amaresh, W. S. Yoon, G. J. Park and Y. S. Lee, J. Alloys Compd., 2011, 509, 7038 CrossRef CAS PubMed
.
- Y. Pan, Y. Zhang, X. Wei, C. Yuan, J. Yin, D. Cao and G. Wang, Electrochim. Acta, 2013, 109, 89 CrossRef CAS PubMed
.
- Y. Yin, B. Zhang, X. Zhang, J. Xu and S. Yang, J. Sol-Gel Sci. Technol., 2013, 66, 540 CrossRef CAS
.
- C. Gong, Y.-J. Bai, Y.-X. Qi, N. Lun and J. Feng, Electrochim. Acta, 2013, 90, 119 CrossRef CAS PubMed
.
- W. Bensch, T. Bredow, H. Ebert, P. Heitjans, S. Indris, S. Mankovsky and M. Wilkening, Prog. Solid State Chem., 2009, 37, 206 CrossRef CAS PubMed
.
- J. Wontcheu, W. Bensch, M. Wilkening, P. Heitjans, S. Indris, P. Sideris, C. P. Grey, S. Mankovsky and H. Ebert, J. Am. Chem. Soc., 2008, 130, 288 CrossRef CAS PubMed
.
- J. Wontcheu, M. Behrens, W. Bensch, S. Indris, M. Wilkening and P. Heitjans, Solid State Ionics, 2007, 178, 759 CrossRef CAS PubMed
.
- M. Behrens, O. Riemenschneider, W. Bensch, S. Indris, M. Wilkening and P. Heitjans, Chem. Mater., 2006, 18, 1569 CrossRef CAS
.
- M. Behrens, R. Kiebach, J. Ophey, O. Riemenschneider and W. Bensch, Chem.–Eur. J., 2006, 12, 6348 CrossRef CAS PubMed
.
- S. Indris, J. Wontcheu and W. Bensch, Phys. Chem. Chem. Phys., 2009, 11, 3250 RSC
.
- M. Behrens, J. Wontcheu, R. Kiebach and W. Bensch, Chem.–Eur. J., 2008, 14, 5021 CrossRef CAS PubMed
.
- S. Permien, H. Hain, M. Scheuermann, S. Mangold, V. Mereacre, A. K. Powell, S. Indris, U. Schürmann, L. Kienle, V. Duppel, S. Harm and W. Bensch, RSC Adv., 2013, 3, 23001 RSC
.
- B. Aslibeiki, P. Kameli, H. Salamati, M. Eshraghi and T. Tahmasebi, J. Magn. Magn. Mater., 2010, 322, 2929 CrossRef CAS PubMed
.
-
A. A. Coelho, Topas Academic Version 4, 2012 Search PubMed
.
- A. Cimino, P. Porta and M. Valigi, J. Am. Ceram. Soc., 1966, 49, 152 CrossRef CAS PubMed
.
- P. M. Diehm, P. Agoston and K. Albe, ChemPhysChem, 2012, 13, 2443 CrossRef CAS PubMed
.
- A. C. Druc, A. M. Dumitrescu, A. I. Borhan, V. Nica, A. R. Iordan and M. N. Palamaru, Cent. Eur. J. Chem., 2013, 11, 1330 CrossRef CAS PubMed
.
- V. M. Khot, A. B. Salunkhe, M. R. Phadatare and S. H. Pawar, Mater. Chem. Phys., 2012, 132, 782 CrossRef CAS PubMed
.
- E. de Grave, C. Dauwea, A. Govaert and J. de Sitter, Phys. Stat. Sol., 1976, 73, 527 CrossRef CAS
.
- E. Wieser, H. Schröder and K. Kleinstück, Phys. Stat. Sol., 1970, 1, 749 CrossRef CAS
.
- N. Sivakumar, A. Narayanasamy, J.-M. Greneche, R. Murugaraj and Y. S. Lee, J. Alloys Compd., 2010, 504, 395 CrossRef CAS PubMed
.
- C. Liu, B. Zou, A. J. Rondinone and Z. J. Zhang, J. Am. Chem. Soc., 2000, 122, 6263 CrossRef CAS
.
- Q. Chen, A. J. Rondinone, B. C. Chakoumakos and Z. J. Zhang, J. Magn. Magn. Mater., 1999, 194, 1 CrossRef CAS
.
- P. Holec, J. Plocek, D. Niznansky and J. Poltierova Vejpravova, J. Sol-Gel Sci. Technol., 2009, 51, 301 CrossRef CAS
.
- S. Da Dalt, A. S. Takimi, T. M. Volkmer, V. C. Sousa and C. P. Bergmann, Powder Technol., 2011, 210, 103 CrossRef CAS PubMed
.
- V. Šepelák, D. Baabe, F. J. Litterst and K. D. Becker, J. Appl. Phys., 2000, 88, 5884 CrossRef PubMed
.
- A. Ponrouch, P.-L. Taberna, P. Simon and M. R. Palacin, Electrochim. Acta, 2012, 61, 13 CrossRef CAS PubMed
.
- E. Bekaert, P. Balaya, S. Murugavel, J. Maier and M. Menetrier, Chem. Mater., 2009, 21, 856 CrossRef CAS
.
- S. Laruelle, S. Grugeon, P. Poizot, M. Dolle, L. Dupont and J. M. Tarascon, J. Electrochem. Soc., 2002, 149, A627 CrossRef CAS PubMed
.
- S. Grugeon, S. Laruelle, L. Dupont and J. M. Tarascon, Solid State Sci., 2003, 5, 895 CrossRef CAS
.
- R. Dedryvere, S. Laruelle, S. Grugeon, P. Poizot, D. Gonbeau and J. M. Tarascon, Chem. Mater., 2004, 16, 1056 CrossRef CAS
.
- L. Gireaud, S. Grugeon, S. Pilard, P. Guenot, J. M. Tarascon and S. Laruelle, Anal. Chem., 2006, 78, 3688 CrossRef CAS PubMed
.
- P. Arora, R. E. White and M. Doyle, J. Electrochem. Soc., 1998, 145, 3647 CrossRef CAS PubMed
.
- G. Li, Y. Wang, L. Yang, W. Ma and M. Wang, Eur. J. Inorg. Chem., 2014, 845 CrossRef CAS
.
- M. Boiocchi, F. Caucia, M. Merli, D. Prella and L. Ungaretti, Eur. J. Mineral., 2001, 13, 871 CrossRef CAS
.
- A. H. Jay and K. W. Andrews, J. Iron Steel Inst., 1946, 152, 15 Search PubMed
.
- C. P. Grey and N. Dupre, Chem. Rev., 2004, 104, 4493 CrossRef CAS
.
- C. P. Grey and Y. J. Lee, Solid State Sci., 2003, 5, 883 CrossRef CAS
.
- S. Indris, J. Cabana, O. J. Rutt, S. J. Clarke and C. P. Grey, J. Am. Chem. Soc., 2006, 128, 13354 CrossRef CAS PubMed
.
- J. Kim, U. G. Nielsen and C. P. Grey, J. Am. Chem. Soc., 2008, 130, 1285 CrossRef CAS PubMed
.
- D. P. Johnson, Solid State Commun., 1969, 7, 1785 CrossRef CAS
.
- P. Lavela, J. L. Tirado, M. Womes and J. C. Jumas, J. Phys. Chem. C, 2009, 113, 20081 CAS
.
- C. Vidal-Abarca, P. Lavela and J. L. Tirado, J. Phys. Chem. C, 2010, 114, 12828 CAS
.
- M. Bomio, P. Lavela and J. L. Tirado, ChemPhysChem, 2007, 8, 1999 CrossRef CAS PubMed
.
- D. Larcher, G. Sudant, J.-B. Leriche, Y. Chabre and J.-M. Tarascon, J. Electrochem. Soc., 2002, 149, A234 CrossRef CAS PubMed
.
- M. M. Thackeray, W. I. F. David and J. B. Goodenough, Mater. Res. Bull., 1982, 17, 785 CrossRef CAS
.
- M. M. Thackeray, S. D. Baker, K. T. Adendorf and J. B. Goodenough, Solid State Ionics, 1985, 17, 175 CrossRef CAS
.
- M. M. Thackeray, W. I. F. David, P. G. Bruce and J. B. Goodenough, Mater. Res. Bull., 1983, 18, 461 CrossRef CAS
.
- M. A. Lowe, J. Gao and H. D. Abruna, J. Mater. Chem. A, 2013, 1, 2094 CAS
.
- F. Martinez-Julian, A. Guerrero, M. Haro, J. Bisquert, D. Bresser, E. Paillard, S. Passerini and G. Garcia-Belmonte, J. Phys. Chem. C, 2014, 118, 6069 CAS
.
- R. Alcantara, M. Jaraba, P. Lavela, J. L. Tirado, J. C. Jumas and J. Olivier-Fourcade, Electrochem. Commun., 2003, 5, 16 CrossRef CAS
.
- H. Kim, J. Choi, H.-J. Sohn and T. Kang, J. Electrochem. Soc., 1999, 146, 4401 CrossRef CAS PubMed
.
- X. Zhu, Y. Zhu, S. Muralki, M. D. Stoller and R. S. Ruoff, ACS Nano, 2011, 5, 3333 CrossRef CAS PubMed
.
- N. Sharma, K. M. Shaju, G. V. Subba Rao and B. V. R. Chowdari, Electrochim. Acta, 2004, 49, 1035 CrossRef CAS PubMed
.
- J. Jamnik and J. Maier, Phys. Chem. Chem. Phys., 2003, 5, 5215 RSC
.
Footnote |
| † Electronic supplementary information (ESI) available. See DOI: 10.1039/c4ta05054a |
| This journal is © The Royal Society of Chemistry 2015 |

