New anhydrous proton exchange membranes for high-temperature fuel cells based on PVDF–PVP blended polymers†
Zhibin
Guo
a,
Xin
Xu
a,
Yan
Xiang
a,
Shanfu
Lu
*a and
San Ping
Jiang
*b
aLaboratory of Bio-Inspired Smart Interfacial Science and Technology of Ministry of Education, Beijing Key Laboratory of Bio-inspired Energy Materials and Devices, School of Chemistry and Environment, Beihang University, Beijing 100191, China. E-mail: lusf@buaa.edu.cn
bFuels and Energy Technology Institute, Department of Chemical Engineering, Curtin University, 1 Turner Avenue, Perth, WA 6102, Australia. E-mail: s.jiang@curtin.edu.au
First published on 3rd November 2014
Abstract
A novel high-temperature proton exchange membrane (PEM) consisting of polyvinylpyrrolidone (PVP) and polyvinylidene fluoride (PVDF) has been successfully prepared by a simple and scalable polymer blending method. PVP is miscible with PVDF, forming a single-phased PVDF–PVP polymer with excellent flowability and uniform microstructure when the PVP content is equal to or higher than 40 wt% due to the effective hydrogen bonding between the functional groups of PVP and PVDF. A proton conductivity of 0.093 S cm−1 was obtained for a 20 wt% PVDF–80 wt% PVP membrane with a H3PO4 doping level of 2.7 at 200 °C under anhydrous conditions, compatible with the state-of-the-art PBI/PA membranes. PEM fuel cells with PA/PVDF–PVP membranes showed a high power density of 530 mW cm−2 at 180 °C in H2/O2 and excellent stability without external humidification. The results indicate the high structural and chemical stability and high retention capability of the blended membranes for doped PA at elevated operation temperatures. The PVDF–PVP hybrids show promising potential as alternative PEMs for fuel cells at elevated high temperatures and under anhydrous conditions.
Introduction
High-temperature proton exchange membrane fuel cells (PEMFCs) have attracted extensive research interest over the last few decades due to their significant advantages over PEMFCs operating at room temperature, such as faster electrode reaction kinetics which reduces the usage of precious catalysts with improved energy efficiency, eliminating the anode catalyst poisoning caused by CO and H2S, and simplified water and heat management.1–3 However, traditional proton exchange membranes, PEMs based on perfluorosulfonic acid (PFSA), such as Nafion, are not able to operate at elevated high temperatures (i.e., above 100 °C) due to the significant decrease in the proton conductivity resulting from dehydration and degradation of the membrane under high temperature or low humidity conditions.4–6 As one of the key components of high-temperature PEMFCs, PEMs at elevated temperatures need to satisfy the following requirements: (1) high proton conductivity but low gas permeability under low humidity,7 (2) excellent thermal and chemical stability with outstanding mechanical properties,8 and (3) low-cost materials with easy membrane formation ability.9,10 Therefore, it is a grand challenge to develop PEMs with high proton conductivity and outstanding stability at elevated high temperatures and low humidity or under anhydrous conditions.There are various strategies to develop high-temperature PEMs for fuel cells.11 Modifying PFSA membranes with inorganic nanoparticles, such as SiO2,12,13 TiO2,14 zeolites,15etc., can increase the water retention properties at elevated temperatures, but the operating temperature of such composite membranes is generally below 100 °C. Alternative membranes based on sulfonated polyetheretherketones (SPEEKs)16 and polyimides (PIs)17,18 have been demonstrated to have good proton conductive behavior similar to Nafion at low temperature, however, their proton conductivity decreases significantly due to the loss of water under high temperature or low humility conditions. Nogami's group developed an anhydrous proton conducting hybrid membrane based on trimethoxysilane (TMOS)–trimethoxypropylsilane (TMPS)–triethyl phosphate (TEP) and BMIMBF4 ionic liquid as precursors, achieving a maximum proton conductivity of 6.4 × 10⁻³ S cm−1 at 150 °C.19 Inorganic PEMs such as functionalized mesoporous silica showed promising proton conductivity and high thermal stability at temperatures above 100 °C,20 nevertheless, the brittleness of inorganic materials makes the scale-up difficult and restricts their wide application in fuel cells.
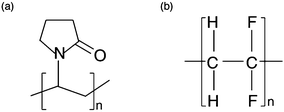
Acid-based polymers such as phosphoric acid-doped polybenzimidazole (PBI/PA) have emerged as a promising PEM in high temperature PEMFCs because of their high thermal chemical stability and low gas permeability.21–23 With the characteristics of self-ionization and self-dehydration, PBI/PA membranes can operate under low humidity and elevated high temperature conditions. Kim et al. reported a proton conductivity of 0.12 S cm−1 at 150 °C at 0% RH for a PA doped benzoxazine cross-linked PBI membrane.24 The proton conductivity increases with increasing level of PA doping. But the mechanical strength of PBI/PA decreases with increasing level of doping. Hazarika and Jana blended PBI with poly(vinylidene fluoride-co-hexafluoropropylene) (PVDF-HFP) and the blended polymers showed high proton conductivity with enhanced mechanical properties.25 In addition to PBI, basic polymers such as polyvinylimidazole,26 polyvinyl tetrazole,27 and PVDF28 doped with PA were also investigated as alternative high temperature PEMs for fuel cells. For example, Bozkurt reported a composite membrane by blending PVP with PPA (polyphosphoric acid) to obtain PVP-x-PPA composite membranes, which showed good thermal stability and its maximum proton conductivity could reach about 10−3 S cm−1.29 The mechanical properties, however, do not satisfy the requirement of PEM fuel cells. In this study, we selected PVP and PVDF as constituent components for the new high-temperature PEM for fuel cells. Fig. 1 shows the molecular structure of PVP and PVDF. PVP contains N-heterocycle as a proton accepter, indicating its promising potential application in PEMs. However, PVP itself cannot be used as a PEM due to its water-soluble properties. On the other hand, fluoropolymers such as PVDF are some of the most important engineering polymers with high non-reactivity, high chemical resistance, enhanced thermal and excellent mechanical properties, and low cost. However, the application of PVDF as a PEM is limited to some extent as PVDF contains no reactive functional groups (Fig. 1b). On the other hand, blending PVP–PVDF could lead to the formation of a new and highly stable polymer with high proton conductivity and high stability due to the high possibility of a hydrogen bonding interaction between the carbonyl groups of PVP and methylene groups of PVDF. This is evidently confirmed by the observation that PA doped PVDF–PVP blends have outstanding thermal stability and excellent proton conductivity at elevated high temperature and low humidity in this study. The cells based on PA doped PVDF–PVP blend PEMs show excellent performance and stability at elevated high temperatures and under anhydrous conditions.
Experimental
Membrane preparation
PVDF (Mw = 534![[thin space (1/6-em)]](https://www.rsc.org/images/entities/char_2009.gif) 000, Aldrich) was mixed with a certain ratio of PVP (Mn = 360
000, Aldrich) was mixed with a certain ratio of PVP (Mn = 360![[thin space (1/6-em)]](https://www.rsc.org/images/entities/char_2009.gif) 000, IPS Technologies) in N,N-dimethylformamide (DMF, reagent grade, Aldrich) and stirred for 2 days at room temperature (RT) to obtain a uniform polymer solution. The total polymer concentration was controlled to be 10–15 wt%. Then the resulting polymer solution was cast on a flat framed glass substrate and then dried in an oven at 80 °C for 48 h. After cooling down to room temperature, the PVDF–PVP blend membranes were peeled off from the glass substrate. The thickness of the obtained membrane was controlled to be about 120 ± 5 μm.
000, IPS Technologies) in N,N-dimethylformamide (DMF, reagent grade, Aldrich) and stirred for 2 days at room temperature (RT) to obtain a uniform polymer solution. The total polymer concentration was controlled to be 10–15 wt%. Then the resulting polymer solution was cast on a flat framed glass substrate and then dried in an oven at 80 °C for 48 h. After cooling down to room temperature, the PVDF–PVP blend membranes were peeled off from the glass substrate. The thickness of the obtained membrane was controlled to be about 120 ± 5 μm.
Membrane characterization
The morphology of the composite membranes was recorded on a scanning electron microscope (SEM) with an energy dispersive spectroscopy (EDS) detector (Camscan 3400, Oxford Instruments) at 20 kV accelerating voltage. To view the cross-section of the membrane, all samples were ruptured in liquid nitrogen, followed by the sputtering of gold on the cross-section and surface of the membranes. The molecular structure of the PVDF–PVP blends was examined by FTIR (iN10MX) in reflection mode. The thermal stability of the membranes was investigated by thermogravimetric analysis (TGA) (Shimadzu TGA-50, Japan). A sample weighing 10 mg was tested over temperatures ranging from RT to 800 °C at a heating rate of 10 °C min−1 under a nitrogen (99.99%) atmosphere. The stability of the blended PVDF–PVP membranes was also tested in pure water and in Fenton reagent solution (a 3 wt% H2O2 aqueous solution containing 3 ppm FeSO4)30 at 80 °C.PA doping
The PA doping level and the volume expansion measurements of the composite membrane were carried out in triplicate independently with different pieces of membranes to examine the reproducibility. Composited membranes were immersed into 85% PA solution at ambient temperature for 24 h, and then wiped with filter papers. The weight was calculated based on the difference of the membrane after and before the PA doping treatment. The PA doping level is defined as the amount of PA absorbed by the monomer unit of PVP. The formula is listed below:WA and WB are the membrane weight after and before the PA doping treatment. α is the content of PVP in the composite membrane. For each PA doping level reported, at least four samples were measured and results were taken as the average.
Proton conductivity
The through-plane proton conductivity of the membrane samples was measured in a single cell arrangement via electrochemical impedance spectroscopy over a frequency range of 100 Hz to 1000 kHz with an AC amplitude of 10 mV using an IviumStat electrochemical workstation. The membranes were sandwiched into membrane electrode assemblies (MEAs), and the measurements were carried out under dry H2 and O2 in a temperature range from 90 °C to 200 °C. Three different samples were used for the measurement and the conductivity values were taken as the average.Single cell test
The PVDF–PVP composite membranes were used to fabricate MEAs. Pt/C with a Pt loading of 0.5 mg cm−2 was used for both anode and cathode. Catalyst inks were prepared by blending Pt/C powders and PVP solution (5 wt%, ethanol) under ultrasonic vibration. And then the catalyst ink was brushed onto a microporous gas diffusion layer (GDL) to prepare the electrodes, and dried at 45 °C. The membrane was sandwiched between two electrodes to obtain MEA with hot pressing. The performances of single fuel cells were tested in a temperature range of 70–180 °C by a fuel cell testing station G20 (Greenlight, Canada). Dry H2 and O2 were input with a flow rate of 150 mL min−1.Results and discussion
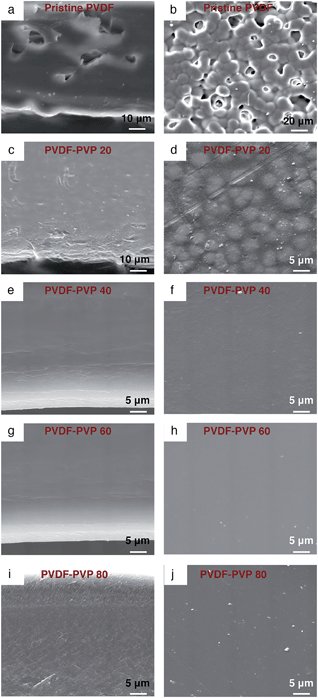
Fig. 2 shows the SEM micrographs of the cross-section and surface of PVDF and PVDF–PVP blends with different contents of PVP. The pristine PVDF membrane is characterized by the spherulite phase31 and is porous with rough surface (Fig. 2a and b). This indicates the poor flow properties of pure PVDF in the membrane fabrication. With the addition of 20 wt% PVP, the PVDF–PVP20 membrane became more uniform with substantially reduced pores and surface roughness (Fig. 2c and d) and the microstructure shows the existence of different phases: a homogeneous blend of quasi-constant composition, crystalline PVDF and a pure amorphous PVDF phase.32 With the further increase in the PVP content to 40 wt%, the PVDF–PVP40 blends show uniform and dense microstructure and smooth surface morphology (Fig. 2e and f). This clearly indicates that addition of PVP significantly improves the flow properties of PVDF, thus enhancing the thin membrane formation capability of PVDF.The formation of uniform microstructure and single-phased PVDF–PVP with PVP content higher than 40 wt% is also supported by the DSC and XRD results. When the content of PVP increases to 40 wt%, the melting peak at ∼160 °C associated with the crystalline phase of PVDF33 disappeared completely, indicating the compete suppression of the crystalline phase of the PVDF (Fig. S1, ESI†). The presence of a single and compositional dependent Tg indicates that PVDF and PVP are miscible. The miscibility behavior between PVDF and PVP is also supported by the gradual change in the intensity of the XRD diffraction peak, showing the transition from the crystallized PVDF phase to the dominant amorphous phase associated with PVP34,35 as a function of PVP contents from 20 wt% to 80 wt% in the blends (Fig. S2, ESI†).
Fig. 3 is the FTIR spectra of PVDF–PVP blends. Located at ∼3000 cm−1 is the methylene stretching absorption band of PVDF.36 With the increase of the PVP content, the methylene absorption band shifts to lower frequencies. The carbonyl stretching absorption band of PVP at 1667 cm−1 shifts to higher frequencies by up to 13 cm−1 with the increase in the content of PVP. These observations can be interpreted by the effective hydrogen bonding formation between the carbonyl group of PVP and the methylene group of PVDF;31 the hydrogen bonding weakens the interaction of carbon and hydrogen of methylene in the PVDF and thus decreases the absorption frequency of the methylene functional group of PVDF; while it restricts in the vibration of the C![[double bond, length as m-dash]](https://www.rsc.org/images/entities/char_e001.gif) O bond and hence increases the absorption frequency of the carbonyl functional group of PVP. The FTIR results clearly show the occurrence of the hydrogen bonding formation between the PVDF and PVP, consistent with the substantially improved microstructure and morphology of the PVDF–PVP blends when the PVP content is equal to or higher than 40 wt%, crystallization of PVDF is inhibited and a single, homogeneous phase is obtained.
O bond and hence increases the absorption frequency of the carbonyl functional group of PVP. The FTIR results clearly show the occurrence of the hydrogen bonding formation between the PVDF and PVP, consistent with the substantially improved microstructure and morphology of the PVDF–PVP blends when the PVP content is equal to or higher than 40 wt%, crystallization of PVDF is inhibited and a single, homogeneous phase is obtained.
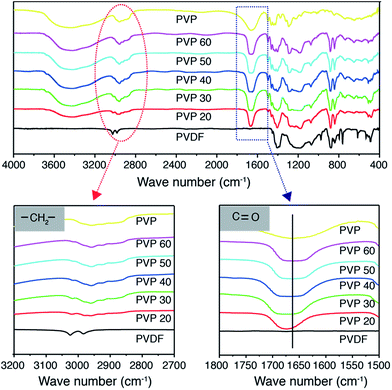 | ||
| Fig. 3 FTIR spectra of different PVDF–PVP blends. The enlarged are characteristic spectra of methylene and carbonyl groups. | ||
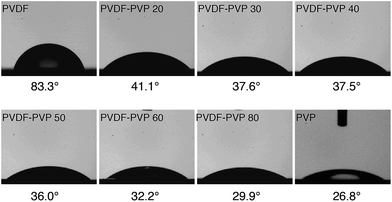
Fig. 4 shows the contact angle measurements on PVDF–PVP blends with different PVP contents. Pristine PVDF has a contact angle of 83.3°, an indication of hydrophobic characteristics of PVDF polymers. With the increase of the PVP content, the contact angles decrease, indicating the increased hydrophilicity of the PVDF–PVP blends due to the fact that PVP is hydrophilic while PVDF is hydrophobic. As the content of PVP increased, PVP would be filled in the hydrophobical predominated surface of PVDF. According to a previous study,31 the PVP content at the surface would be higher as compared with the bulk. This appears to be supported by the observation that the contact angle decreases rather rapidly with the addition of 20 wt% PVP and with further increase in the PVP content, the reduction in the contact angle is more moderate.
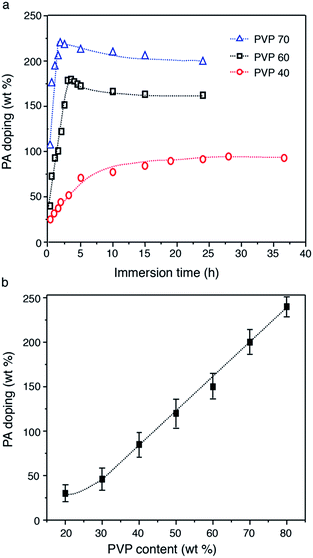
PVDF–PVP blends were doped with PA as a proton exchange membrane. Fig. 5 shows the PA doping profiles of PVDF–PVP blends as a function of PVP contents. As shown in Fig. 5a, the PA doping level increases with the immersion time, and then gradually approaches equilibrium after immersion in PA solution for less than 5 h for PVDF–PVP with PVP contents of 60 wt% or higher. However, for PVDF–PVP blends with 40 wt% PVP, it takes more than 20 h to reach equilibrium. The PA doping level in PVDF–PVP blends is almost linearly proportional to the content of PVP (Fig. 5b). In the case of PVDF–PVP with 80 wt% PVP, the PA doping level can reach ∼250 wt%. EDS mapping indicates the uniform distribution of fluorine, oxygen and phosphorus in the blends (Fig. S3, ESI†). As the PA-doping level is defined as the molar ratio of the PA per pyrrolidone ring, the PA doping level of PVDF–PVP membranes was estimated to be ∼2.7 moles of PA per mole of pyrrolidone ring. The PA-doping level of PVDF–PVP membranes is lower than 5.6 (mole number of PA per repeating unit of PBI) of the PBI-based membrane.37
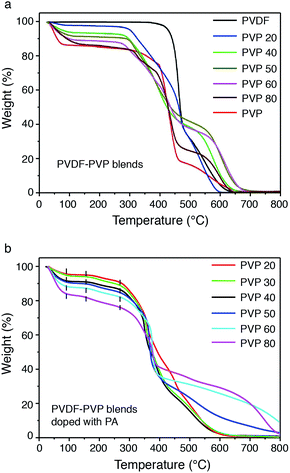
The thermal stability of PVDF–PVP blends without and with PA doping was studied by TGA, as shown in Fig. 6. The weight loss or water content of hydrophobic PVDF is negligible and remains stable up to the decomposition temperature of around 450 °C. With the increase of PVP in the blends, the weight loss measured at temperature below 150 °C increases, indicating the increased water retention. In the case of PVDF–PVP40, the water content is about 7% and as the PVP content increased to 80 wt%, the water content of PVDF–PVP80 is about 15%, close to ∼15 wt% of pristine PVP (Fig. 6a). After doping with PA (Fig. 6b), although the blends have a small weight loss due to further condensation of the phosphoric acid oligomers with evaporation of water in H3PO4,38 they still remain stable without tending to degrade below 300 °C. All PVDF–PVP blends before and after PA doping start to degrade at ∼300 °C. This indicates that PVDF–PVP blends are thermally stable at temperatures up to 250 °C, an essential requirement for high-temperature PEMFC applications. The mechanical properties of PA doped PVDF–PVP blends were also measured using a tensile test instrument (INSTRON 3365) at a strain rate of 5 mm min−1 at 20 °C under 10% RH. The tensile strength of the PA doped PVDF–PVP blends is in the range of 2–10 MPa and decreases with the increasing content of PVP from 40 wt% to 80 wt% (Fig. S4, ESI†).
The structure and chemical stability of the PVDF–PVP blends was evaluated using the soak-test in pure water and in Fenton reagent solution at 80 °C (Fig. S5, ESI†). In the case of as prepared PVDF–PVP blends, polymer dissolution occurred initially after soaking in pure water for the first 24 h and the weight of the blends remained constant with further increase of immersion time. For example, in the case of PVDF–PVP70, the maximum weight loss of the composite is ∼10%, substantially lower than the overall content of 70% PVP in the composite. This indicates that PVP in the PVDF–PVP blends is structurally very stable, clearly due to the formation of effective hydrogen bonding between the PVDF and PVP molecules. The limited solubility of the PVDF–PVP is most likely due to the small amount of the free-standing PVP molecule in the blend. On the other hand, in the case of the soak-test in the Fenton reagent, the weight loss of the PVDF–PVP70 membranes was 35 wt% after treatment for 100 h. The higher weight loss of the membrane in the Fenton agent as compared to that in pure water is mainly due to the attack of the free radical species (HO˙ and HOO˙) on the hydrogen-containing terminal bonds in the PVDF–PVP membranes, resulting in the detachment and loss of water-soluble PVP. Nevertheless, the chemical attack by the Fenton agents under the operation conditions of elevated high temperatures would be relatively small or moderate as compared to conventional PEMFCs operated at room temperature. This is also supported by the excellent stability of PEM fuel cells with PA-doped PVDF–PVP membranes as shown in the previous sections.
Fig. 7 shows the proton conductivities of PA doped PVDF–PVP blends as a function of temperature, measured by electrochemical impedance spectroscopy in H2 and O2 without external humidification. The proton conductivity of PVDF–PVP blends increases with the temperature up to 200 °C. More specifically, the proton conductivity of PVDF–PVP blends increases significantly with the temperature when the content of PVP is equal to or higher than 40 wt%. The highest proton conductivity was obtained for PVDF–PVP with 80 wt% PVP, PVDF–PVP80. The anhydrous conductivity of PA doped PVDF–PVP80 membranes is 0.037 and 0.093 S cm−1 at 100 °C and 200 °C, respectively. This is significantly better than hybrid composite membranes or compatible with that of PBI/PA composite membranes (see Table 1). The results demonstrate the excellent proton conductivity of PVDF–PVP blends at elevated high temperatures and under anhydrous conditions.
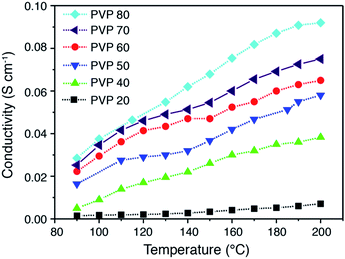 | ||
| Fig. 7 Proton conductivity of PVDF–PVP composite membranes measured at different temperatures with no external humidification. | ||
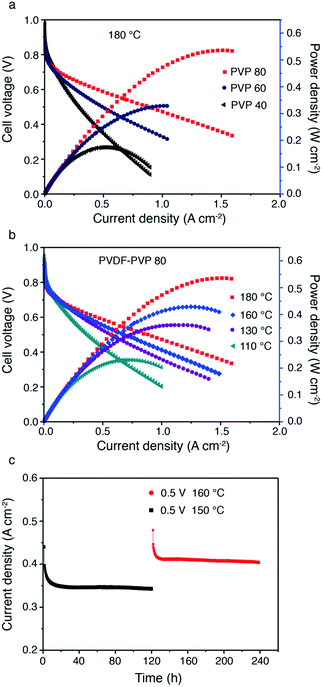
The applicability of PA doped PDDF–PVP polymers as high temperature PEMs was evaluated in fuel cells. The hydrogen permeability in the PVDF–PVP membrane was evaluated by an electrochemical method7 at 170 °C. The H2 crossover current density of the PA doped PVDF–PVP50 (50 wt% PVP) membrane is about 8 mA cm−2, which indicates an excellent H2 barrier property for application as high temperature PEMs of PEMFCs (Fig. S6, ESI). Fig. 8a shows the cell performance based on PVDF–PVP with different contents of PVP at 180 °C in H2/O2 under anhydrous conditions. With increasing content of PVP from 40 wt% to 80 wt%, the maximum power density reaches 530 mW cm−2. The high power output of the cells based on PVDF–PVP80 is most likely related to the high PA loading as shown in Fig. 5. The performance of the cells based on PVDF–PVP blended membranes is comparable to or higher than those reported in the literature.3,42,43 The cell performance also increases with the temperature (Fig. 8b). The cell performance improved with the testing temperature can be ascribed to the enhanced reaction kinetics of oxygen reduction and hydrogen oxidation at high temperatures.
To study the stability of PA doped PVDF–PVP blends under the fuel cell operation conditions, the current response of single cells with the PVDF–PVP80 membrane was measured at constant voltage (0.5 V) and different temperatures (150 °C and 160 °C) during the 240 h test (Fig. 8c). The changes in the current responses are negligible, indicating that the cell performance is very stable during the 120 h test at 150 °C. With the increase of the working temperature to 160 °C, the performance increases and the current output is also very stable, achieving ∼0.4 A cm−2. The high stability of PA/PVDF–PVP cells indicates the high retention capability of the blended membranes for doped PA. During 10 days of operation, no leaching of PA was detected. The result can be considered as very promising and encouraging although a much longer stability test of the blended membrane still needs to be investigated.
The high proton conductivity of PA/PVDF–PVP membranes indicates the facile proton conduction pathways in the PA/PVDF–PVP structure, despite its much lower PA doping level (2.7) as compared to 5.6 of PBI-based composite membrane structures.37 As shown by Steininger et al., immobilization on the main chains would put too many constraints on the aggregation of the phosphonic group and therefore severely reduces the intrinsic proton conductivity as in the case of poly(vinylphosphonic acid), PVPA, which has a very low proton conductivity under normally dry conditions despite the very high concentration of phosphonic acid functions.44 This in turn implies that PA functional groups in the PVDF–PVP hybrids are sufficiently mobile. On the other hand, the high stability of the cell tested at elevated high temperature and 0% RH (Fig. 8c) indicates that PA inside the PVDF–PVP hybrids has an excellent stability. This may be related to the presence of the hydrogen bonding in the case of PA doped PVDF–PVP blends, similar to the acid doped PBI, where hydrogen bonds are established between the polymer and the acid.42 As depicted in Fig. 5b, the PA doping level is linearly proportional to the content of PVP, indicating the presence of “free acid” and “bonded acid” in the PA/PVDF–PVP hybrids.42 The amount of “bonded acid” could be associated with the nitrogen sites in the pyrrolidone ring of the PVDF–PVP monomer unit, i.e., one PA molecule per repeat unit of PVDF–PVP. The presence of stable PA molecules with a certain degree of mobility could be the main reasons for the observed high performance and stability at elevated high temperatures and under anhydrous conditions.
Conclusions
A novel high-temperature PEM consisting of hydrophilic PVP and hydrophobic PVDF is successfully synthesized by a facile polymer blending method. The PVDF–PVP hybrids are amorphous and show uniform microstructure with good thin film cast capability with the PVP content equal to or higher than 40 wt%. The PA doping level increases almost linearly with the PVP content, indicating that PA functional groups are primarily associated with the pyrrolidone ring of the PVP. With a PA doping level of 2.7 (mole number of PA per repeating unit of PVP), 20 wt% PVDF-80 wt% PVP or PVDF–PVP80 achieved a proton conductivity of 0.037 and 0.093 S cm−1 at 100 and 200 °C under 0% RH. This is better than or compatible with the state-of-the-art PBI/PA membranes. The PEMFCs with the PA/PVDF–PVP hybrid membrane demonstrate a maximum power density 530 mW cm−2 at 180 °C in H2/O2 and 0% RH. PA/PVDF–PVP membranes also show excellent performance stability at elevated temperatures. The soak-test in pure water also indicates the excellent structure of the blended membranes. The results demonstrate that PVDF–PVP hybrids are capable of operating at low humidity and elevated high temperatures, showing promising potential in applications as a proton transfer medium in high-temperature PEMFCs.Acknowledgements
The authors thank the financial support by grants from the National High Technology Research and Development Program of China (863 program, 2013AA031902), National Natural Science Foundation of China (no. 51422301, 21003007, U1137602), National Program on Key Basic Research Project (973 Program, 2011CB935700), National Science Foundation of Beijing (No. 2132051), Beijing Higher Education Young Elite Teacher Project (29201493), the Fundamental Research Funds for the Central Universities, China and the Australia Research Council (project number: DP120104932, DP120102325).Notes and references
- Q. F. Li, R. H. He, J. A. Gao, J. O. Jensen and N. J. Bjerrum, J. Electrochem. Soc., 2003, 150, A1599–A1605 CrossRef CAS PubMed.
- I. Homna, H. Nakajima and S. Nomura, Solid State Ionics, 2002, 154, 707–712 Search PubMed.
- A. Chandan, M. Hattenberger, A. El-Kharouf, S. F. Du, A. Dhir, V. Self, B. G. Pollet, A. Ingram and W. Bujalski, J. Power Sources, 2013, 231, 264–278 CrossRef CAS PubMed.
- C. Yang, S. Srinivasan, A. B. Bocarsly, S. Tulyani and J. B. Benziger, J. Membr. Sci., 2004, 237, 145–161 CrossRef CAS PubMed.
- Y. Sone, P. Ekdunge and D. Simonsson, J. Electrochem. Soc., 1996, 143, 1254–1259 CrossRef CAS PubMed.
- A. V. Anantaraman and C. L. Gardner, J. Electroanal. Chem., 1996, 414, 115–120 Search PubMed.
- S. Galbiati, A. Baricci, A. Casalegno and R. Marchesi, J. Power Sources, 2012, 205, 350–353 CrossRef CAS PubMed.
- S. J. Peighambardoust, S. Rowshanzamir and M. Amjadi, Int. J. Hydrogen Energy, 2010, 35, 9349–9384 CrossRef CAS PubMed.
- F. A. de Bruijn, V. A. T. Dam and G. J. M. Janssen, Fuel Cells, 2008, 8, 3–22 CrossRef CAS.
- M. R. Berber, T. Fujigaya and N. Nakashima, ChemCatChem, 2014, 6, 567–571 CrossRef CAS.
- Q. F. Li, R. H. He, J. O. Jensen and N. J. Bjerrum, Chem. Mater., 2003, 15, 4896–4915 CrossRef CAS.
- K. T. Adjemian, S. J. Lee, S. Srinivasan, J. Benziger and A. B. Bocarsly, J. Electrochem. Soc., 2002, 149, A256–A261 CrossRef CAS PubMed.
- M. K. Mistry, N. R. Choudhury, N. K. Dutta, R. Knott, Z. Q. Shi and S. Holdcroft, Chem. Mater., 2008, 20, 6857–6870 CrossRef CAS.
- V. Baglio, A. S. Aricò, A. D. Blasi, V. Antonucci, P. L. Antonucci, S. Licoccia, E. Traversa and F. S. Fiory, Electrochim. Acta, 2005, 50, 1241–1246 CrossRef CAS PubMed.
- V. Baglio, A. S. Arico, A. D. Blasi, P. L. Antonucci, F. Nannetti, V. Tricoli and V. Antonucci, J. Appl. Electrochem., 2005, 35, 207–212 CrossRef CAS.
- T. Kobayashi, M. Rikukawa, K. Sanui and N. Ogata, Solid State Ionics, 1998, 106, 219–225 CrossRef CAS.
- J. H. Fang, X. X. Guo, S. Harada, T. Watari, K. Tanaka, H. Kita and K. Okamoto, Macromolecules, 2002, 35, 9022–9028 CrossRef CAS.
- X. X. Guo, J. H. Fang, T. Watari, K. Tanaka, H. Kita and K. I. Okamoto, Macromolecules, 2002, 35, 6707–6713 CrossRef CAS.
- G. Lakshminarayana, R. Vijayaraghavan, M. Nogami and I. V. Kityk, J. Electrochem. Soc., 2011, 158, B376–B383 CrossRef CAS PubMed.
- S. P. Jiang, J. Mater. Chem. A, 2014, 2, 7637–7655 CAS.
- J. S. Yang, L. N. Cleemann, T. Steenberg, C. Terkelsen, Q. F. Li, J. O. Jensen, H. A. Hjuler, N. J. Bjerrum and R. H. He, Fuel Cells, 2014, 14, 7–15 CrossRef CAS.
- J. S. Wainright, J. T. Wang, D. Weng, R. F. Savinell and M. Litt, J. Electrochem. Soc., 1995, 142, L121–L123 CrossRef CAS PubMed.
- Y. L. Ma, J. S. Wainright, M. H. Litt and R. F. Savinell, J. Electrochem. Soc., 2004, 151, A8–A16 CrossRef CAS PubMed.
- S. K. Kim, S. W. Choi, W. S. Jeon, J. O. Park, T. Ko, H. Chang and J. C. Lee, Macromolecules, 2012, 45, 1438–1446 CrossRef CAS.
- M. Hazarika and T. Jana, Eur. Polym. J., 2013, 49, 1564–1576 CrossRef CAS PubMed.
- H. Namazi and H. Ahmadi, J. Power Sources, 2011, 196, 2573–2583 CrossRef CAS PubMed.
- S. Ü. Çelik, A. Aslan and A. Bozkurt, Solid State Ionics, 2008, 179, 683–688 CrossRef PubMed.
- Y. Zhai, H. Zhang, D. Xing and Z. G. Shao, J. Power Sources, 2007, 164, 126–133 CrossRef CAS PubMed.
- A. Bozkurt and W. H. Meyer, J. Polym. Sci., Part B: Polym. Phys., 2001, 39, 1987–1994 CrossRef CAS.
- H. Pu and L. Tang, Polym. Int., 2007, 56, 121–125 CrossRef CAS.
- N. P. Chen and L. Hong, Polymer, 2002, 43, 1429–1436 CrossRef CAS.
- G. Ceccorulli, M. Pizzoli, M. Scandola, G. C. Alfonso and A. Turturro, Polymer, 1989, 30, 1251–1256 CrossRef CAS.
- N. Chen and L. Hong, Solid State Ionics, 2002, 146, 377–385 CrossRef CAS.
- R. Bhattacharya, T. N. Phaniraj and D. Shailaja, J. Membr. Sci., 2003, 227, 23–37 CrossRef CAS PubMed.
- C. S. Ramya, S. Selvasekarapandian, T. Savitha, G. Hirankumar, R. Baskaran, M. S. Bhuvaneswari and P. C. Angelo, Eur. Polym. J., 2006, 42, 2672–2677 CrossRef CAS PubMed.
- Y. Peng, B. Sun and P. Wu, Appl. Spectrosc., 2008, 62, 295–301 CrossRef CAS PubMed.
- R. H. He, Q. F. Li, G. Xiao and N. J. Bjerrum, J. Membr. Sci., 2003, 226, 169–184 CrossRef CAS PubMed.
- M. Q. Li, Z. G. Shao and K. Scott, J. Power Sources, 2008, 183, 69–75 CrossRef CAS PubMed.
- A. Bozkurt, M. Ise, K. D. Kreuer, W. H. Meyer and G. Wegner, Solid State Ionics, 1999, 125, 225–233 CrossRef CAS.
- A. Verma and K. Scott, J. Solid State Electrochem., 2010, 14, 213–219 CrossRef CAS.
- H. L. Lin, Y. C. Chou, T. L. Yu and S. W. Lai, Int. J. Hydrogen Energy, 2012, 37, 383–392 CrossRef CAS PubMed.
- R. He, Q. Li, G. Xiao and N. J. Bjerrum, J. Membr. Sci., 2003, 226, 169–184 CrossRef CAS PubMed.
- H.-S. Lee, A. Roy, O. Lane and J. E. McGrath, Polymer, 2008, 49, 5387–5396 CrossRef CAS PubMed.
- H. Steininger, M. Schuster, K. D. Kreuer, A. Kaltbeitzel, B. Bingol, W. H. Meyer, S. Schauff, G. Brunklaus, J. Maier and H. W. Spiess, Phys. Chem. Chem. Phys., 2007, 9, 1764–1773 RSC.
Footnote |
| † Electronic supplementary information (ESI) available. See DOI: 10.1039/c4ta04952g |
| This journal is © The Royal Society of Chemistry 2015 |

