 Open Access Article
Creative Commons Attribution 3.0 Unported Licence
Gelation and mechanical response of patchy rods†
Navid
Kazem
a,
Carmel
Majidi
b and
Craig E.
Maloney
*c
aCarnegie Mellon University, Civil and Environmental Engineering, Pittsburgh, PA, USA. E-mail: nkazem@andrew.cmu.edu
bCarnegie Mellon University, Mechanical Engineering, Pittsburgh, PA, USA. E-mail: cmajidi@andrew.cmu.edu
cNortheastern University, Mechanical and Industrial Engineering, Boston, MA, USA. E-mail: c.maloney@neu.edu
First published on 10th September 2015
Abstract
We perform Brownian dynamics simulations to study the gelation of suspensions of attractive, rod-like particles. We show that in detail the rod–rod surface interactions can dramatically affect the dynamics of gelation and the structure and mechanics of the networks that form. If the attraction between the rods is perfectly smooth along their length, they will collapse into compact bundles. If the attraction is sufficiently corrugated or patchy, over time, a rigid space-spanning network will form. We study the structure and mechanical properties of the networks that form as a function of the fraction of the surface, f, that is allowed to bind. Surprisingly, the structural and mechanical properties are non-monotonic in f. At low f, there are not a sufficient number of cross-linking sites to form networks. At high f, rods bundle and form disconnected clusters. At intermediate f, robust networks form. The elastic modulus and yield stress are both non-monotonic in the surface coverage. The stiffest and strongest networks show an essentially homogeneous deformation under strain with rods re-orienting along the extensional axis. Weaker, more clumpy networks at high f re-orient relatively little with strong non-affine deformation. These results suggest design strategies for tailoring surface interactions between rods to yield rigid networks with optimal mechanical properties.
1 Introduction
Rods often aggregate in suspension. The rods may be made out of a broad array of materials: polymers, bio-polymers, viruses, or inorganics (ceramics or metals). The competing driving forces for dispersion and aggregation are also diverse: surface charges, depletion interactions, van der Waals forces, etc. These materials are important for a vast array of technologies (opto-electronics,1–4 structural composites5–14etc.), and naturally occurring materials like xanthan gum15 and wood pulp.16 In some cases, the rod aggregates form disconnected clusters which enhance the viscosity of the suspension, but fail to gel into a solid. In other cases, the aggregates form rigid, space-spanning networks, and the suspension takes on solid-like properties. Despite the large number of materials that fall into this class, structure formation and resulting properties are still not well understood.Rod network formation is a particularly interesting challenge. Physical gelation is still not well understood even for spheres.17–20 Neither are the non-equilibrium and non-linear properties of even purely repulsive rods.21–24 Network aggregation may be slow and can display glass-like dynamics.25–27 The process can be effectively athermal (binding energies are typically many times kT) and controlled by kinetics, much like diffusion limited aggregation (DLA), and understanding the equilibrium state will probably not lead to a better understanding of the strongly out-of-equilibrium aggregates.
In general, colloidal suspensions of uncharged particles are unstable to aggregation. Much work has gone into stabilizing uncharged rods by chemically functionalizing them with grafted polymers or by introducing surfactants at appropriate concentrations. Particular examples include: carbon nano-tubes (CNTs),10–14,25,28–60 colloidal minerals like boehmite,26,61–67 inorganic nano-rods like gold,1–4,68–71 nanocrystalline cellulose,8,9,72–77 and FD virus.7,61,78–82 Despite this large body of experimental work, theory/simulation/modeling of structure formation, dynamics, and response has been lacking. Some previous theory/simulation results have focused on related areas: detailed physical chemistry of surface interactions between rods and adsorbing polymers;44,48,52,54 non-linear rheology of hard, repulsive rods/fibers;22–24 non-linear rheology of sticky rods;83 equilibrium phase behavior of attractive rods;84,85 mechanical properties of statically-cross-linked networks of rigid rods26,46 and semi-flexible fibers;86,87 diffusion limited aggregation (DLA) of hard, attractive rods.88 However, surprisingly little numerical work has focused on aggregation itself.
Our goal here is to introduce a minimal model for network formation and mechanical response. We are interested in the regime where the inter-rod surface interactions are strong so that the rods are effectively athermal and the rods are far above the critical volume fraction necessary for the percolation of a rigid network but still far below the isotropic to nematic transition. One key insight we have gained in constructing a minimal model is that in order for rigid networks to form, the rods must have some sort of irregularity in the surface interactions. If the attraction is uniform, in the regime of volume fractions we study, the rods always aggregate into disconnected clusters and can never form a spanning network or support a static load. On the other hand, if the interactions are corrugated or patchy, then the tendency for bundling is defeated and one can, over time, form rigid, space-spanning networks.
In this work, we introduce a simple model for the patchiness by distributing a number of attractive sites at random along each rod. These discrete attractive sites may be thought of as defects where stabilizing grafted or physically adsorbed polymers are missing or at a locally low concentration. Alternatively, in systems where attractive interactions are governed by the explicit addition of ligands on the surface, we may consider the sticking sites to be locations where there are ligands and the non-sticking sites to be patches where ligands are missing. The central result is that increasing the fraction, f, of the surface which is attractive has a non-intuitive, non-montonic effect on the structure and mechanics of the networks which form. For small f, there are too few attractive sites along the rods to form robust networks. As f increases, at first, the networks become increasingly rigid and strong with more and more cross links between rods at attractive sites and essentially a homogeneous structure. However, as more and more of the surface become attractive, branches of the networks become bundled, the structure becomes more heterogeneous, there are fewer and fewer load bearing paths, and the elastic modulus and yield stress go down. Finally at large enough f, the networks completely fall apart into disconnected bundles.
2 Models and protocols
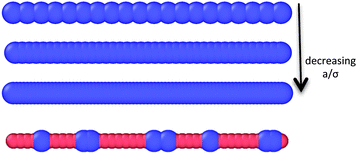
In Fig. 1 we present our interaction model. We consider that a fraction of the surface has been functionalized to prevent attractive interactions, but the remaining fraction, f, remains attractive. Rods of length L are treated as beads, spaced along a line at a spacing a. Attractive sites along the rod are modeled using a standard Lennard-Jones (LJ) interaction with characteristic length, σ, and energy, εLJ. Purely repulsive sites are modeled with the Weeks–Chandler–Anderson (WCA) potential with the same σ and energy of εLJ/100.‡ Two rods can then bind only at sites that are attractive on both rods. The dimensionless parameters in the model are: L/σ = 20 (aspect ratio), εLJ/kT = 10 (binding energy), a/σ = 0.4 (corrugation parameter), ϕ ≈ 0.02 (rod volume fraction), f (fraction of surface which is attractive). For L/σ = 20 and ϕ ≈ 0.02, the system is well below the hard-rod nematic transition.85,89 We use a standard Brownian dynamics algorithm which neglects hydrodynamic interactions between the rods. A more detailed hydrodynamical treatment could be implemented using dissipative particle dynamics or some other coarse-grained representation of the solvent particles if desired. All lengths reported below are in units of σ, and all times in units of τ, the diffusion time for a bead.Since the bond strength is εLJ = 10kT, bonds will never break once formed, and our systems can be considered athermal. In this sense, the dynamics are similar to DLA.88 However, there is a crucial distinction. In our model, once a cross-link forms, rods are free to pivot. If there are adjacent attractive sites, the cross-link may also slide. This is in contrast with DLA models where particles are completely immobilized after first contact. We have checked that the depth of the quench does not change the structure or dynamics and obtain indistinguishable results with εLJ = 20kT, 40kT, and 80kT.
Another issue is the role of corrugation. In Fig. 1, we show a cartoon of the LJ and WCA beads spaced at a distance a. If a/σ ≈ 1, the energy landscape is corrugated and there are large barriers to sliding that scale with the bond strength. Even if two parallel LJ rods are in contact, one would need to overcome a barrier to slide them into the global energy minimum with perfect overlap. The corrugation acts like an effective friction between the rods.16 On one hand, one could consider it a discretization artifact. On the other hand, real surface interactions could have some associated static friction. For ε = 10kT and L = 20σ, the choice of a = 0.4σ: (i) enforces the “athermal” condition that a contact, once formed, will never be broken and (ii) gives a small enough corrugation that contacting rods will eventually slide into complete overlap.
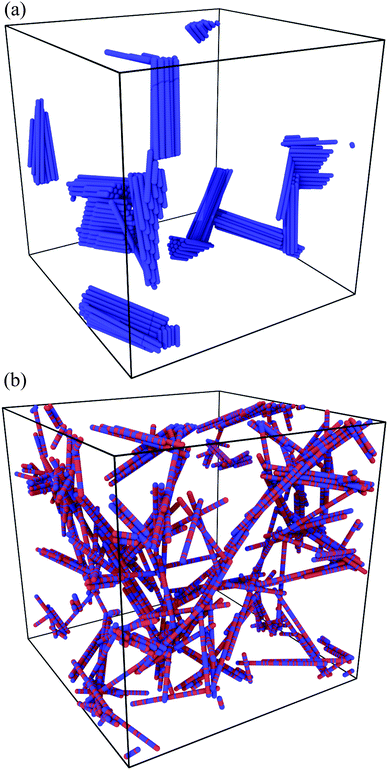
Fig. 2a shows a configuration with low corrugation and uniform attraction. This system shows a tendency for bundling in the absence of explicit patchiness. Rods tend to come into complete overlap. We have checked that for L = 20σ, ε = 10kT for larger bead spacings the corrugation prohibits the rods from sliding (not shown). For a = σ, one forms well developed rigid networks with little bundling even with nominally uniform attraction.
We perform all simulations using LAMMPS.90 LAMMPS has built-in facilities for efficiently grouping particles into rigid bodies and integrating the equations of motion subject to the rigid body constraints. We used periodic boundary conditions with cubic simulation cells of length Lcell = 3Lrod = 60σ. We initiate the runs by equilibrating a hard-rod fluid and then turn on the attractive interactions at t = 0. Each run lasts for tmax ≈ 5 × 10⁴τ and requires about one week of running time per system on one core of a modern computing cluster. We perform multiple independent simulations (typically 8) for each set of parameters to improve statistics.
We define the static virial, Σiαβ, associated with each rod via a straightforward generalization of the Irving–Kirkwood expression.91
 | (1) |
 is the net force rod i exerts on rod j, and (iii) rijβ is the separation between the centers of rod i and rod j. Note that since the net force on any bead is a pairwise sum over neighboring beads, the net force on any rod can also be considered a pairwise sum over neighboring rods. The total static virial,
  , then gives the total derivative of the potential energy with respect to a homogeneous strain.
3 Structure and dynamics during gelation
3.1 Structure
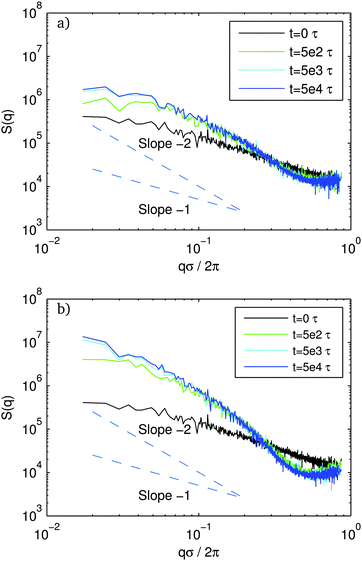
In Fig. 3, we show the structure factor, S(q), at various times during gelation for f = 40% (typical of a rigid, strong network) and f = 80% (approaching the bundling transition and rigidity loss) at three different times: t = 5 × 10²τ, t = 5 × 10³τ, and t = 5 × 10⁴τ. To compute the scattering intensity, we simply take the individual beads making up the rod to be point scatterers.where
![[r with combining right harpoon above (vector)]](https://www.rsc.org/images/entities/i_char_0072_20d1.gif) i is the position of bead i and N is the total number of beads in the system. S(q) is then an isotropic average of S(
i is the position of bead i and N is the total number of beads in the system. S(q) is then an isotropic average of S(![[q with combining right harpoon above (vector)]](https://www.rsc.org/images/entities/i_char_0071_20d1.gif) ). Note that we non-dimensionalize the wave vector by the rod diameter rather than the rod length.§ Recall that we start from an equilibrated hard-rod state. For spatially uncorrelated rods with uniform uncorrelated orientation, S ∼ q−1. Our data are consistent with this behavior in the initial equilibrated hard-rod state, but quickly depart from this as gelation proceeds. The departure is largest and most rapid for the systems with the highest f on the verge of bundling.
). Note that we non-dimensionalize the wave vector by the rod diameter rather than the rod length.§ Recall that we start from an equilibrated hard-rod state. For spatially uncorrelated rods with uniform uncorrelated orientation, S ∼ q−1. Our data are consistent with this behavior in the initial equilibrated hard-rod state, but quickly depart from this as gelation proceeds. The departure is largest and most rapid for the systems with the highest f on the verge of bundling.
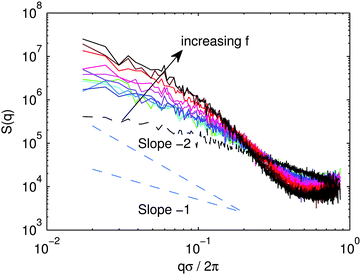
For any f, the structure has long-lived evolution. It is still evolving at the longest times studied with systematically increasing power at the smallest wavevector for all f. In Fig. 4, we plot S(q) at long time for various f. For all f, the intermediate regime for q between the bead scale q/2π ≈ 1/σ and the rod scale, q/2π ≈ 1/L, S(q) is significantly steeper than q−1. For f < 60%, the spectra are difficult to distinguish from each other. The slope is somewhere between −1 and −2 and is roughly constant over the whole range of qσ/2π. For f ≥ 70% For large f, the slope is steeper than −2 for 1 × 10⁻¹ ≤ qσ/2π ≤ 5 × 10⁻¹.
One might expect one of the several idealized behaviors for rod networks.92,93 On very general grounds, at wavelengths longer than the longest wavelength over which structure is correlated, S(q) should become flat. At shorter wavelength, one would expect the structure to look different in the cases of rigid networks and disconnected clusters.
The idealized case of homogeneous rigid rod networks consists of a single characteristic “pore size”, ξpore. ξpore is envisioned to be less than the rod length, L, and it decreases with increasing volume fraction as the pore space closes. At high q where qξpore ≥ 2π, the structure factor displays the characteristic shape for the rigid uncorrelated rods, S ∼ q−1. At longer wavelength, qξpore ≤ 2π, the density becomes uncorrelated and S ∼ const. Fractal networks55,92,94 present an alternative picture where there is no characteristic pore size and S(q) follows a power law with a non-trivial exponent out to the largest lengths.
At densities too low for gel formation, and for ε ≫ kT, disconnected clusters are thought to form via DLA. In the idealized case of fractal clusters, S(q) for qL ≪ 1 scales like S ∼ q−D where D is the fractal dimension of the cluster,88 as in the case of diffusion limited cluster formation of spheres. Beyond the characteristic cluster size qξcluster < 2π, the density becomes uncorrelated and Sconst. The fractal dimension depends on the aspect ratio. Clusters of rods formed via DLA with an aspect ratio near those studied here have D ≈ 2.1.88
At late times, for all f, we never observe a clear plateau in S(q) or any other characteristic scale indicating any sort of “pore” at shorter wavelength than the rod length. The S(q) curve of the more highly bundled systems at high f starts off with a high slope in the qL ≈ 2π regime and starts to slightly flatten at the smallest q, but no clear plateau emerges for the system sizes studied here. The more homogeneous networks have a roughly constant slope between 1 and 2 throughout most of the range, and we can essentially rule out the development of a characteristic pore scale at nearby q. Our data for the more regular networks at low f could be consistent with the fractal network models, while the bundled networks at high f might be more in line with the homogeneous rod network picture with ξpore ≥ L. The emergence of a characteristic scale could be a signature for the impending network collapse. However, one should be careful in interpreting this characteristic scale as a pore size; it might be better to think of it as the characteristic scale of the bundles which form in the disconnected state.
3.2 Dynamics
In Fig. 5, we plot the energy as a function of time for the ensembles with various f. The potential energy, U, is normalized by both εLJ and the total number of attractive beads, n, at the given f. Recall, all simulations here were for a binding energy of εLJ = 10kT. Because of the strong binding, the energy almost always decreases as more and more links form. Because of these essentially athermal dynamics, the normalized energy serves as a simple proxy for the total number of attractive contacts. Systems which have a value of more than −1 have fewer than one bond on average for each potential binding site. Systems that have a value of less than −4 have more than four bonds on average for each potential binding site. This is a manifestation of the thick bundles observed for the uniform rods in Fig. 2.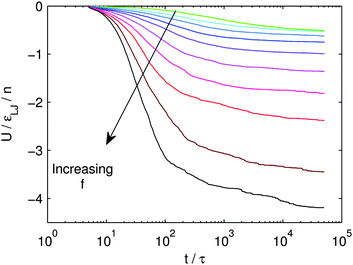 | ||
| Fig. 5 Energy vs. time for various f. The total energy is normalized by the total number of attractive sites for any f. | ||
Note that the energy is still relaxing at the longest times simulated, corresponding to t = 5 × 10⁴τ. The slow relaxation is reminiscent of glassy relaxation and logarithmic compaction in granular tapping experiments.95,96 As the network becomes increasingly slow and rigid, it becomes harder and harder to find new crosslinking sites. Furthermore, in the systems with relatively high f, there are large, discrete energy drops. In real space, these events correspond to large restructuring events where branches of the network effectively merge into thicker ones.
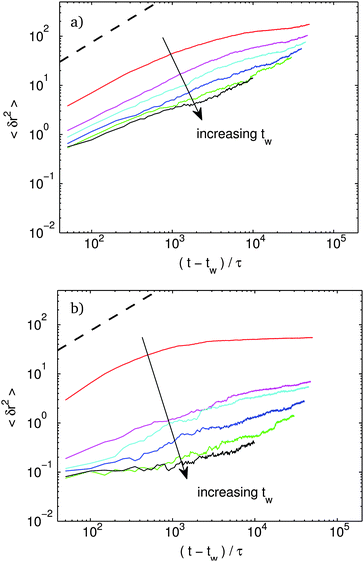
In Fig. 6, we plot the mean squared displacement (MSD) of rod centers at various waiting time, tw for f = 10% and f = 40%. Fig. 7 shows the same MSD plots for f = 80% and f = 90%. The heavy dashed line in the upper corner represents free diffusion of a single bead. For f = 10%, for the very youngest systems, the MSD curves start in a diffusive regime and show a flattening as clusters start to form. Even for the oldest systems, the curves remain subdiffusive at long time and never show any clear solid-like plateau at intermediate time. Despite the lack of a plateau in the MSD curve, as we show below, a rigid backbone has already developed, and the system does have a well defined shear modulus.
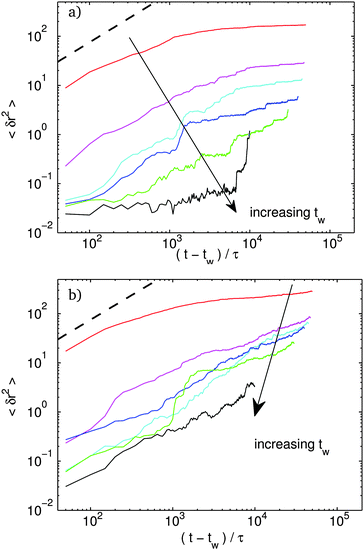 | ||
| Fig. 7 The same as Fig. 6 for (a) f = 80%, (b) f = 90%. | ||
At a slightly higher f, the MSD starts to develop a proper plateau, at intermediate times, characteristic of a solid. At long times, the MSD values depart from the plateau with a pronounced sub-diffusive slope. This long time behavior is much like the lower f systems which do not develop any plateau. As we show below, we find little difference in the non-linear mechanical response when comparing the systems with and without a plateau.
Above about f = 50%, a new trend emerges. The dynamics becomes bursty for old systems. Consider the system with f = 80%. The oldest sample shows an initial plateau. The plateau is lower than the f = 40% system indicating increased stiffness at intermediate times. But the f = 80% system shows a sudden jump by almost two orders of magnitude at t − tw ≈ 104τ. In real space these events correspond to large discrete reconfigurations where large branches of the network reorient and merge with others.¶ These bursts are direct manifestations of the large energy drops observed above in Fig. 5. As f increases, the height of the initial plateau is roughly constant. However, the jumps corresponding to shifts in the plateau height become bigger in magnitude indicating larger events.
Finally at a binding fraction above f = 90%, there is no longer any solid-like MSD plateau. In real space, there is complete bundling of rods and collapse of the network. The loading curves we present below indicate that, in many – but not all – of the members of the ensemble, the structure is no longer rigid and has no low frequency storage modulus. These members of the ensemble with disconnected clusters and no rigid backbone give rise to essentially diffusive behavior with a diffusion coefficient roughly 3 orders of magnitude below a free rod. We presume that if we were able to run the simulation for a longer time, the diffusion coefficient would go down even further as the disconnected clusters continue to coarsen. We conjecture that once the characteristic bundle size reaches the rod length, the bundles would start to aggregate into clumps much like in conventional DLA of spherical particles. Checking this conjecture would, of course, require simulations at significantly longer lengthscales.
4 Non-linear mechanical response
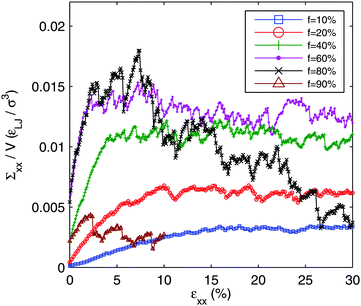
In Fig. 8, we plot the axial stress vs. axial strain (in extension) for various f. The networks are aged for the full t = 5 × 10⁴τ and then relaxed with a short zero temperature simulation to find a nearby mechanical equilibrium state without allowing further aging of the network. The networks are then loaded in an athermal, quasi static protocol: the cell is slowly deformed under a zero temperature Brownian dynamics. We deform the systems along one axis of the box, x, such that the length of the box on that axis, Lx = (1 + ε)Lx0, where Lx0 is its initial length and ε is the axial strain. Note that in this loading protocol, we neither preserve volume nor control the loads transverse to the extension direction. Eight independent runs are conducted at each f to improve statistics.At all f, studied here, a rigid network forms in at least some of the members of the ensemble. In Fig. 9, we show the full set of 8 systems for f = 20% and f = 80%. After the initial gelation, all the systems acquire a residual tensile stress. Upon deformation the tensile stress increases linearly, with discrete drops at well define strains. These events are reminiscent of the elementary plastic yielding events observed in amorphous solids.97 Along any one of the linear ramps, the deformation is completely reversible. After (and only after) any of the load drops, the deformation becomes irreversible, and the system does not revert to previous configurations upon unloading.
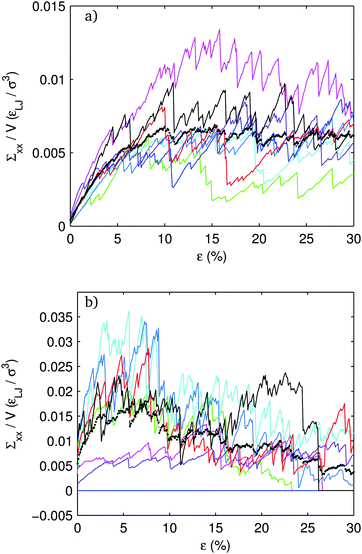 | ||
| Fig. 9 Axial stress vs. strain for different systems in an ensemble with (a) f = 20%, (b) f = 80%. Blue-dashed curve is the average of 8 systems shown in Fig. 8. | ||
The loading curves have a remarkable dependence on f. For the lowest f there is a slight strain stiffening. The slope of the loading curve goes up with strain. This is similar to what is seen in spring networks98 where the imposed shearing activates tension in branches of the network in initially unloaded, floppy, strands. For f = 10%, the stress increases essentially monotonically throughout the range of strain. In this sense, it can be considered a tough, ductile material.
As f increases, the initial tensile stress and slope increase. For f = 20%, the stress also reaches a long-time plateau. However, it reaches this plateau, by about 10% strain, much more quickly than the f = 10% system. The f = 40% is qualitatively the same as f = 20%, but with an even sharper crossover to the yield stress plateau at an even smaller strain of about 4%. By f = 60%, the loading curves start to change qualitatively. The stress no longer monotonically increases. The f = 60% loading curve exhibits a peak stress between about 5% and 10% strain with a slight softening beyond that. The f = 80% system shows a peak stress of roughly the same height and at roughly the same strain as the f = 60% system, but with a dramatically larger softening.
Looking at the individual members of an ensemble, shown in Fig. 9, gives more insight. At f = 20% all of the systems in the ensemble are rigid. The fluctuations about the average stress in steady shear are on the order of the average. The system with the largest peak stress shows some softening upon approaching to the steady state, but none of the others do. None of the systems show any tendency for softening in the steady regime and all systems remain rigid out to 30% strain.
At f = 80% the picture is qualitatively different. There are much more dramatic fluctuations within the ensemble. One of the 8 systems is not even rigid. Two of the rigid systems start well below the ensemble average stress and are much less stiff. These two systems do not show very much softening during shear. In contrast, those systems that lie above the ensemble average show a very pronounced softening after the peak stress. By the end of the 30% strain interval, three systems, in addition to the one which failed to percolate initially, have completely failed. The picture which emerges is that, although these high f systems are stiffer and stronger on average, they are much more fragile and have a significantly lower strain threshold before rigidity breaks down and the stress drops to zero.
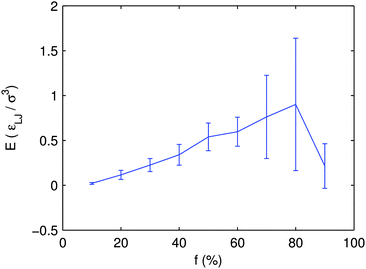
The initial linear ramps in the loading curves allow us to define an elastic modulus. In Fig. 10, we plot the elastic modulus for various f. The error bars represent the variance of the modulus across the members of the ensemble. At low f, the modulus and fluctuations increase with increasing f. Finally, at 80%, the modulus reaches a maximum and drops dramatically to zero at larger f. This peak value of the modulus occurs at roughly the same value of f where we first observe the catastrophic softening behavior in steady shear.
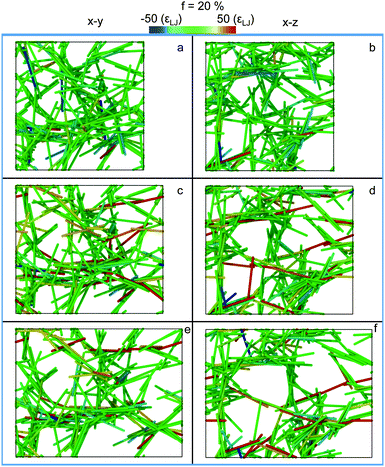
In Fig. 11 and 12, we show orthographic projection in the x–y and x–z planes of the rods during loading for f = 20% (below optimal) and f = 80% (above optimal) for the initial relaxed state, after loading to 15% and 30%. The rods are colored according to Σxx, the component of the static virial conjugate to the applied axial strain εxx. Red indicates tension, blue compression, and green unstressed rods.
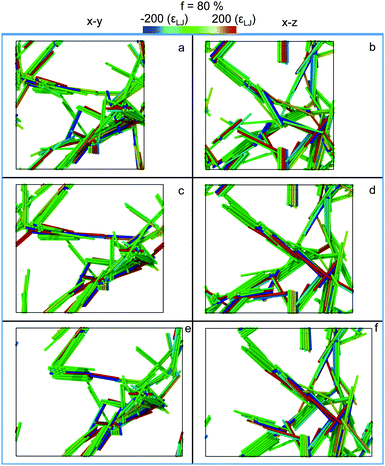 | ||
| Fig. 12 The same as Fig. 11, but for f = 80%. | ||
There are dramatic differences between the two systems. The f = 20% system is much more homogeneous with a well dispersed, network which is globally isotropic. The red rods supporting the large tensile loads at 30% strain tend to be aligned along the extension axis. These same rods started in the unsheared network with stresses that were smaller in magnitude but still tensile in nature and with orientations which were predominantly along the loading axis.
The f = 80% system is very different. In the unsheared state, it shows significant bundling of rods (discussed above) and a few thick network branches composed of these bundles. Much of the network undergoes very little reorientation under shear while only those branches oriented along the extension axis undergo elongation. One would naively guess that the system should be stronger because of the increased number of inter-rod binding sites. However, it is actually weaker since there are fewer network branches to support the applied load. The resulting deformation is much less homogeneous.
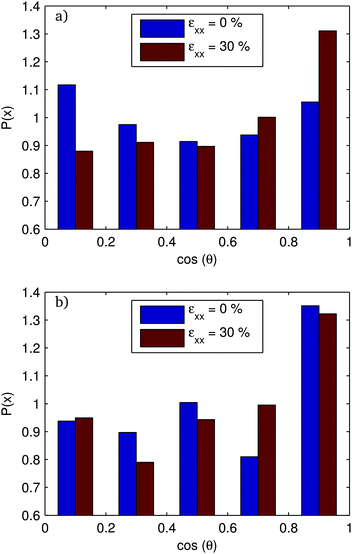
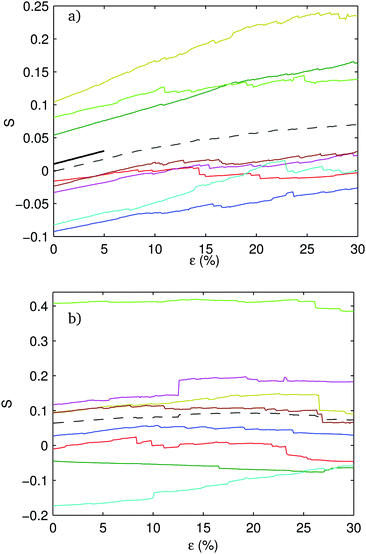
In Fig. 13 and 14, we show the distribution of the angle-cosines (for the angle of the rod with respect to the extension axis) at the initial unstrained configuration and for a strain of 30% along with the nematic order parameter, S = 〈3![[thin space (1/6-em)]](https://www.rsc.org/images/entities/char_2009.gif) cos2(θ) − 1〉/2. For f = 20%, S increases smoothly and essentially monotonically throughout the range, starting from around S = 0 and ending at around S = 7%. The f = 80% system has large fluctuations in S. The unsheared systems show large fluctuations within the ensemble. This is due to the perfect orientational ordering within bundles. Each bundle has a given orientation. There are fewer independent orientations over which to average, and the orientation distribution is subject to small number statistics. S values have strong member-to-member fluctuations within the ensemble.
cos2(θ) − 1〉/2. For f = 20%, S increases smoothly and essentially monotonically throughout the range, starting from around S = 0 and ending at around S = 7%. The f = 80% system has large fluctuations in S. The unsheared systems show large fluctuations within the ensemble. This is due to the perfect orientational ordering within bundles. Each bundle has a given orientation. There are fewer independent orientations over which to average, and the orientation distribution is subject to small number statistics. S values have strong member-to-member fluctuations within the ensemble.
We can attempt to understand the predominant value of the slope of the S vs. ε curves using a simple model where any rod is just advected with the homogeneous, affine deformation. If we assume that the component of the velocity of the tip of a rod perpendicular to its length is equal to the homogeneous affine flow field at that point, we get:
vθ = −![[small epsi, Greek, dot above]](https://www.rsc.org/images/entities/i_char_e0a1.gif) L L![[thin space (1/6-em)]](https://www.rsc.org/images/entities/char_2009.gif) cos(θ)sin(θ) cos(θ)sin(θ) | (2) |
 | (3) |
 | (4) |
 | (5) |
 | (6) |
 | (7) |
 , whose average is 0.37, just slightly less than 2/5. The initial values of S show some scatter, and so do the slopes, but all systems within the ensemble have their rods re-oriented toward the extension axis. The basic picture which emerges is that, for the well connected networks, the rod orientations essentially follow the homogeneous affine flow.
The f = 80% ensemble shows dramatically different behavior. Within the ensemble, there is a broad distribution of initial values of S due to the poor counting statistics associated with the relatively few independently oriented thick network strands. Many systems show strongly non-affine motion with hardly any reorientation of rods at all. In these systems, a small number of thick trunks of the load bearing network extend in response to the strain and eventually disconnect without appreciable reorientation of rods. This suggests that strongly non-affine behavior of S(ε) might be taken as indicative of poor mechanical properties and potential catastrophic failure after peak load.
5 Conclusions
We presented the results of a simple model for aggregation and mechanical response of rod-like particles, and showed that the networks that form depend on the details of the inter rod interactions. If the rods were uniformly attractive with no irregularity in the surface interactions, disconnected clusters form. In our simple model, the rods were composed of beads with a fraction, f, which were able to stick to other beads of the attractive variety on other rods. We studied structure and dynamics during gelation, and we then subjected the well-aged gels to athermal quasi-static straining to probe the mechanical robustness of the networks. We showed that intermediate values of f gave optimal mechanical properties (enhanced modulus, yield stress, and total strain to failure) and dramatically different spatial structure and gelation dynamics than the either low or high values of f. In this sense, these results may be seen as providing guiding principles for tailoring surface interactions between rods for optimal structural, mechanical, or electronic properties.The dynamical measurements during gelation are most directly comparable to experiments by Chen et al. on NaDDBS-stabilized single walled CNTs suspended in water.25 Chen et al. used tracer diffusion and found a short-time diffusion coefficient of roughly 1 μm2 s−1 after aging for tw = 10 minutes, which was essentially a plateau in the MSD at a value of about 2 × 10⁻³ μm2 after tw = 3 hours. The height of the plateau was still decreasing at that time. There are striking similarities to the MSD curves for our systems in the intermediate range of f. In particular, the value of the MSD at the onset of the plateau is reduced by about two orders of magnitude from the early, tw → 0 limit, and this is consistent with the data from our model.
The work presented here should be considered a first step toward modeling the aggregation of nominally-stabilized suspensions of rod-like particles. It opens up many directions for future work. (i) As we have shown above, the structure shows no characteristic length scale for the optimal systems at intermediate f. Does one emerge just beyond the limited system sizes studied here as in the conventional homogeneous rod network picture,99 or does one have fractal structure out to the longest lengths?55,92,94 Larger simulations are necessary. (ii) In this study we have worked at a constant aspect ratio and volume fraction well above the threshold for gel formation. One would guess that the critical volume fraction, ϕ, for gel formation would be strongly dependent on f, with the more bundled networks forming at higher f requiring higher ϕ to gel. The ϕ dependence should be checked explicitly. (iii) The strong system-to-system fluctuations within the ensemble at high f (a few systems have zero modulus at f = 80%, while a few systems have finite modulus at f = 90%) would indicate strong finite size effects. Is there a phase transition underlying these effects, and would there be a sharp transition fc with fc < 1 beyond which no systems gel in the infinite size limit? In analogy with rigidity percolation or jamming, one could plot the fraction of rigid systems in the ensemble as a function of f for various system sizes. One would expect, in general, a sigmoidal shape where both the width and the location of the transition would depend on system size. A finite size analysis is called for. (iv) There should be a lower bound on f, below which there are too few cross linking sites to form a network. Can we use arguments from rigidity percolation to understand how the modulus in the virgin, unstrained systems depends on the number of cross linking sites and/or the number of active cross links formed after gelation? (iv) We have shown that the systems at intermediate f are extremely robust mechanically. They can be strained to 30% at essentially constant stress with little hardening or softening. In applications, such as flexible electronics,100,101 it is crucial to understand the ultimate strain the network can sustain before it falls apart, and it would be very interesting to continue the simulations at intermediate f out to larger strains and ultimate failure.
Acknowledgements
This material is based upon the work supported by the National Science Foundation under Award Numbers NSF-CMMI-1250199, and the Air Force Office of Scientific Research under grant number AFOSR FA9550-13-1-0123.References
- V. M. Cepak and C. R. Martin, J. Phys. Chem. B, 1998, 102, 9985–9990 CrossRef CAS.
- M. J. A. Hore and R. J. Composto, ACS Nano, 2010, 4, 6941–6949 CrossRef CAS PubMed.
- J. M. Romo-Herrera, R. A. Alvarez-Puebla and L. M. Liz-Marzan, Nanoscale, 2011, 3, 1304–1315 RSC.
- J. Vonnemann, N. Beziere, C. Böttcher, S. B. Riese, C. Kuehne, J. Dernedde, K. Licha, C. von Schacky, Y. Kosanke, M. Kimm, R. Meier, V. Ntziachristos and R. Haag, Theranostics, 2014, 4, 629–641 CrossRef CAS PubMed.
- R. M. Erb, R. Libanori, N. Rothfuchs and a. R. Studart, Science, 2012, 335, 199–204 CrossRef CAS PubMed.
- E. J. Garboczi, K. A. Snyder, J. F. Douglas and M. F. Thorpe, Phys. Rev. E: Stat. Phys., Plasmas, Fluids, Relat. Interdiscip. Top., 1995, 52, 819–828 CrossRef CAS.
- M. Adams, Z. Dogic, S. L. Keller and S. Fraden, Nature, 1998, 393, 349–352 CrossRef CAS.
- P. Terech, L. Chazeau and J. Y. Cavaille, Macromolecules, 1999, 32, 1872–1875 CrossRef CAS.
- M. M. D. Lima and R. Borsali, Macromol. Rapid Commun., 2004, 25, 771–787 CrossRef PubMed.
- F. M. Du, R. C. Scogna, W. Zhou, S. Brand, J. E. Fischer and K. I. Winey, Macromolecules, 2004, 37, 9048–9055 CrossRef CAS.
- C. A. Dyke and J. M. Tour, J. Phys. Chem. A, 2004, 108, 11151–11159 CrossRef CAS.
- M. Moniruzzaman and K. I. Winey, Macromolecules, 2006, 39, 5194–5205 CrossRef CAS.
- N. G. Sahoo, S. Rana, J. W. Cho, L. Li and S. H. Chan, Prog. Polym. Sci., 2010, 35, 837–867 CrossRef CAS PubMed.
- A. V. Kyrylyuk and P. van der Schoot, Proc. Natl. Acad. Sci. U. S. A., 2008, 105, 8221–8226 CrossRef CAS PubMed.
- M. A. Zirnsak, D. V. Boger and V. Tirtaatmadja, J. Rheol., 1999, 43, 627–650 CrossRef CAS.
- C. F. Schmid, L. H. Switzer and D. J. Klingenberg, J. Rheol., 2000, 44, 781–809 CrossRef CAS.
- K. Dawson, G. Foffi, M. Fuchs, W. Gotze, F. Sciortino, M. Sperl, P. Tartaglia, T. Voigtmann and E. Zaccarelli, Phys. Rev. E: Stat., Nonlinear, Soft Matter Phys., 2001, 63, 011401 CrossRef CAS.
- F. Sciortino, S. Mossa, E. Zaccarelli and P. Tartaglia, Phys. Rev. Lett., 2004, 93, 5–8 CrossRef.
- P. J. Lu, E. Zaccarelli, F. Ciulla, A. B. Schofield, F. Sciortino and D. A. Weitz, Nature, 2008, 453, 499–U4 CrossRef CAS PubMed.
- E. Zaccarelli, J. Phys.: Condens. Matter, 2007, 19, 323101 CrossRef.
- M. P. B. van Bruggen, J. K. G. Dhont and H. N. W. Lekkerkerker, Macromolecules, 1999, 32, 2256–2264 CrossRef CAS.
- X. Fan, N. Phan-Thien and R. Zheng, J. Non-Newtonian Fluid Mech., 1998, 74, 113–135 CrossRef CAS.
- C. J. Petrie, J. Non-Newtonian Fluid Mech., 1999, 87, 369–402 CrossRef CAS.
- Y.-G. Tao, W. den Otter and W. Briels, Phys. Rev. Lett., 2005, 95, 237802 CrossRef.
- A. Mohraz and M. J. Solomon, J. Colloid Interface Sci., 2006, 300, 155–162 CrossRef CAS PubMed.
- D. T. N. Chen, K. Chen, L. A. Hough, M. F. Islam and A. G. Yodh, Macromolecules, 2010, 43, 2048–2053 CrossRef CAS.
- K. Shikinaka, K. Kaneda, S. Mori, T. Maki, H. Masunaga, Y. Osada and K. Shigehara, Small, 2014, 10, 1813–1820 CrossRef CAS PubMed.
- S. Lin-Gibson, J. Pathak, E. Grulke, H. Wang and E. Hobbie, Phys. Rev. Lett., 2004, 92, 048302 CrossRef CAS.
- E. Hobbie and D. Fry, Phys. Rev. Lett., 2006, 97, 036101 CrossRef CAS.
- R. Bandyopadhyaya, E. Nativ-Roth, O. Regev and R. Yerushalmi-Rozen, Nano Lett., 2002, 2, 25–28 CrossRef CAS.
- M. F. Islam, E. Rojas, D. M. Bergey, A. T. Johnson and A. G. Yodh, Nano Lett., 2003, 3, 269–273 CrossRef CAS.
- O. Matarredona, H. Rhoads, Z. R. Li, J. H. Harwell, L. Balzano and D. E. Resasco, J. Phys. Chem. B, 2003, 107, 13357–13367 CrossRef CAS.
- O. Matarredona, H. Rhoads, Z. R. Li, J. H. Harwell, L. Balzano and D. E. Resasco, J. Phys. Chem. B, 2003, 107, 13357–13367 CrossRef CAS.
- E. K. Hobbie and D. J. Fry, J. Chem. Phys., 2007, 126, 124907 CrossRef CAS PubMed.
- M. D. Clark, S. Subramanian and R. Krishnamoorti, J. Colloid Interface Sci., 2011, 354, 144–151 CrossRef CAS PubMed.
- E. K. Hobbie, Rheol. Acta, 2010, 49, 323–334 CrossRef CAS.
- A. J. Blanch, C. E. Lenehan and J. S. Quinton, J. Phys. Chem. B, 2010, 114, 9805–9811 CrossRef CAS PubMed.
- S. H. Qin, D. Q. Qin, W. T. Ford, D. E. Resasco and J. E. Herrera, Macromolecules, 2004, 37, 752–757 CrossRef CAS.
- M. J. O'Connell, P. Boul, L. M. Ericson, C. Huffman, Y. Wang, E. Haroz, C. Kuper, J. Tour, K. D. Ausman and R. E. Smalley, Chem. Phys. Lett., 2001, 342, 265–271 CrossRef.
- C. Zakri and P. Poulin, J. Mater. Chem., 2006, 16, 4095–4098 RSC.
- W. Zhou, M. F. Islam, H. Wang, D. L. Ho, A. G. Yodh, K. I. Winey and J. E. Fischer, Chem. Phys. Lett., 2004, 384, 185–189 CrossRef CAS PubMed.
- D. Fry, B. Langhorst, H. Kim, E. Grulke, H. Wang and E. Hobbie, Phys. Rev. Lett., 2005, 95, 038304 CrossRef CAS.
- H. Wang, W. Zhou, D. L. Ho, K. I. Winey, J. E. Fischer, C. J. Glinka and E. K. Hobbie, Nano Lett., 2004, 4, 1789–1793 CrossRef CAS.
- N. R. Tummala and A. Striolo, ACS Nano, 2009, 3, 595–602 CrossRef CAS PubMed.
- B. J. Bauer, E. K. Hobbie and M. L. Becker, Macromolecules, 2006, 39, 2637–2642 CrossRef CAS.
- L. Hough, M. Islam, P. Janmey and A. Yodh, Phys. Rev. Lett., 2004, 93, 168102 CrossRef CAS.
- M. O'Connell, P. Boul and L. Ericson, Chem. Phys., 2001, 342, 265–271 Search PubMed.
- M. Calvaresi, S. Hoefinger and F. Zerbetto, Chemistry, 2012, 18, 4308–4313 CrossRef CAS PubMed.
- L. A. Hough, M. F. Islam, B. Hammouda, A. G. Yodh and P. A. Heiney, Nano Lett., 2006, 6, 313–317 CrossRef CAS PubMed.
- L. Vaisman, H. D. Wagner and G. Marom, Adv. Colloid Interface Sci., 2006, 128, 37–46 CrossRef PubMed.
- N. Grossiord, P. van der Schoot, J. Meuldijk and C. E. Koning, Langmuir, 2007, 23, 3646–3653 CrossRef CAS PubMed.
- M. Suttipong, N. R. Tummala, B. Kitiyanan and A. Striolo, J. Phys. Chem. C, 2011, 115, 17286–17296 CAS.
- N. M. Uddin, F. M. Capaldi and B. Farouk, Comput. Mater. Sci., 2012, 53, 133–144 CrossRef CAS PubMed.
- M. Calvaresi, M. Dallavalle and F. Zerbetto, Small, 2009, 5, 2191–2198 CrossRef CAS PubMed.
- T. Chatterjee, A. Jackson and R. Krishnamoorti, J. Am. Chem. Soc., 2008, 130, 6934–6935 CrossRef CAS PubMed.
- B. Vigolo, C. Coulon, M. Maugey, C. Zakri and P. Poulin, Science, 2005, 309, 920–923 CrossRef CAS PubMed.
- V. A. Davis, A. N. G. Parra-Vasquez, M. J. Green, P. K. Rai, N. Behabtu, V. Prieto, R. D. Booker, J. Schmidt, E. Kesselman, W. Zhou, H. Fan, W. W. Adams, R. H. Hauge, J. E. Fischer, Y. Cohen, Y. Talmon, R. E. Smalley and M. Pasquali, Nat. Nanotechnol., 2009, 4, 830–834 CrossRef CAS PubMed.
- M. Calvaresi, S. Hoefinger and F. Zerbetto, Chemistry, 2012, 18, 4308–4313 CrossRef CAS PubMed.
- M. J. Green, A. N. G. Parra-Vasquez, N. Behabtu and M. Pasquali, J. Chem. Phys., 2009, 131, 1–10 CrossRef PubMed.
- V. A. Davis, L. M. Ericson, A. N. G. Parra-Vasquez, H. Fan, Y. H. Wang, V. Prieto, J. A. Longoria, S. Ramesh, R. K. Saini, C. Kittrell, W. E. Billups, W. W. Adams, R. H. Hauge, R. E. Smalley and M. Pasquali, Macromolecules, 2004, 37, 154–160 CrossRef CAS.
- F. Huang, R. Rotstein, S. Fraden, K. E. Kasza and N. T. Flynn, Soft Matter, 2009, 5, 2766–2771 RSC.
- A. P. Philipse and A. M. Wierenga, Langmuir, 1998, 14, 49–54 CrossRef CAS.
- M. P. B. van Bruggen, Langmuir, 1998, 14, 2245–2255 CrossRef CAS.
- M. P. B. van Bruggen and H. N. W. Lekkerkerker, Langmuir, 2002, 18, 7141–7145 CrossRef CAS.
- M. van Bruggen, H. Lekkerkerker and J. Dhont, Phys. Rev. E: Stat. Phys., Plasmas, Fluids, Relat. Interdiscip. Top., 1997, 56, 4394–4403 CrossRef CAS.
- A. Wierenga, A. P. Philipse, H. N. W. Lekkerkerker and D. V. Boger, Langmuir, 1998, 14, 55–65 CrossRef CAS.
- G. M. H. Wilkins, P. T. Spicer and M. J. Solomon, Langmuir, 2009, 25, 8951–8959 CrossRef CAS PubMed.
- A. S. Karakoti, S. Das, S. Thevuthasan and S. Seal, Angew. Chem., Int. Ed., 2011, 50, 1980–1994 CrossRef CAS PubMed.
- S. Pierrat, I. Zins, A. Breivogel and C. Sönnichsen, Nano Lett., 2007, 7, 259–263 CrossRef CAS PubMed.
- R. A. Sperling and W. J. Parak, Philos. Trans. R. Soc., A, 2010, 368, 1333–1383 CrossRef CAS PubMed.
- L. Vigderman, B. P. Khanal and E. R. Zubarev, Adv. Mater., 2012, 24, 4811–4841 CrossRef CAS PubMed.
- J. Araki, M. Wada, S. Kuga and T. Okano, Langmuir, 2000, 16, 2413–2415 CrossRef CAS.
- J. Araki, M. Wada and S. Kuga, Langmuir, 2001, 17, 21–27 CrossRef CAS.
- Y. Boluk, L. Zhao and V. Incani, Langmuir, 2012, 28, 6114–6123 CrossRef CAS PubMed.
- S. J. Eichhorn, Soft Matter, 2011, 7, 303 RSC.
- Y. Habibi, L. A. Lucia and O. J. Rojas, Chem. Rev., 2010, 110, 3479–3500 CrossRef CAS PubMed.
- M. Hasani, E. D. Cranston, G. Westman and D. G. Gray, Soft Matter, 2008, 4, 2238–2244 RSC.
- Z. Dogic, K. R. Purdy, E. Grelet, M. Adams and S. Fraden, Phys. Rev. E: Stat., Nonlinear, Soft Matter Phys., 2004, 69, 051702 CrossRef.
- E. Grelet and S. Fraden, Phys. Rev. Lett., 2003, 90, 198302 CrossRef.
- P. Holmqvist, M. Ratajczyk, G. Meier, H. Wensink and M. Lettinga, Phys. Rev. E: Stat., Nonlinear, Soft Matter Phys., 2009, 80, 031402 CrossRef CAS.
- N. Krishna Reddy, Z. Zhang, M. Paul Lettinga, J. K. G. Dhont and J. Vermant, J. Rheol., 2012, 56, 1153 CrossRef CAS.
- Z. K. Zhang, N. Krishna, M. P. Lettinga, J. Vermant and E. Grelet, Langmuir, 2009, 25, 2437–2442 CrossRef CAS PubMed.
- M. Ripoll, P. Holmqvist, R. Winkler, G. Gompper, J. Dhont and M. Lettinga, Phys. Rev. Lett., 2008, 101, 168302 CrossRef CAS.
- P. G. Bolhuis, A. Stroobants, D. Frenkel and H. N. W. Lekkerkerker, J. Chem. Phys., 1997, 107, 1551 CrossRef CAS PubMed.
- P. Bolhuis and D. Frenkel, J. Chem. Phys., 1997, 106, 666–687 CrossRef CAS PubMed.
- M. Das, F. C. MacKintosh and A. J. Levine, Phys. Rev. Lett., 2007, 99, 38101 CrossRef.
- T. Zhang, J. M. Schwarz and M. Das, Phys. Rev. E: Stat., Nonlinear, Soft Matter Phys., 2014, 90, 062139 CrossRef CAS.
- J. R. Rothenbuhler, J.-R. Huang, B. A. DiDonna, A. J. Levine and T. G. Mason, Soft Matter, 2009, 5, 3639–3645 RSC.
- P. G. Bolhuis, A. Stroobants, D. Frenkel and H. N. W. Lekkerkerker, J. Chem. Phys., 1997, 107, 1551 CrossRef CAS PubMed.
- S. Plimpton, J. Comput. Phys., 1995, 117, 1–19 CrossRef CAS.
- M. P. Allen and D. J. Tildesley, Computer Simulation of Liquids, Clarendon Press, New York, NY, USA, 1989 Search PubMed.
- A. P. Philipse and A. M. Wierenga, Langmuir, 1998, 14, 49–54 CrossRef CAS.
- M. J. Solomon and P. T. Spicer, Soft Matter, 2010, 6, 1391 RSC.
- T. Chatterjee and R. Krishnamoorti, Soft Matter, 2013, 9, 9515–9529 RSC.
- J. B. Knight, C. G. Fandrich, C. N. Lau, H. M. Jaeger and S. R. Nagel, Phys. Rev. E: Stat. Phys., Plasmas, Fluids, Relat. Interdiscip. Top., 1995, 51, 3957–3963 CrossRef CAS.
- E. R. Nowak, J. B. Knight, M. L. Povinelli, H. M. Jaeger and S. R. Nagel, Powder Technol., 1997, 94, 79–83 CrossRef CAS.
- C. E. Maloney and A. Lemaître, Phys. Rev. E: Stat., Nonlinear, Soft Matter Phys., 2006, 74, 016118 CrossRef.
- M. Wyart, H. Liang, A. Kabla and L. Mahadevan, Phys. Rev. Lett., 2008, 101, 215501 CrossRef CAS.
- M. J. Solomon and P. T. Spicer, Soft Matter, 2010, 6, 1391 RSC.
- K. H. Kim, M. Vural and M. F. Islam, Adv. Mater., 2011, 23, 2865–2869 CrossRef CAS PubMed.
- M. K. Shin, J. Oh, M. Lima, M. E. Kozlov, S. J. Kim and R. H. Baughman, Adv. Mater., 2010, 22, 2663–2667 CrossRef CAS PubMed.
Footnotes |
| † Electronic supplementary information (ESI) available. See DOI: 10.1039/c5sm01845e |
| ‡ The purely repulsive WCA potential is simply the LJ potential cut off at the point of zero force. |
| § For L = 20σ, qσ/2π = 1/20 corresponds to the rod length. |
| ¶ See videos in the ESI.† |
| This journal is © The Royal Society of Chemistry 2015 |

