 Open Access Article
Creative Commons Attribution 3.0 Unported Licence
Microphase separation induced in the melt of Pluronic copolymers by blending with a hydrogen bonding urea–urethane end-capped supramolecular polymer†
Daniel
Hermida-Merino
ab,
Gemma E.
Newby
c,
Ian W.
Hamley
*d,
Wayne
Hayes
d and
Andrew
Slark
e
aBM26/DUBBLE, CRG, ESRF-The European Synchrotron, CS40220, 38043 Grenoble Cedex 9, France
bDutch Polymer Institute DPI, P.O. Box 902, Eindhoven 5600 AX, The Netherlands
cID09b, ESRF-The European Synchrotron, CS40220, 38043 Grenoble Cedex 9, France
dDepartment of Chemistry, University of Reading, Whiteknights, Reading, RG6 6AD, UK. E-mail: I.W.Hamley@reading.ac.uk
eHenkel UK Limited, Wexham Road, Slough, SL2 5DS, UK
First published on 30th June 2015
Abstract
Blending with a hydrogen-bonding supramolecular polymer is shown to be a successful novel strategy to induce microphase-separation in the melt of a Pluronic polyether block copolymer. The supramolecular polymer is a polybutadiene derivative with urea–urethane end caps. Microphase separation is analysed using small-angle X-ray scattering and its influence on the macroscopic rheological properties is analysed. FTIR spectroscopy provides a detailed picture of the inter-molecular interactions between the polymer chains that induces conformational changes leading to microphase separation.
Block copolymers are a fascinating class of macromolecules which have the ability to self-assemble into morphologies with ordered microphase-separated structures in solution,1–4 and in the melt2,5 and solid1,2 state. The ordering of these structures can be controlled with remarkable precision and as such these materials have received considerable interest in recent years6–8 as a result of their remarkable mechanical and structural properties.1,9–11
Blending of polymers provides a further versatile tool to tune morphology and properties. Triblock copolymers have been blended with homopolymers that selectively hydrogen bond with one of the blocks.12,13 Both of the individual polymers were disordered but upon mixing, a disorder-to-order transition was observed, creating ordered microphase – separated melt structures including cubic and lamellar morphologies. Order to order transitions have also been reported, for example from an FCC to a lamellar phase which is due to an increase in the effective Flory–Huggins interaction parameter between the components.14
Here we show that a strategy employing non-covalent interactions via blending with a hydrogen-bonding supramolecular polymer can be used to produce microphase separation in the melt of a well-known Pluronic type polyether block copolymer. This is interesting because the interaction is mainly driven by the urea–urethane functionalities in the polymer end groups, in contrast to existing studies on Pluronics interacting with homogeneous H-bonding polymer chains such as polyacrylic acid.12 In other words, there are only a few H-bonding interactions per supramolecular polymer chain. We used as a model amphiphilic copolymer Pluronic P12315 which was blended in the melt with the urea–urethane end-capped supramolecular polymer, PB-UR-OH16 (see Scheme 1) to investigate whether it was possible to create microphase-separated morphologies with novel structural and mechanical properties. Supramolecular end-capped bisurea and urea–urethane polymers possess the capability of forming hydrogen bonds by the association of the end-groups and bisurea moieties of the supramolecular segmented supramolecular polymers.16–23 Pluronics are a series of amphiphilic polyether block copolymers that continue to be exploited in many applications.3,7,24
To gain an insight into the structure and properties of the polymer blends, rheology, small – angle X-ray scattering (SAXS) and Fourier transform infrared (FTIR) spectroscopy were performed. The rheology and SAXS results can be coupled to provide a link between the macroscopic properties and the microstructure.4 FTIR provides detailed information at the molecular scale on the nature and strength of the association through hydrogen bonding interactions responsible for the microphase separation generated by the polymer blending. The polymer blends were investigated at three distinct temperatures (25, 45 and 75 °C) to probe the thermal stability of microphase-separated structures.
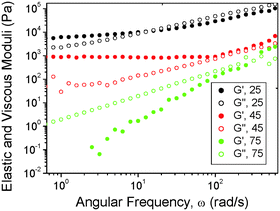
We first report on the effect of blending on the macroscopic mechanical properties. The frequency dependence of the dynamic shear moduli was measured for blends with different compositions at three temperatures. Fig. 1 shows representative data for a 70/30 (P123/PB_UR_OH) blend. The modulus was found to be G′ > 103 Pa at low frequency and largely frequency independent at 25 °C and 45 °C and also G′ > G′′ at low frequency. These features are consistent with microphase separation. Melting behavior was observed at 75 °C since the slopes of the power-law frequency (ω) dependence of G′ ∼ ωp (p = 1.82 ± 0.04) and G′ ∼ ωq (q = 0.98 ± 0.01) are close to those expected for a disordered block copolymer for which p = 2 and q = 1.1
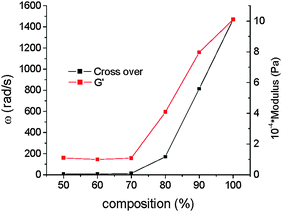
The crossover point of the elastic and viscous moduli appear at a characteristic angular frequency from which the relaxation time of the system may be determined by simply taking the reciprocal of the frequency. The values are presented in ESI,† Table S1 and plotted in Fig. 2 and Fig. S1 (ESI†). Interestingly, the crossover point follows a non-monotonic dependence with respect to the PB-UR-OH content. Both the modulus (G′) and the relaxation time of the system at the crossover point show a sharp increase above 70% P123.
 | ||
| Fig. 2 Angular frequency and modulus at the crossover point of the elastic and viscous moduli for blends with varying composition (shown as % P123) at 25 °C. | ||
This is correlated to the extent of microphase separation as shown through SAXS, to be discussed shortly. The values in ESI,† Table S1 show that generally the crossover points appear at higher frequencies at 45 and 75 °C than for the systems at 25 °C suggesting that as the temperature is increased the relaxation time shortens.
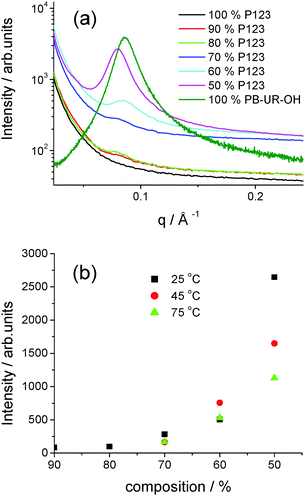
SAXS is a powerful tool to examine microphase separation in block copolymers in situ2 and was used to probe the ordering within the P123/PB-UR-OH blends. Representative SAXS profiles for a series of blends at 25 °C as well as the parent polymers are shown in Fig. 3. These results show no observed peak for P123 consistent with a lack of microphase separation, however, addition of PB-UR-OH leads to a peak at q* = 0.08 Å−1, indicating microphase separation. The corresponding domain spacing is d = 79 Å. The SAXS peak for the blends is significantly shifted from that for PB-UR-OH, discussed in detail in our previous paper16 (ca. q = 0.089 Å−1, i.e. d = 72 Å). The non-monotonic intensity increase of the SAXS reflection with increasing PB-UR-OH content as well as a slight shift to lower q seems to exclude the possibility of a simple dilution effect of the supramolecular morphology upon addition of the P123 (see Fig. 3), confirming the mechanical properties trend observed previously (see Fig. 2). Moreover, for a given blend composition, the intensity of the SAXS peak decreases upon increasing temperature (Fig. 3 and Fig. S2, ESI†), indicating a reduction in microphase separation.
 | ||
| Fig. 3 (a) SAXS profiles for the polymers and blends 25 °C (see ESI† for data at 45 °C and 75 °C) (b) SAXS intensity against composition (P123 content) at three distinctive temperatures (25 °C: black, 45 °C: red, 75 °C: green). | ||
It is seen that when a peak is present the position does not change significantly with temperature, the spacing being between 74–79 Å for the entire range of blends and temperatures (see ESI,† Fig. S2 and Table S2). It is noted that some of the systems only have a very weak and broad peak not classed as a lattice spacing. However, the presence of even a weak correlation peak does indicate that phase mixing in the blend is present to a small extent.
To understand the morphology of the blends, the SAXS results have been analysed by fitting the 100 wt% P123 and 50/50 wt% P123 PB-UR-OH SAXS profiles (see ESI,† Fig. S3). Both form and structure factors are required to define the overall structure (see ESI† for further details about the fitting parameters). A standard Gaussian polymer form factor with polydispersity in radius of gyration Rg of 3 to 5 nm was employed in line with the usual polydispersity of ±3% of the P123 polymer chains. In addition, a mass fractal structure factor was used to model the aggregate morphology. Mass fractals are employed to define clustered objects. A fractal dimension is usually observed between 1 and 3, giving an indication of the extent of branching within the system. The fractal dimension obtained from our fits was D = 2.8, signifying a highly branched globular structure. The model used to fit the 50/50 wt% P123 PB-UR-OH SAXS profile includes both the contribution from pure P123 and a second contribution (Lorentzian distribution) to model the PB-UR-OH scattering within the blend (see ESI,† Fig. S4). A decrease in polydispersity of the form factor of the Gaussian polymer (describing P123) due to the monodisperse nature of the added PB-UR-OH polymer is noted. The mass fractal from the structure factor increases slightly, indicating a more branched structure similar to that obtained in analogous blend systems. A Lorentzian structure factor was required to fit the correlation peak in the scattering profile.
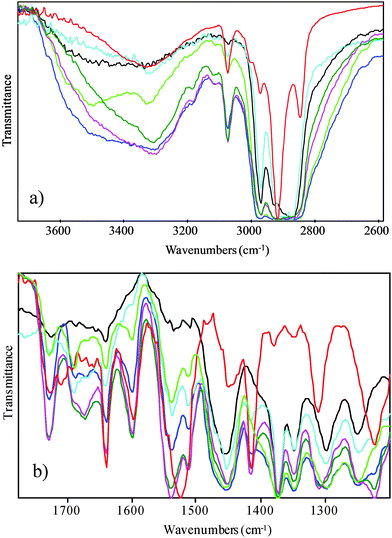
FTIR spectroscopy has been employed in order to probe non-covalent interactions associated with the structural organization upon blending. FTIR spectroscopic analysis has been employed extensively to examine the binding of hard and/or soft segments in segmented polyurethanes and polyureas but also the blending with polyethers or polysiloxanes.25 The analysis of the FTIR absorption bands permits to distinguish among the different interactions related to the functional groups (urea, urethane, hydroxyl and ether groups,25–28) featured by the polymers that are involved in the hydrogen bonds. The FTIR spectra of P123/PB-UR-OH polymer blends contain details of concomitant and competitive intra- and inter-polymeric interactions, depending on the overlapping of different vibrational modes (see Fig. 4). The addition of the PB-UR-OH to P123 will promote the interaction of the polar segments of both polymers. In particular, the ethylene oxide (EO) backbone groups of P123 will form hydrogen bonds to the end groups of the PB-UR-OH whilst interrupting the self-assembly of the hard segments of the PB-UR-OH. The interactions between hard segments in the blend will be assessed by a thorough analysis of the absorption bands (see ESI,† Table S3) related to the urea–EO hydrogen bonds to confirm the phase mixing of the blend component.
 | ||
| Fig. 4 FTIR spectra in two regions at 25 °C: black P123, green 90%, blue 80%, cyan 70%, olive 60%, magenta 50% and red PB-UR-OH. | ||
The absorption band centered at 3400–3000 cm−1 of the P123 FTIR spectrum is very broad and diminishes rapidly with increasing temperature, suggesting weak hydrogen bonds involving the hydroxyl groups. As PB-UR-OH was added to P123 the spectra of the polymer blends firstly shows the appearance of the free hydrogen bonding NH stretching absorption band (free N–H 3445–3495 cm−1)25 which subsequently decreases upon further PB-UR-OH addition (from 30% of PB-UR-OH). In addition, a concomitant sharpening of the signal centered at 3300 cm−1 characteristic of N–H⋯C![[double bond, length as m-dash]](https://www.rsc.org/images/entities/char_e001.gif) O hydrogen bonds29,30 together with a small shift to lower frequencies suggests the interaction of hard segments of the PB-UR-OH polymer with the ether linkage of the PEO groups at higher concentrations of PB-UR-OH (30%). Temperature increase leads to the disruption of the hydrogen bonds in the low and mid concentration regime (reappearance of the free NH signal at 3490 cm−1). The spectral region associated to the carbonyl stretching (amide I) reveals both free urethane and urea stretching band (C
O hydrogen bonds29,30 together with a small shift to lower frequencies suggests the interaction of hard segments of the PB-UR-OH polymer with the ether linkage of the PEO groups at higher concentrations of PB-UR-OH (30%). Temperature increase leads to the disruption of the hydrogen bonds in the low and mid concentration regime (reappearance of the free NH signal at 3490 cm−1). The spectral region associated to the carbonyl stretching (amide I) reveals both free urethane and urea stretching band (C![[double bond, length as m-dash]](https://www.rsc.org/images/entities/char_e001.gif) O (urethane) free 1730–1740; C
O (urethane) free 1730–1740; C![[double bond, length as m-dash]](https://www.rsc.org/images/entities/char_e001.gif) O (urea) free 1690–1700) up to 30% of the PB-UR-OH whilst the disordered and ordered hydrogen bonded urea is the predominant absorption band at higher PB-UR-OH compositions (40 and 50%, respectively). With increasing temperature, the spectra show similar enhancements of both the free urethane and urea stretching bands. Importantly, the higher content of the free-hydrogen bonded carbonyl urea stretching band when compared to the free-hydrogen bonded N–H stretching band in PB-UR-OH supports our analysis regarding the competition between the interaction of the NH with the carbonyl and the ether oxygen of P123.29,30 Furthermore, the higher content of the disordered hydrogen bonded urea stretching band in the spectra of the P123–PB-UR-OH blends relative to the PB-UR-OH adsorption band confirms that the strong interaction of the oxygen ether serves to destabilize the urea packing.25,29,30
O (urea) free 1690–1700) up to 30% of the PB-UR-OH whilst the disordered and ordered hydrogen bonded urea is the predominant absorption band at higher PB-UR-OH compositions (40 and 50%, respectively). With increasing temperature, the spectra show similar enhancements of both the free urethane and urea stretching bands. Importantly, the higher content of the free-hydrogen bonded carbonyl urea stretching band when compared to the free-hydrogen bonded N–H stretching band in PB-UR-OH supports our analysis regarding the competition between the interaction of the NH with the carbonyl and the ether oxygen of P123.29,30 Furthermore, the higher content of the disordered hydrogen bonded urea stretching band in the spectra of the P123–PB-UR-OH blends relative to the PB-UR-OH adsorption band confirms that the strong interaction of the oxygen ether serves to destabilize the urea packing.25,29,30
Interestingly, the Amide II absorption band (N–H⋯C![[double bond, length as m-dash]](https://www.rsc.org/images/entities/char_e001.gif) O 1540–1560 cm−1) shows a clear shift from 1520 to 1540 cm−1 related to the reduction in hydrogen bonding as temperature is increased. Variations of the methyl umbrella deformation absorption band (1374 cm−1) are indicative of intermolecular interaction. The general sharpening of the absorption band suggest the inhibition of the rotational motion of the PO chains. In addition, the disappearance of the trans conformation of the out-of-phase bending vibration of methylene group at 1284 cm−1 upon PB-UR-OH addition as well as the coalescence with the absorbance band of the gauche conformation at 1300 cm−1, confirms the higher mobility of the PEO groups of the P123 interacting with the hard segment of the PB-UR-OH.26,27 However, the coexistence of absorption bands that correspond to different block interactions in the complex spectra of the polymer blends indicates that there is not strong phase separation between the phases and a diffuse interface between the obtained microphase separation exists.
O 1540–1560 cm−1) shows a clear shift from 1520 to 1540 cm−1 related to the reduction in hydrogen bonding as temperature is increased. Variations of the methyl umbrella deformation absorption band (1374 cm−1) are indicative of intermolecular interaction. The general sharpening of the absorption band suggest the inhibition of the rotational motion of the PO chains. In addition, the disappearance of the trans conformation of the out-of-phase bending vibration of methylene group at 1284 cm−1 upon PB-UR-OH addition as well as the coalescence with the absorbance band of the gauche conformation at 1300 cm−1, confirms the higher mobility of the PEO groups of the P123 interacting with the hard segment of the PB-UR-OH.26,27 However, the coexistence of absorption bands that correspond to different block interactions in the complex spectra of the polymer blends indicates that there is not strong phase separation between the phases and a diffuse interface between the obtained microphase separation exists.
Conclusions
In summary, we have shown that blending with a supramolecular polymer capable of hydrogen bonding interactions is a novel method to induce microphase separation in Pluronic-type polyether block copolymers. This also provides a simple means to tune the mechanical properties of the blends. The microphase separated structures are observed up to higher temperatures (50 °C). The resulting microphase separated structures have small domain spacings, around 8 nm, although no evidence for defined (e.g. lamellar or hexagonal cylindrical) ordering was noted. Microphase separated block copolymer structures with small domains spacings have recently attracted attention for thin film applications in electronics, specifically in the creation of block copolymer mask structures for high density lithographic patterning of semiconductors. Blending of inexpensive polymers such as Pluronics with supramolecular polymers to induce microphase separation is a valuable new addition to the range of methods to induce microphase separated structures with small domain spacings.31 FTIR spectroscopy provides a detailed molecular-level interpretation of the intermolecular interactions responsible for the ordering within the blends. In particular, the FTIR spectra show hydrogen bonding interactions between the EO groups of the P123 and the hard segment of the PB-UR-OH that decrease with temperature.Acknowledgements
The development of the supramolecular polymer at Reading was supported by Henkel UK, who sponsored the PhD studentship of DH-M. The PhD research of GEN was supported by the STFC Centre for Molecular Structure and Design. We are grateful to the EPSRC (UK) for Platform grant funding. IWH is the recipient of a Royal Society-Wolfson Research Merit Award.Notes and references
- I. W. Hamley, The Physics of Block Copolymers, Oxford University Press, Oxford, 1998 Search PubMed.
- I. W. Hamley and V. Castelletto, Prog. Polym. Sci., 2004, 29, 909–948 CAS.
- I. W. Hamley, Block Copolymers in Solution, Wiley, Chichester, 2005 Search PubMed.
- G. E. Newby, I. W. Hamley, S. M. King, C. M. Martin and N. J. Terrill, J. Colloid Interface Sci., 2009, 329(1), 54–61 CrossRef CAS PubMed.
- J. M. Dealy and R. G. Larson, Structure and Rheology of Molten Polymers: From Structure to Flow Behavior and Back Again, Hanser Gardner Publications, 2006 Search PubMed.
- I. W. Hamley, Nanotechnology, 2003, 14, R39–R54 CrossRef CAS.
- P. Alexandridis and T. Hatton, Colloids Surf., A, 1995, 96, 1–46 CrossRef CAS.
- W. K. Lee, S. H. Cha, K. H. Kim, B. W. Kim and J. C. Lee, J. Solid State Chem., 2009, 182, 3243–3248 CrossRef CAS PubMed.
- F. Artzner, S. Geiger, A. Olivier, C. Allais, S. Finet and F. Agnely, Langmuir, 2007, 23(9), 5085–5092 CrossRef CAS PubMed.
- R. K. Prud'homme, G. Wu and D. K. Schneider, Langmuir, 1996, 12(20), 4651–4659 CrossRef.
- K. Nakashima and P. Bahadur, Adv. Colloid Interface Sci., 2006, 123–126, 75–96 CrossRef CAS PubMed.
- V. R. Tirumala, A. Romang, S. Agarwal, E. K. Lin and J. J. Watkins, Adv. Mater., 2008, 20, 1603–1608 CrossRef CAS PubMed.
- A. Dehsorkhi, V. Castelletto, I. W. Hamley and P. J. F. Harris, Soft Matter, 2011, 7, 10116–10121 RSC.
- C. I. Huang, H. Y. Hsueh, Y. K. Lan and Y. C. Lin, Macromol. Theory Simul., 2007, 16, 77–85 CrossRef CAS PubMed.
- C. Chaibundit, N. M. P. S. Ricardo, F. M. L. L. Costa, S. G. Yeates and C. Booth, Langmuir, 2007, 23(18), 9229–9236 CrossRef CAS PubMed.
- D. Hermida Merino, A. T. Slark, H. M. Colquhoun, W. Hayes and I. W. Hamley, Polym. Chem., 2010, 1, 1263–1271 RSC.
- P. Woodward, A. Clarke, B. W. Greenland, D. H. Merino, L. Yates, A. T. Slark, J. F. Miravet and W. Hayes, Soft Matter, 2009, 5, 2000–2010 RSC.
- P. Woodward, D. H. Merino, I. W. Hamley, A. T. Slark and W. Hayes, Aust. J. Chem., 2009, 62, 790–793 CrossRef CAS.
- P. J. Woodward, D. H. Merino, B. W. Greenland, I. W. Hamley, Z. Light, A. T. Slark and W. Hayes, Macromolecules, 2010, 43, 2512–2517 CrossRef CAS.
- O. Colombani, C. Barioz, L. Bouteiller, C. Chanéac, L. Fompérie, F. Lortie and H. Montès, Macromolecules, 2005, 38, 1752–1759 CrossRef CAS.
- R. M. Versteegen, R. P. Sijbesma and E. W. Meijer, Macromolecules, 2005, 38, 3176–3184 CrossRef CAS.
- A. Gooch, A. M. McGhee, L. C. Renton, J. P. Plante, C. I. Lindsay and A. J. Wilson, Supramol. Chem., 2009, 21, 12–17 CrossRef CAS PubMed.
- A. Gooch, C. Nedolisa, K. A. Houton, C. I. Lindsay, A. Saiani and A. J. Wilson, Macromolecules, 2012, 45, 4723–4729 CrossRef CAS.
- Amphiphilic Block Copolymers, Self-Assembly and Applications, ed. P. Alexandridis and B. Lindman, Elsevier, Amsterdam, 2000 Search PubMed.
- E. Yilgör, E. Burgaz, E. Yurtsever and I. Yilgör, Polymer, 2000, 41, 849–857 CrossRef.
- Y. L. Su, J. Wang and H. Z. Liu, J. Phys. Chem. B, 2002, 106, 11823–11828 CrossRef CAS.
- C. Guo, H. Z. Liu and J. Y. Chen, Colloid Polym. Sci., 1999, 277, 376–381 CAS.
- M. C. Delpech and G. S. Miranda, Cent. Eur. J. Eng., 2012, 2, 231–238 CAS.
- M. M. Coleman, D. J. Skrovanek, J. Hu and P. C. Painter, Macromolecules, 1988, 21, 59–65 CrossRef CAS.
- A. Marcos-Fernandez, A. E. Lozano, L. Gonzalez and A. Rodriguez, Macromolecules, 1997, 30, 3584–3592 CrossRef CAS.
- I. W. Hamley, Prog. Polym. Sci., 2009, 34, 1161–1210 CrossRef CAS PubMed.
Footnote |
| † Electronic supplementary information (ESI) available: Experimental methods. Additional rheology and SAXS data. Details of SAXS fitting methods. Tables of data from analysis of rheology, SAXS and FTIR data. See DOI: 10.1039/c5sm01461a |
| This journal is © The Royal Society of Chemistry 2015 |


