 Open Access Article
Creative Commons Attribution 3.0 Unported Licence
Shear banding in entangled polymers in the micron scale gap: a confocal-rheoscopic study
Pouyan E.
Boukany
*a,
Shi-Qing
Wang
b,
Sham
Ravindranath
b and
L. James
Lee
c
aDepartment of Chemical Engineering, Delft University of Technology, Julianalaan 136, 2628 BL Delft, The Netherland. E-mail: P.E.Boukany@tudelft.nl; Tel: +31-(0)15-27 89981
bDepartment of Polymer Science and Maurice Morton, Institute of Polymer Science, University of Akron, Akron, Ohio 44325, USA
cDepartment of Chemical and Biomolecular Engineering, The Ohio State University, 174 West 18th Avenue, Columbus, Ohio 43210, USA
First published on 8th September 2015
Abstract
Recent shear experiments in well-entangled polymer solutions demonstrated that interfacial wall slip is the only source of shear rate loss and there is no evidence of shear banding in the micron scale gap. In this work, we experimentally elucidate how molecular parameters such as slip length, b, influence shear inhomogeneity of entangled polybutadiene (PBD) solutions during shear in a small gap H ∼ 50 μm. Simultaneous rheometric and velocimetric measurements are performed on two PBD solutions with the same level of entanglements (Z = 54) in two PBD solvents with molecular weights of 1.5 kg mol−1 and 10 kg mol−1 that possess different levels of shear inhomogeneity (2bmax/H = 17 and 240). For the PBD solution made with a low molecular weight PBD solvent of 1.5 kg mol−1, wall slip is the dominant response within the accessible range of the shear rate, i.e., up to the nominal Weissenberg number (Wi) as high as 290. On the other hand, wall slip is minimized using a high molecular-weight PBD solvent of 10 kg mol−1 so that bulk shear banding is observed to take place in the steady state for Wi > 100. Finally, these findings and previous results are in good agreement with our recently proposed phase diagram in the parameter space of apparent Wi versus 2bmax/H suggesting that shear banding develops across the micron scale gap when the imposed Wi exceeds 2bmax/H [Wang et al., Macromolecules, 2011, 44, 183].
1 Introduction
Polymeric materials including DNA, actin filaments, plastics, textiles, rubbers and elastomers have emerged as a prominent class of soft matter, which can be found everywhere in nature and industry.1 Long macromolecules can be entangled in their disordered liquid state and display remarkable viscoelastic properties.2,3 Their sluggish macroscopic relaxation arises from chain uncrossability that constrains chains to perform “reptation”4 in the curvilinear one directional tube in quiescence.5,6 Under large fast deformation (when the deformation rate exceeds the reciprocal of the reptation time), the intertwining chains pull on each other, resulting in molecular deformation, until the point of force imbalance, leading to chain disentanglement and yielding of the entanglement network.7 Whether chain disentanglement during large deformation produces a uniform shear field or not is a key issue in the nonlinear rheology of polymers.Experimental knowledge about nonlinear rheological behavior of entangled polymers typically derives from a rotational shear rheometer where the sample thickness, H, is in the range of 1 mm. Recent experiments combined traditional rheometric measurements with particle-tracking velocimetric (PTV) characterization to obtain more insightful information about how chain entanglement responds to startup shear. At a high Weissenberg number Wi = ![[small gamma, Greek, dot above]](https://www.rsc.org/images/entities/i_char_e0a2.gif) τ > 1, defined as the product of the bulk shear rate
τ > 1, defined as the product of the bulk shear rate ![[small gamma, Greek, dot above]](https://www.rsc.org/images/entities/i_char_e0a2.gif) and the longest relaxation (or reptation) time τ, many entangled fluids exhibit wall slip and shear banding, including wormlike micelles,8–12 polybutadiene (PBD),13–15 polyacrylamide,16,17 DNA,18–20 and F-actin solutions,21 as well as polymer melts such as styrene-butadiene22 and polyethylene-oxide.23 On the other hand, such shear banding can be avoided by replacing the sudden startup with gradual ramping up of the applied shear rate.24,25 Moreover, shear banding and wall slip need not occur when the system is insufficiently entangled (the level of entanglements per chain Z < 40)14,26,27 or has a negligibly small extrapolation length b relative to the sample thickness H, i.e., when b/H ≪ 1.14,28,29
and the longest relaxation (or reptation) time τ, many entangled fluids exhibit wall slip and shear banding, including wormlike micelles,8–12 polybutadiene (PBD),13–15 polyacrylamide,16,17 DNA,18–20 and F-actin solutions,21 as well as polymer melts such as styrene-butadiene22 and polyethylene-oxide.23 On the other hand, such shear banding can be avoided by replacing the sudden startup with gradual ramping up of the applied shear rate.24,25 Moreover, shear banding and wall slip need not occur when the system is insufficiently entangled (the level of entanglements per chain Z < 40)14,26,27 or has a negligibly small extrapolation length b relative to the sample thickness H, i.e., when b/H ≪ 1.14,28,29
Recent velocimetric measurements based on the confocal microscopy asserted that there was no bulk shear banding in entangled PBD solutions when the gap of the shear cell is reduced to tens of microns:30,31 Wall slip was the only discernible form of shear inhomogeneity, with linear velocity profiles across the gap for a high level of entanglement, i.e., Z = 56 entanglements per chain. Such results were used to suggest that the previously observed shear banding13,14 involving a conventional cone-plate or a parallel-disk device was due to the edge fracture: the absence of shear banding in a shear cell with a gap distance much lower than the conventional gap (e.g., by a factor of 20) was assumed to be due to the fact that there is a negligible effect of edge fracture in the shear cell with a 50 μm gap.
Wall slip is a well-established phenomenon in both polymer melts and solutions.32 During startup shear with Wi > 1, entangled polymers show the first sign of shear inhomogeneity in the form of wall slip by interfacial disentanglement, because the polymer/wall interface is weaker than the cohesion of entangled networks.33 The intrinsic ability of the entangled solution to undergo slip can be estimated in terms of the slip length b. The magnitude of b ∼ (η/ηi)a relative to the sample thickness H determines how much the actual bulk shear rate ![[small gamma, Greek, dot above]](https://www.rsc.org/images/entities/i_char_e0a2.gif) b is reduced from the nominal rate
b is reduced from the nominal rate ![[small gamma, Greek, dot above]](https://www.rsc.org/images/entities/i_char_e0a2.gif) ,19,29 where a is the interfacial layer thickness, η and ηi are the bulk and interfacial viscosities respectively. The maximum value of b, denoted as bmax, corresponds to the full interfacial disentanglement when ηi reduces to the solvent viscosity ηs, i.e., bmax = (η/ηs)a(ϕ). For polymer solutions, a would grow from its value in the melt lent upon dilution as: a(ϕ) = lentϕ−0.66, where ϕ is the polymer volume fraction.
,19,29 where a is the interfacial layer thickness, η and ηi are the bulk and interfacial viscosities respectively. The maximum value of b, denoted as bmax, corresponds to the full interfacial disentanglement when ηi reduces to the solvent viscosity ηs, i.e., bmax = (η/ηs)a(ϕ). For polymer solutions, a would grow from its value in the melt lent upon dilution as: a(ϕ) = lentϕ−0.66, where ϕ is the polymer volume fraction.
Upon startup shear with Wi > 1, wall slip will emerge as a consequence of interfacial yielding.29,33 Denoting the effective shear rate in the bulk as ![[small gamma, Greek, dot above]](https://www.rsc.org/images/entities/i_char_e0a2.gif) b, then the speed of the shearing wall is given in terms of the slip velocity Vs as
b, then the speed of the shearing wall is given in terms of the slip velocity Vs as
V = ![[small gamma, Greek, dot above]](https://www.rsc.org/images/entities/i_char_e0a2.gif) bH + 2Vs, bH + 2Vs, | (1a) |
![[small gamma, Greek, dot above]](https://www.rsc.org/images/entities/i_char_e0a2.gif) = (1 + 2b/H) = (1 + 2b/H)![[small gamma, Greek, dot above]](https://www.rsc.org/images/entities/i_char_e0a2.gif) b, b, | (1b) |
![[small gamma, Greek, dot above]](https://www.rsc.org/images/entities/i_char_e0a2.gif) = V/H and the slip length b has its kinematic meaning according to b = Vs/
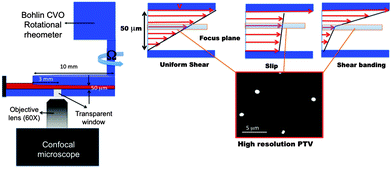
= V/H and the slip length b has its kinematic meaning according to b = Vs/![[small gamma, Greek, dot above]](https://www.rsc.org/images/entities/i_char_e0a2.gif) b, which is illustrated in Fig. 1. With increasing V or
b, which is illustrated in Fig. 1. With increasing V or ![[small gamma, Greek, dot above]](https://www.rsc.org/images/entities/i_char_e0a2.gif) , Vs and b grow towards their maximum values. Before the maximum slip velocity is reached, the bulk shear rate
, Vs and b grow towards their maximum values. Before the maximum slip velocity is reached, the bulk shear rate ![[small gamma, Greek, dot above]](https://www.rsc.org/images/entities/i_char_e0a2.gif) b can be expected to remain at a critically low value around 1/τ. Correspondingly, the steady-shear stress does not appreciably increase with
b can be expected to remain at a critically low value around 1/τ. Correspondingly, the steady-shear stress does not appreciably increase with ![[small gamma, Greek, dot above]](https://www.rsc.org/images/entities/i_char_e0a2.gif) . In other words, the value of
. In other words, the value of ![[small gamma, Greek, dot above]](https://www.rsc.org/images/entities/i_char_e0a2.gif) can increase up to
can increase up to ![[small gamma, Greek, dot above]](https://www.rsc.org/images/entities/i_char_e0a2.gif) wb-bnl = (1 + 2bmax/H)/τ without forcing the bulk to leave the Newtonian regime whose upper-bound is given as 1/τ.
wb-bnl = (1 + 2bmax/H)/τ without forcing the bulk to leave the Newtonian regime whose upper-bound is given as 1/τ.
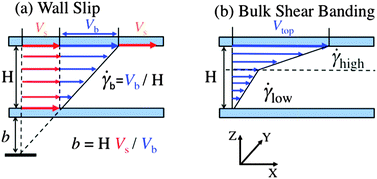 | ||
Fig. 1 Schematic diagram of the velocity profile within the gap of the shear geometry in the presence of (left) wall slip, where b = Vs/![[small gamma, Greek, dot above]](https://www.rsc.org/images/entities/i_char_e0a2.gif) b, and (right) bulk shear banding at the apparent shear rate. b, and (right) bulk shear banding at the apparent shear rate. | ||
In other words, there is a critical Weissenberg number Wiws-bnl, beyond which the bulk starts to enter the nonlinear response regime, given by
| Wiws-bnl = (1 + 2bmax/H) | (2) |
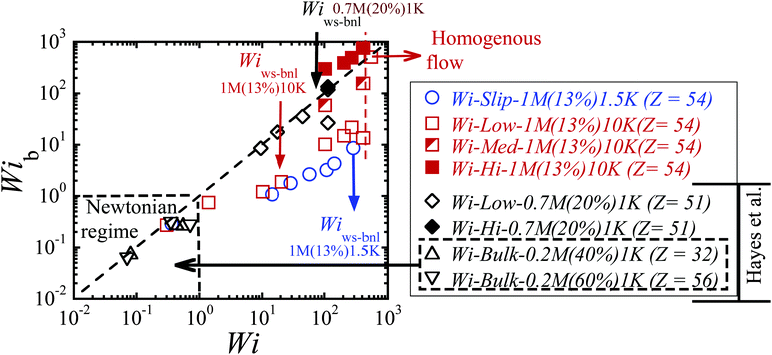
When Wi > Wiws-bnl, even maximum wall slip cannot save the bulk from having Wib = ![[small gamma, Greek, dot above]](https://www.rsc.org/images/entities/i_char_e0a2.gif) bτ > 1. Here the subscript “ws-bnl” stands for a transition from wall slip (ws) to bulk nonlinear response (bnl). For well-entangled polymer solutions, Wiws-bnl can be very large when H is reduced from a conventional gap distance of 1 mm to 50 μm. This is a reason why Hayes et al. only reported wall slip as the source of shear rate loss for entangled PBD solutions.30
bτ > 1. Here the subscript “ws-bnl” stands for a transition from wall slip (ws) to bulk nonlinear response (bnl). For well-entangled polymer solutions, Wiws-bnl can be very large when H is reduced from a conventional gap distance of 1 mm to 50 μm. This is a reason why Hayes et al. only reported wall slip as the source of shear rate loss for entangled PBD solutions.30
In passing, we also note that the maximum value of bmax corresponds to the slip velocity Vs attaining its maximum at Wiws-bnl where the bulk shear rate ![[small gamma, Greek, dot above]](https://www.rsc.org/images/entities/i_char_e0a2.gif) b ∼ τ−1. Thus, we have
b ∼ τ−1. Thus, we have
Vs(max) = bmax/![[small gamma, Greek, dot above]](https://www.rsc.org/images/entities/i_char_e0a2.gif) b ∼ bmax/τ b ∼ bmax/τ | (3) |
In the current study, we show that the dominant wall slip characteristic of the previous reports30,31 is replaced by bulk shear banding when the extrapolation length b is reduced using a polymeric solvent of sufficient high molecular weight. Specifically, one of our two 13 wt% PBD solutions shows only wall slip, similar to one solution reported previously,30,31 because of its high value for bmax, whereas the second solution displays bulk shear banding because of its lower value for bmax. Because the point of velocimetric observation in our setup is at least 3 mm away from the meniscus in a parallel-disk shear cell with H ∼ 50 μm, the aspect ratio is 60, no edge fracture and sample loss took place during shear. Finally, our findings in the micron scale gap are presented in terms of a phase diagram in the parameter space of apparent Wi versus 2bmax/H. We demonstrate that bmax is a key parameter for a fixed gap to control what type of velocity profile may occur for a given Wi and bulk shear banding can develop when the applied Wi exceeds 2bmax/H. At sufficiently high Wi, the linear velocity profile is recovered across the gap.
2 Experimental
2.1. Materials and sample preparation
Our experiments are based on two well-entangled 1,4-polybutadiene (PBD) solutions made with the same parent high molecular weight PBD (Mw ∼ 106 g mol−1) at the same 13 wt% concentration in polymeric butadiene (PBD) “solvents” (with molecular weights of 1.5 kg mol−1 and 10 kg mol−1). In this work, these two solutions are labelled as 1M(13%)1.5K and 1M(13%)10K. The molecular characteristics of parent polymers and solvents are listed in Table 1. The parent PBD was first dissolved in excess of toluene to which the PBD solvent was added and intimately mixed. For the particle tracking velocimetric (PTV) observations, fluorescein isothiocyanate (FITC) labelled fluorescent melamine micro-beads with a particle size of 1 μm (Sigma Aldrich, CAT no 90305) were dispersed in toluene and then added to the solution with the final loading of the particles around 600–800 ppm. Most of the toluene was evaporated at room temperature under a hood for days, and the remaining was removed by applying vacuum until the residual toluene is less than 0.5%.| Sample | M n (g mol−1) | M w (g mol−1) | M w/Mn | η s (Pa s) | Source |
|---|---|---|---|---|---|
| 1MPBD | 1.01 × 10⁶ | 1.05 × 10⁶ | 1.03 | n/a | Akron |
| 1.5KPBD | 1500 | Not provided | Not provided | 0.7 | Sigma-Aldrich Cat No. 200484 |
| 10KPBD | 8900 | 10![[thin space (1/6-em)]](https://www.rsc.org/images/entities/char_2009.gif) 500 500 |
1.02 | 14 | Bridgestone |
2.2. Rheometric and velocimetric measurements
In this work, we integrated a Bohlin-CVOR rheometer with a spin-disk confocal microscope to make the particle-tracking velocimetric (PVT) measurements at an unconventionally low gap distance of H = ca. 50 μm. The schematic representation of our confocal rheoscope is shown in Fig. 2 that involves an Olympus IX-81 inverted microscope. An EM-CCD camera (Hammamutsa) connected to the CFM was used to take two-dimensional (2D) movies in the XY plane through a piezo-mounted objective lens (60×, 1.4 NA). The field of view in our measurements is about 100 μm × 100 μm where the PTV observations are performed at a distance of 3 mm from the meniscus so that the aspect ratio of the distance from the edge to the gap distance is ca. 60 (for H = 50 μm). The lateral resolution, axial resolution, and optical slice thickness are 0.2, 0.5, and 1.34 μm, respectively. The camera and spinning disk were synchronized, and the entire system was controlled using VoxCell software from Visitech International.A custom-made microscope stage was designed so that our rheometer (Bohlin CVOR) could integrate with the stage mounted onto a confocal fluorescence microscope (CFM) with three adjustable screws to ensure alignment. Initially, the adjustable platform allowed us to pre-align the rheometer on an optical table, on which the CFM was placed. The rotating shaft has a short length of 2 cm to ensure good parallelism of the rotating disc to the bottom plate. To verify the alignment, the upper disc was first raised 5 μm above the stationary bottom plate and then spun to detect any misalignment. This setup has been previously employed to accurately conduct molecular imaging of entangled DNA solutions on the micron scale,34 correlating interfacial slip with conformations of DNA adsorbed at wall.
All startup shear measurements were performed at room temperature around 25 °C, based on parallel-disk geometry with a radius R = 10 mm and H = ca. 50 μm. Here all apparent shear rate values in the fluid sample are estimated as ![[small gamma, Greek, dot above]](https://www.rsc.org/images/entities/i_char_e0a2.gif) = ΩR/H, where Ω is the imposed angular velocity at R = 7 mm (at a radial distance of 3 mm from the edge). To determine the linear viscoelastic properties of these two entangled PBD solutions, small amplitude oscillatory shear (SAOS, strain amplitude
= ΩR/H, where Ω is the imposed angular velocity at R = 7 mm (at a radial distance of 3 mm from the edge). To determine the linear viscoelastic properties of these two entangled PBD solutions, small amplitude oscillatory shear (SAOS, strain amplitude ![[small gamma, Greek, dot above]](https://www.rsc.org/images/entities/i_char_e0a2.gif) = 5%) frequency sweep tests were conducted in a conventional parallel-plate shear cell with H = 1 mm. All startup shear tests were performed in the controlled rate mode at a narrow gap (H = ca. 50 μm) under the confocal microscope to capture the velocity profiles across the gap. The top and bottom plates were a glass slide (thickness 0.15–0.17 mm). The bottom plate was placed on the microscope stage, along with a circular plastic O-ring (inner radius 14 mm) to minimize meniscus instability and sample loss during high shear. The top moving and bottom stationary transparent plates were identified by scanning along the sample thickness direction to confirm that the nominal gap is consistent with the true gap. In all startup shear experiments, 2D images were captured every 2 to 4 microns across the sample thickness (with a rate of 35 to 45 fps) to measure both the transient and steady velocity profile across the gap. Typical error bars in the measured velocity are about 5%, which was achieved by keeping track of sufficiently large displacements of the fluorescent particles.
= 5%) frequency sweep tests were conducted in a conventional parallel-plate shear cell with H = 1 mm. All startup shear tests were performed in the controlled rate mode at a narrow gap (H = ca. 50 μm) under the confocal microscope to capture the velocity profiles across the gap. The top and bottom plates were a glass slide (thickness 0.15–0.17 mm). The bottom plate was placed on the microscope stage, along with a circular plastic O-ring (inner radius 14 mm) to minimize meniscus instability and sample loss during high shear. The top moving and bottom stationary transparent plates were identified by scanning along the sample thickness direction to confirm that the nominal gap is consistent with the true gap. In all startup shear experiments, 2D images were captured every 2 to 4 microns across the sample thickness (with a rate of 35 to 45 fps) to measure both the transient and steady velocity profile across the gap. Typical error bars in the measured velocity are about 5%, which was achieved by keeping track of sufficiently large displacements of the fluorescent particles.
2.3. Extraction of slip velocity, slip length and local shear rates during shear
The experimental understanding of polymer rheology depends on simple shear rheometric measurements. Usually, rheological properties of polymeric fluids are obtained based on the assumption that a uniform shear field with a constant shear rate (![[small gamma, Greek, dot above]](https://www.rsc.org/images/entities/i_char_e0a2.gif) = V/H) should prevail across the gap with no slip boundary condition, where V is an imposed (apparent) velocity and H is a sample thickness sandwiched between two parallel plates.
= V/H) should prevail across the gap with no slip boundary condition, where V is an imposed (apparent) velocity and H is a sample thickness sandwiched between two parallel plates.
At high shear rates, entangled fluids violate no-slip boundary condition and show strong wall slip during shear. The most effective way to quantify the slip is to introduce the slip length b = Vs/![[small gamma, Greek, dot above]](https://www.rsc.org/images/entities/i_char_e0a2.gif) b. The magnitude of b relative to the sample thickness H determines how much the actual bulk shear rate
b. The magnitude of b relative to the sample thickness H determines how much the actual bulk shear rate ![[small gamma, Greek, dot above]](https://www.rsc.org/images/entities/i_char_e0a2.gif) b is reduced from the apparent rate
b is reduced from the apparent rate ![[small gamma, Greek, dot above]](https://www.rsc.org/images/entities/i_char_e0a2.gif) . In this work, the slip velocity Vs and bulk rate
. In this work, the slip velocity Vs and bulk rate ![[small gamma, Greek, dot above]](https://www.rsc.org/images/entities/i_char_e0a2.gif) b are directly measured by confocal imaging to estimate the slip length, b, for both solutions. Specifically, to obtain accurate local shear rates, the velocity profiles with high spatial resolutions were constructed across the gap from PTV. Then,
b are directly measured by confocal imaging to estimate the slip length, b, for both solutions. Specifically, to obtain accurate local shear rates, the velocity profiles with high spatial resolutions were constructed across the gap from PTV. Then, ![[small gamma, Greek, dot above]](https://www.rsc.org/images/entities/i_char_e0a2.gif) b was evaluated from the velocity profile using ordinary least squares regression. The formation of two or more flow regimes with different local shear rates under the same imposed rate was defined from the best fits.
b was evaluated from the velocity profile using ordinary least squares regression. The formation of two or more flow regimes with different local shear rates under the same imposed rate was defined from the best fits.
3 Results and discussion
3.1. Conventional rheometric measurements
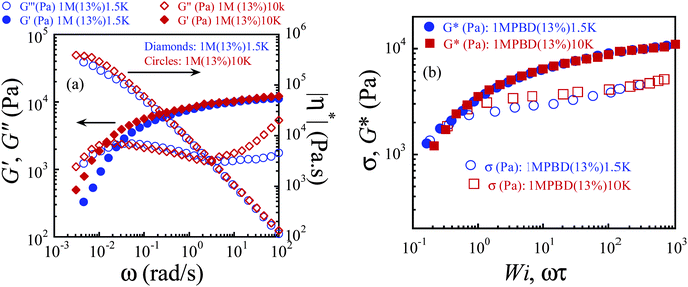
Fig. 3a shows dynamic storage and loss moduli G′ and G′′ of the two 13 wt% PBD solutions made with 1.5KPBD and 10KPBD respectively. The linear viscoelastic characteristics of these two samples are listed in Table 2, where the plateau modulus Gpl was determined from the value of G′ at a frequency where G′′ shows a minimum, and the longest relaxation time τ is estimated from the inverse of the crossover frequency ωc where G′ = G′′. The similar value of Gpl confirms that the level of chain entanglement is the same in these two PBD solutions. The number of entanglements per chain can be estimated to be around 54 according to Z = (Mw/Me)ϕ1.2, where Mw is the molecular weight of the parent PBD, Me the entanglement molecular weight for PBD melts, taken to be 1600 g mol−1. The Rouse relaxation time of two solutions is determined to be τR = τ/3Z. Given lent = 3.8 nm,35 we find a to be ca. 15 nm at 13 wt% of 1MPBD.| Sample | G pl (kPa) | τ (s) | Z(ϕ)b | τ R (s) | η (kPa s) | a(ϕ)e (nm) | b max (mm) | Wiws-bnlg |
|---|---|---|---|---|---|---|---|---|
| a Terminal relaxation times are estimated as τ = ωc−1, where ωc (in rad s−1) is the crossover frequency in a frequency sweep test. b Entanglement density, Z(ϕ), is calculated by (Mw/Me)ϕ1.2, where Me = 1600 g mol−1 for 1,4 PBD melts. c Rouse times of two solutions are determined as τR = τ/3Z. d The zero shear viscosity of the polymer solutions is estimated from Fig. 3. e Interfacial layer thickness of polymer solutions is estimated to be a(ϕ) = lentϕ−0.66, where lent = 3.8 nm for pure PBD melts and ϕ is the polymer volume fraction. f The theoretical maximum extrapolation length is estimated to be bmax = (η/ηs)a(ϕ), where ηs for 1.5KPBD and 10KPBD is 0.7 and 14 Pa s respectively. g The critical Weissenberg number is estimated to be Wiws-bnl = 2bmax/H, where H = 50 μm. | ||||||||
| 1M(13%)1.5K | 9.7 | 36 | 54 | 0.22 | 288 | 15 | 6.0 | 240 |
| 1M(13%)10K | 9.4 | 68 | 54 | 0.42 | 395 | 15 | 0.4 | 17 |
Table 2 lists Wiws-bnl for the two polymer solutions by taking H = 50 μm. According to eqn (2), to observe shear banding in the bulk, we need to apply Wi in excess of either 17 or 240 respectively for the two solutions. By choosing two different solvents, we have estimated bmax to differ by a factor of ten as listed in Table 2. Here bmax is calculated based on the estimated values of η from Fig. 3.
Next, we performed startup shear experiments to investigate the rheological responses at a narrow gap of H = ca. 50 μm in the steady state. Fig. 3b displays the flow curves, showing steady shear stress against the nominal Wi, where the shear rate is given by ΩR/H, with Ω the angular velocity, R the disk radius. The two flow curves are very similar, showing the characteristic of stress plateau, both considerably below the curves of |G*| vs. ωτ. Because the parallel-disc setup was used to make these measurements, Fig. 3b only reflects an approximate shear stress vs. rate relationship.
3.2. Homogenous shear in the Newtonian regime (Wi < 1.0)
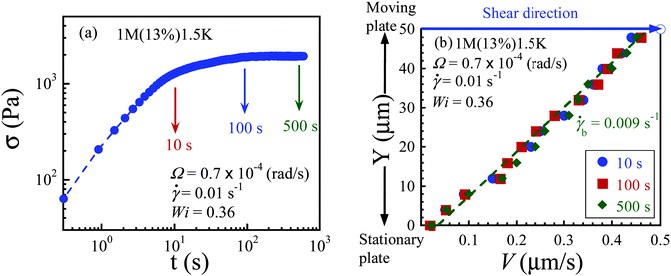
To check the reliability and performance of our confocal rheoscope, we sheared 1M(13%)1.5K in the terminal regime (Wi < 1.0) where it behaves like a Newtonian liquid. Fig. 4a shows that there is no stress overshoot at a low shear rate![[small gamma, Greek, dot above]](https://www.rsc.org/images/entities/i_char_e0a2.gif) = 0.01 s−1 (Wi = 0.36). Under this condition, the velocity profile is uniform across the sample thickness at all times, where the bulk shear rate (
= 0.01 s−1 (Wi = 0.36). Under this condition, the velocity profile is uniform across the sample thickness at all times, where the bulk shear rate (![[small gamma, Greek, dot above]](https://www.rsc.org/images/entities/i_char_e0a2.gif) b ∼ 0.009 s−1) is close to the imposed shear rate as shown in Fig. 4b. Small deviation from the imposed shear rate indicates weak wall slip near both top and bottom plates occurs (Vs ∼ 0.03 μm s−1). These results are consistent with previous reports18,30 of homogenous shear in entangled polymers when Wi < 1.0.
b ∼ 0.009 s−1) is close to the imposed shear rate as shown in Fig. 4b. Small deviation from the imposed shear rate indicates weak wall slip near both top and bottom plates occurs (Vs ∼ 0.03 μm s−1). These results are consistent with previous reports18,30 of homogenous shear in entangled polymers when Wi < 1.0.
3.3. Strong slip in 1M(13%)1.5K solution (1.0 < Wi ≤ 288)
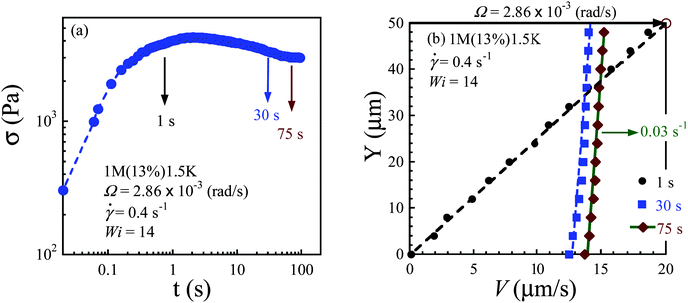
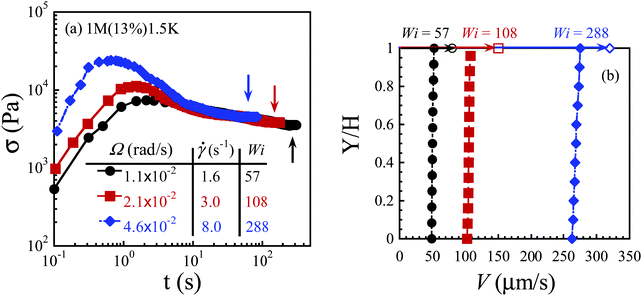
At a shear rate of 0.4 s−1 (Wi ∼ 14), the shear stress overshoot occurred during startup shear as shown in Fig. 5a, and the velocity profile is linear around t = 1 s before stress overshoot and displays strong slip after the stress maximum as shown in Fig. 5b. The velocimetric measurement reveals that the bulk of the sample experiences a mere shear rate of 0.03 s−1, which is comparable to the reciprocal of the terminal relaxation time (τ = 36 s). At higher shear rates of 1.6, 3.0 and 8.0 s−1 (Wi = 57–288), apparent wall slip appears to be the only form of shear inhomogeneity near the steady state as shown in Fig. 6a and b. Accessing higher deformation rates (Wi > 296) to observe bulk shear banding across the gap is infeasible for PBD1M(13%)1.5K because our PTV technique is limited to shear rates up to 10 s−1.3.4. Shear banding in 1M(13%)10K (100 ≤ Wi ≤ 408)
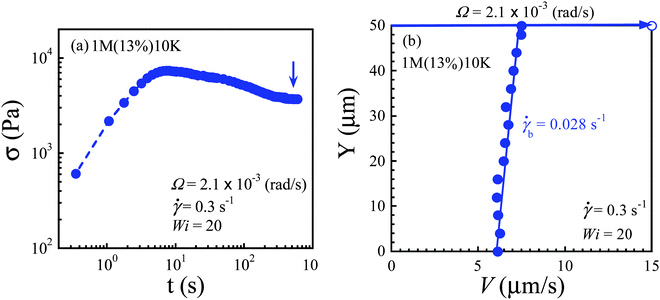
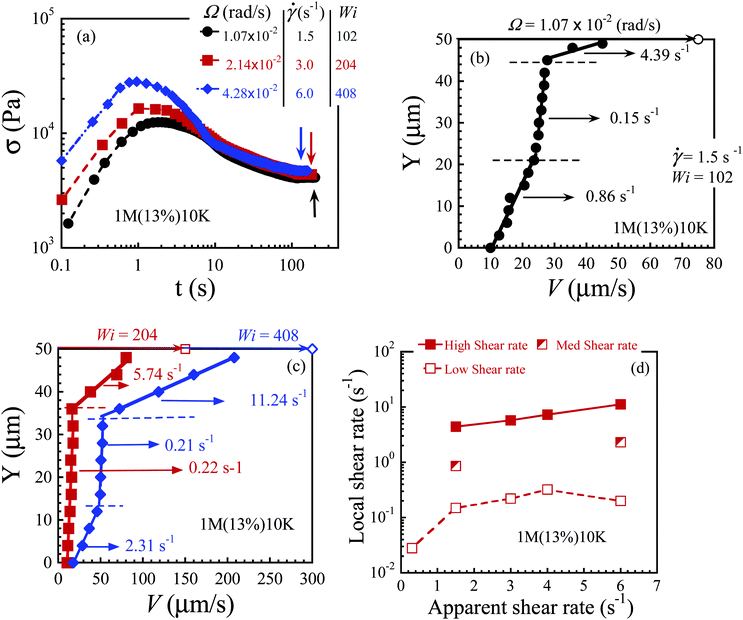
The intrinsic ability to undergo wall slip can be considerably reduced by using a polymeric solvent with a sufficiently high molecular weight to increase the upper bound for the interfacial viscosity ηi.29 In this section, we only focus on steady-state velocity profiles at different shear rates in the stress plateau region. At a low shear rate![[small gamma, Greek, dot above]](https://www.rsc.org/images/entities/i_char_e0a2.gif) = 0.3 s−1 (Wi ∼ 20), this solution also violates the no-slip boundary condition at the top and bottom plates after stress maximum is reached, and strong slip prevails across the gap as shown in Fig. 7a and b. On the other hand, when Wi > 100, shear banding emerges across the small gap. The growth of shear stress for shear rates of 1.5, 3.0 and 6.0 s−1 during startup shear is plotted in Fig. 8a. Fig. 8b shows that the velocity profile becomes nonlinear, characteristic of shear banding (with three different local shear rates of 0.15, 0.86 and 4.39 s−1) in the steady state for a nominal shear rate of 1.5 s−1. Previous velocimetric measurements on polymer solutions14 have also reported the existence of multiple shear banding across the gap. For shear rates of 3.0 and 6.0 s−1, permanent shear banding persists across the gap even after hundreds of strain units, as shown in Fig. 8c. Accompanying the high shear band is also significant wall slip. For apparent shear rates of 1.5, 3.0 and 6.0 s−1, the local rate in the high shear band is 4.39, 5.67 and 14.48 s−1 respectively. As a function of the apparent shear rate, the local shear rate varies in each of the low, medium or high band, as shown in Fig. 8d. The local shear rate in the high band seems to increase exponentially with an apparent shear rate.
= 0.3 s−1 (Wi ∼ 20), this solution also violates the no-slip boundary condition at the top and bottom plates after stress maximum is reached, and strong slip prevails across the gap as shown in Fig. 7a and b. On the other hand, when Wi > 100, shear banding emerges across the small gap. The growth of shear stress for shear rates of 1.5, 3.0 and 6.0 s−1 during startup shear is plotted in Fig. 8a. Fig. 8b shows that the velocity profile becomes nonlinear, characteristic of shear banding (with three different local shear rates of 0.15, 0.86 and 4.39 s−1) in the steady state for a nominal shear rate of 1.5 s−1. Previous velocimetric measurements on polymer solutions14 have also reported the existence of multiple shear banding across the gap. For shear rates of 3.0 and 6.0 s−1, permanent shear banding persists across the gap even after hundreds of strain units, as shown in Fig. 8c. Accompanying the high shear band is also significant wall slip. For apparent shear rates of 1.5, 3.0 and 6.0 s−1, the local rate in the high shear band is 4.39, 5.67 and 14.48 s−1 respectively. As a function of the apparent shear rate, the local shear rate varies in each of the low, medium or high band, as shown in Fig. 8d. The local shear rate in the high band seems to increase exponentially with an apparent shear rate.
3.5. Normalized steady state velocity profiles: slip vs. shear banding
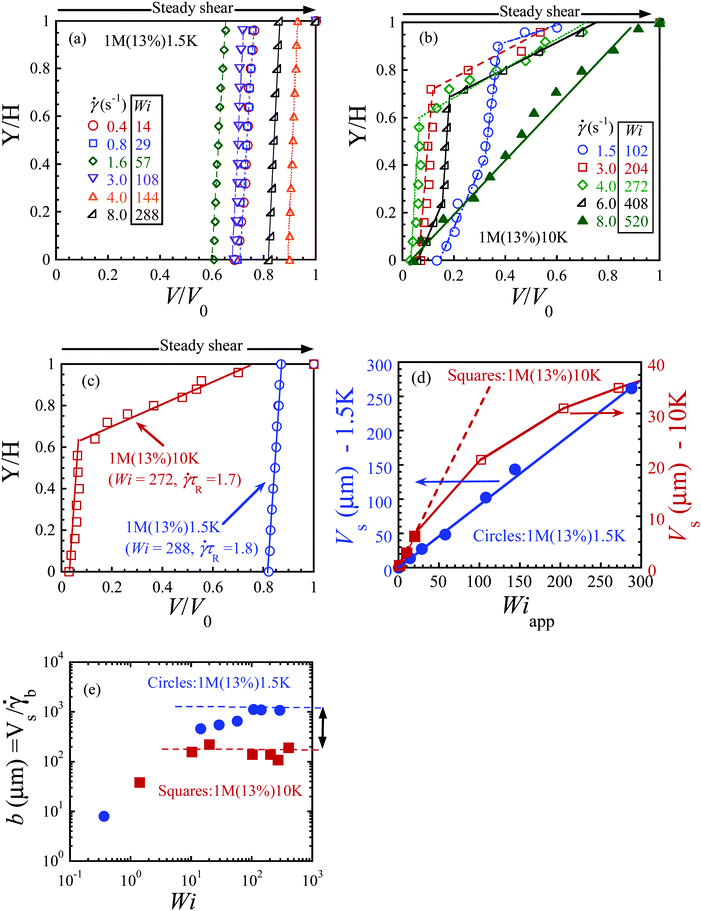
Fig. 9a and b respectively present the normalized steady-state velocity profiles for the two solutions at different Wi. In Fig. 9a, the 1M(13%)1.5K solution shows nothing else but massive slip in the range of Wi from 14 to 288. In contrast, Fig. 9b shows that bulk shear banding develops across the gap in the range of Wi from 102 to 408 for 1M(13%)10K. Fig. 9c displays the steady state velocity profiles at comparable Wi = 288 and 272;![[small gamma, Greek, dot above]](https://www.rsc.org/images/entities/i_char_e0a2.gif) τR = 1.8 and 1.7, showing slip and bulk shear banding respectively of the two solutions.
τR = 1.8 and 1.7, showing slip and bulk shear banding respectively of the two solutions.
Our PTV measurements allow us to examine how the wall slip grows in magnitude, i.e., how the slip velocity Vs increases with the applied rate ![[small gamma, Greek, dot above]](https://www.rsc.org/images/entities/i_char_e0a2.gif) toward its maximum. According to V = 2Vs +
toward its maximum. According to V = 2Vs + ![[small gamma, Greek, dot above]](https://www.rsc.org/images/entities/i_char_e0a2.gif) bH, Vs would change linearly with Wi as
bH, Vs would change linearly with Wi as
Wi = (V/H)τ = 2Vs/(H/τ) + τ![[small gamma, Greek, dot above]](https://www.rsc.org/images/entities/i_char_e0a2.gif) b b |
![[small gamma, Greek, dot above]](https://www.rsc.org/images/entities/i_char_e0a2.gif) b were to remain little changed with Wi. Fig. 9d plots Vs against Wi for both PBD solutions. With increasing Wi, the value of Vs grows linearly for 1M(13%)1.5K. Similar behavior is also observed for 1M(13%)10K up to 1.0 < Wi < 20. The slip velocity Vs starts to deviate from the linearity for Wi > 20, confirming that the shear rate
b were to remain little changed with Wi. Fig. 9d plots Vs against Wi for both PBD solutions. With increasing Wi, the value of Vs grows linearly for 1M(13%)1.5K. Similar behavior is also observed for 1M(13%)10K up to 1.0 < Wi < 20. The slip velocity Vs starts to deviate from the linearity for Wi > 20, confirming that the shear rate ![[small gamma, Greek, dot above]](https://www.rsc.org/images/entities/i_char_e0a2.gif) b remained unchanged up to Wi = 20. The value Vs of 1M(13%)10K stays well below that of 1M(13%)1.5K for all values of Wi – noting the different scales used for the double-Y axes. When the increase of Vs starts to deviate downward from linear growth with Wi, it has already reached its maximum at 6 μm s−1, which coincides with the theoretical estimate of eqn (3): Vs(max) ∼ bmax/τ = 420/68 = 6.2 μm s−1. Because of the poor spatial resolution, the higher value of Vs observed at high Wi indicates apparent wall slip that involves a slip layer increasingly thicker than one monolayer. Fig. 9e shows the changes in the slip length b = Vs/
b remained unchanged up to Wi = 20. The value Vs of 1M(13%)10K stays well below that of 1M(13%)1.5K for all values of Wi – noting the different scales used for the double-Y axes. When the increase of Vs starts to deviate downward from linear growth with Wi, it has already reached its maximum at 6 μm s−1, which coincides with the theoretical estimate of eqn (3): Vs(max) ∼ bmax/τ = 420/68 = 6.2 μm s−1. Because of the poor spatial resolution, the higher value of Vs observed at high Wi indicates apparent wall slip that involves a slip layer increasingly thicker than one monolayer. Fig. 9e shows the changes in the slip length b = Vs/![[small gamma, Greek, dot above]](https://www.rsc.org/images/entities/i_char_e0a2.gif) b as a function of Wi for the two solutions. The slip length b ranges from 10 to ∼1100 μm for 1M(13%)1.5K, which is one order of magnitude higher than slip length of 1M(13%)10K (maximum b ∼ 190 μm). This can be estimated from the information in Table 1 showing that ηs of PBD10K is 20 times as high as that of 1.5KPBD.
b as a function of Wi for the two solutions. The slip length b ranges from 10 to ∼1100 μm for 1M(13%)1.5K, which is one order of magnitude higher than slip length of 1M(13%)10K (maximum b ∼ 190 μm). This can be estimated from the information in Table 1 showing that ηs of PBD10K is 20 times as high as that of 1.5KPBD.
3.6. Relationship between local and apparent Wi and comparison with previous work
Upon extracting the local, i.e., bulk, Weissenberg numbers from our velocimetric measurements, we show the relationship between the bulk Weissenberg number Wib and nominal Wi in Fig. 10. Here we compare our findings with the previous work obtained in a narrow-gap to address and discuss why only either linear velocity profile or wall slip was observed in the previous report. Hayes and coworkers30 studied five different entangled solutions with different volume fractions ϕ based on two high molar mass PBD (Mw = 0.7 × 10⁶ g mol−1, Mw/Mn = 1.1) and PBD (Mw = 0.2 × 10⁶ g mol−1, Mw/Mn = 1.05) in an un-entangled PBD1K solvent (Mw = 1 × 10³ g mol−1). These PBD solutions with a wide range of level of entanglements (8 ≤ Z ≤ 56) were reported to show a linear velocity profile with some wall slip. We estimate the rheological properties and slip characteristics of five solutions as shown in Table 3. Among these five solutions, 0.2M(40%)1K, 0.2M(60%)1K and 0.7M(20%)1K have a sufficiently high level of entanglements (32 ≤ Z ≤ 56) capable of producing shear banding across the gap at high values of Wi. We also note that only 0.7M(20%)1K was sheared at sufficiently high Wi (9 ≤ Wi ≤ 114). The two PBD solutions, based on the parent PBD200K named 0.2M(40%)1K and 0.2M(60%)1K, were only explored in the Newtonian regime (0.08 ≤ Wi ≤ 0.7). It is well established that a linear velocity profile should be maintained across the gap when Wi < 1.0.18,29| Sample | G pl (kPa) | τ (s) | Z(ϕ) | η(ϕ)d (kPa s) | a(ϕ) (nm) | b max = (η/ηs)a(ϕ)e (mm) | Wiws-bnl ∼ 2bmax/Hf |
|---|---|---|---|---|---|---|---|
a Plateau modulus of PBD samples was provided in PhD thesis of Keesha Hayes.36
b
Z(ϕ) is estimated by (Mw/Me)ϕ1.2, where Me = 1600 g mol−1 for 1,4 PBD melts.
c
Z(ϕ) is reported by Hayes et al., where Me is assumed to be around 2000 g mol−1.
d Bulk shear viscosity of polymer solutions is estimated to be  .5
e Maximum extrapolation length is estimated, where solvent viscosity (PBD1K, Mn ∼ 1000 g mol−1, Aldrich Inc.) is assumed to be around 4.0 Pas at room temperature.37 The vinyl content of PBD1K (Aldrich 200417) is higher than PBD1.5K (Aldrich 200484) leading to lower Tg and higher viscosity.
f Wiws-bnl is estimated, where H = 35 μm. .5
e Maximum extrapolation length is estimated, where solvent viscosity (PBD1K, Mn ∼ 1000 g mol−1, Aldrich Inc.) is assumed to be around 4.0 Pas at room temperature.37 The vinyl content of PBD1K (Aldrich 200417) is higher than PBD1.5K (Aldrich 200484) leading to lower Tg and higher viscosity.
f Wiws-bnl is estimated, where H = 35 μm.
|
|||||||
| 0.7M(5%)1K | 1.3 | 2.7 | 12b, 8c | 3 | 27 | 0.02 | 0.5 |
| 0.7M(10%)1K | 7.5 | 11 | 27b, 20c | 67 | 17 | 0.26 | 7 |
| 0.7M(20%)1K | 44 | 31.6 | 63b, 51c | 1142 | 11 | 2.82 | 80 |
| 0.2M(40%)1K | 220 | 0.8 | 41b, 32c | 145 | 7 | 0.25 | 7 |
| 0.2M(60%)1K | 511 | 1 | 68b, 56c | 420 | 5 | 0.56 | 16 |
In general, at low shear rates (Wi < 1.0), the nominal and local Weissenberg numbers are the same, which is consistent with previous reports on entangled systems.18,30 Besides, at Wi = 0.7 and 0.5 (closer to Wi = 1), both 0.2M(40%)1K and 0.2M(60%)1K suffered from some degree of wall slip,30 as denoted by the triangles in Fig. 10. This is expected.
At higher Wi in the non-Newtonian regime (Wi > 1.0), we see that Wib remains the order of unity because of the dominant wall slip in 1M(13%)1.5K, except for last two points. In the explored range of apparent shear rates, the solution based on the 1.5 K solvent has b equal to 1100 μm and shows interfacial slip or apparent wall slip only up to Wi = 288 (![[small gamma, Greek, dot above]](https://www.rsc.org/images/entities/i_char_e0a2.gif) τR ∼ 1.8). The PBD solution with a PBD10K solvent shows the coexistence of high and low shear bands, along with wall slip because its b = 190 μm. We note that beyond Wi = 100;
τR ∼ 1.8). The PBD solution with a PBD10K solvent shows the coexistence of high and low shear bands, along with wall slip because its b = 190 μm. We note that beyond Wi = 100; ![[small gamma, Greek, dot above]](https://www.rsc.org/images/entities/i_char_e0a2.gif) τR ∼ 0.6, there can be three bands of different local rates in the bulk for 1M(13%)10K. In contrast, a linear velocity profile without wall slip was reported by Hayes et al. for their 0.7M(20%)1K (Z ∼ 51) till Wi = 45. The lack of wall slip is at odds with their report of wall slip for the other solutions and in disagreement with our findings shown in Fig. 10. When Wi is increased to 113, the velocity profile began to deviate significantly from nominal Wi, displaying shear banding. This response can be consistent with our observation of shear banding, because shear banding should occur for 0.7M(20%)1K when Wi > Wiws-bnl ∼ 80 (see diamonds in Fig. 10). However, Hayes et al. suggested that this behavior could be originated from secondary flows due to chain stretching and normal stresses at a high shear rate. Since most of the reported values of Wi in Hayes et al.'s measurements are less than critical Wiws-bnl, except for one date point of 0.7M(20%)1K (at Wi = 113), it is expected to observe a linear velocity profile in their measurements. In this work since the point of PTV observation is so far away from the edge, it is implausible for our results to have anything to do with any edge instability. Thus we have proposed localized chain disentanglement as the origin of shear banding, more systematic studies are required to look for evidence of the secondary flow phenomenon and the effect of edge failure on the bulk velocity profile of well-entangled PBD solutions in such small-gap shear cells.
τR ∼ 0.6, there can be three bands of different local rates in the bulk for 1M(13%)10K. In contrast, a linear velocity profile without wall slip was reported by Hayes et al. for their 0.7M(20%)1K (Z ∼ 51) till Wi = 45. The lack of wall slip is at odds with their report of wall slip for the other solutions and in disagreement with our findings shown in Fig. 10. When Wi is increased to 113, the velocity profile began to deviate significantly from nominal Wi, displaying shear banding. This response can be consistent with our observation of shear banding, because shear banding should occur for 0.7M(20%)1K when Wi > Wiws-bnl ∼ 80 (see diamonds in Fig. 10). However, Hayes et al. suggested that this behavior could be originated from secondary flows due to chain stretching and normal stresses at a high shear rate. Since most of the reported values of Wi in Hayes et al.'s measurements are less than critical Wiws-bnl, except for one date point of 0.7M(20%)1K (at Wi = 113), it is expected to observe a linear velocity profile in their measurements. In this work since the point of PTV observation is so far away from the edge, it is implausible for our results to have anything to do with any edge instability. Thus we have proposed localized chain disentanglement as the origin of shear banding, more systematic studies are required to look for evidence of the secondary flow phenomenon and the effect of edge failure on the bulk velocity profile of well-entangled PBD solutions in such small-gap shear cells.
3.7. Suppression of edge effects at a small gap
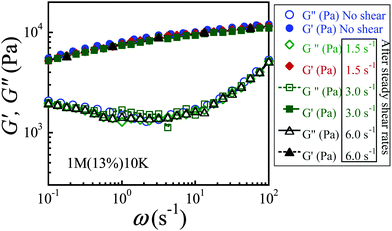
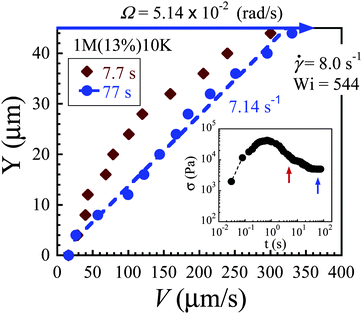
Edge fracture occurs frequently in well-entangled polymeric systems at high Wi in a conventional rheometric setup (with a gap size of 1 mm).38,39 This phenomenon is attributed to the build-up of normal stresses.38,40 When edge fracture occurs, the sample may “leak out” at the meniscus during shear leading to a reduced stress response. It has been reported in the literature that a large decrease of the gap distance can minimize the edge effects during shear of entangled polymer solutions.30 We carry out SAOS to verify whether there is any sample loss during shear banding. Fig. 11 shows that dynamic oscillatory shear data are identical before and after shearing at shear rates of 1.5, 3.0 and 6.0 s−1.Additionally, it is known that edge fracture would be more severe at high Wi, due to increased normal force. Fig. 12 shows that at higher Wi, a linear velocity profile is actually recovered in the steady state. Specifically, at a sufficiently high shear rate of 8.0 s−1, the uniform shear is recovered (at t = 77 s) after showing transient inhomogeneity (at t = 7.7 s) across the gap. Therefore, we can conclude that edge fracture has been minimized and sample loss is negligible in our measurements, and our setup can be ideal for studying the non-linear response in entangled polymers at high Wi.
3.8. The phase diagram
We can construct a “phase diagram” to summarize our findings in terms of Wi versus 2bmax/H, as shown in Fig. 13. Clearly, bmax is one of the key parameters to highlight when and what type of shear inhomogeneity may occur at different Wi for a fixed gap. For both 0.7M(20%)1K and 1.0M(13%)1.5K, much higher Wi is required to obtain shear banding, due to a high value of slip length. We should emphasize that this phase diagram can only qualitatively describe whether shear banding occurs or not during shear for well-entangled systems (Z > 40).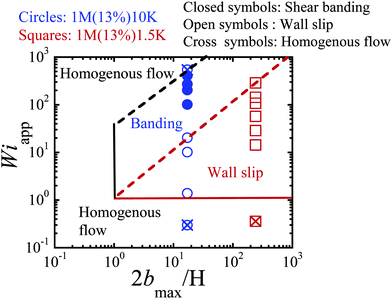 | ||
| Fig. 13 Phase diagram in the parameter space of apparent Wi versus 2bmax/H for our findings at a small gap for PBD solutions (Z = 54) in different PBD solvents. | ||
4 Conclusions
In this study, two entangled PBD solutions with the same level of entanglement (Z = 54) have been subjected to various values of nominal shear rate![[small gamma, Greek, dot above]](https://www.rsc.org/images/entities/i_char_e0a2.gif) to explore their nonlinear rheological responses in a shear cell with a small gap distance in the 50 micron range. Because the gap distance was unconventionally small, the PTV observations could be free of edge effects without implementation of a cone-partitioned plate.39,41–43 Using a confocal microscope integrated with a rotational rheometer, we obtain simultaneous global rheology (apparent rheometric measurements) and local velocity profiles. This setup allows us to probe when and what type of shear inhomogeneity (interfacial slip vs. shear banding) occurs across the gap. For the entangled PBD solution made with a low molecular weight PBD (Mw = 1.5 kg mol−1), only interfacial slip or apparent wall slip can be observed up to a shear rate of 8 s−1. In contrast, the second solution, the higher molecular weight PBD (Mw = 10 kg mol−1) solvent reduces the magnitude of the slip length b so that apart from wall slip bulk shear banding can also take place at the experimentally accessible shear rates. The prevalence of interfacial slip in 1M(13%)1.5K is consistent with the findings of Hayes and coworkers.30,31 On the other hand, 1M(13%)10K exhibits shear banding despite a small gap distance of 50 μm, when imposed Wi exceeds a critical value if Wi, i.e., 2bmax/H. Finally, at sufficiently high Wi, shear homogeneity is restored across the gap for 1M(13%)10K.
to explore their nonlinear rheological responses in a shear cell with a small gap distance in the 50 micron range. Because the gap distance was unconventionally small, the PTV observations could be free of edge effects without implementation of a cone-partitioned plate.39,41–43 Using a confocal microscope integrated with a rotational rheometer, we obtain simultaneous global rheology (apparent rheometric measurements) and local velocity profiles. This setup allows us to probe when and what type of shear inhomogeneity (interfacial slip vs. shear banding) occurs across the gap. For the entangled PBD solution made with a low molecular weight PBD (Mw = 1.5 kg mol−1), only interfacial slip or apparent wall slip can be observed up to a shear rate of 8 s−1. In contrast, the second solution, the higher molecular weight PBD (Mw = 10 kg mol−1) solvent reduces the magnitude of the slip length b so that apart from wall slip bulk shear banding can also take place at the experimentally accessible shear rates. The prevalence of interfacial slip in 1M(13%)1.5K is consistent with the findings of Hayes and coworkers.30,31 On the other hand, 1M(13%)10K exhibits shear banding despite a small gap distance of 50 μm, when imposed Wi exceeds a critical value if Wi, i.e., 2bmax/H. Finally, at sufficiently high Wi, shear homogeneity is restored across the gap for 1M(13%)10K.
Acknowledgements
This study was supported by the European Research Council under the European Unions Seventh Framework Programme (FP/2007-2013)/ERC Grant, agreement no. 337820 (to P.E.B) and NSF-DMR-1105135 (to S.Q.W). We would like to thank Malvern Instruments Ltd for loaning the rheometer. We are grateful to Michiel Kreutzer, and Yogesh Harshe for fruitful discussion.Notes and reference
- M. Rubinstein and R. Colby, Polymer Physics, Oxford, 2000 Search PubMed.
- R. B. Bird, R. C. Armstrong and O. Hassager, Dynamics of polymer liquids, Wiley, New York, 1977 Search PubMed.
- J. D. Ferry, Viscoelastic Properties of Polymers, Wiley, New York, 1980 Search PubMed.
- P. G. deGennes, J. Chem. Phys., 1971, 55, 572–579 CrossRef PubMed.
- M. Doi and S. F. Edwards, The theory of polymer dynamics, Oxford University, Oxford, 1986 Search PubMed.
- T. C. B. McLeish, Adv. Phys., 2002, 5, 1379–1527 CrossRef PubMed.
- S. Q. Wang, S. Rvindranath, Y. Wang and P. E. Boukany, J. Chem. Phys., 2007, 127, 064903 CrossRef PubMed.
- (a) N. A. Spenely, M. E. Cates and T. C. B. McLeish, Phys. Rev. Lett., 1993, 71, 939–942 CrossRef; (b) M. Britton and P. Callaghan, Phys. Rev. Lett., 1997, 78, 4930 CrossRef CAS; (c) R. W. Mair and P. T. Callaghan, Europhys. Lett., 1996, 36, 719 CrossRef CAS; (d) M. M. Britton, R. W. Mair, R. K. Lambert and P. T. Callaghan, J. Rheol., 1999, 43, 897 CrossRef CAS.
- Y. T. Hu and A. Lips, J. Rheol., 2005, 49, 1001–1027 CrossRef CAS.
- P. E. Boukany and S.-Q. Wang, Macromolecules, 2008, 41, 1455–1464 CrossRef CAS.
- M. A. Fardin, T. Divoux, M. A. Guedeau-Boudeville, I. Buchet-Maulien, J. Browaeys, G. H. McKinley, S. Mannevillece and S. Lerouge, Soft Matter, 2012, 8, 2535–2553 RSC.
- (a) J. B. Salmon, A. Colin, S. Manneville and F. Molino, Phys. Rev. Lett., 2003, 90, 228303 CrossRef; (b) S. Manneville, A. Colin, G. Waton and F. Schosseler, Phys. Rev. E: Stat., Nonlinear, Soft Matter Phys., 2007, 75, 061502 CrossRef; (c) P. Lettinga and S. Manneville, Phys. Rev. Lett., 2009, 103, 24830 CrossRef.
- (a) P. Tapadia and S.-Q. Wang, Phys. Rev. Lett., 2006, 96, 016001 CrossRef; (b) P. E. Boukany and S. Q. Wang, J. Rheol., 2007, 51, 217 CrossRef CAS; (c) S. Ravindranath and S. Q. Wang, J. Rheol., 2008, 52, 957 CrossRef CAS.
- S. Ravindranath, S.-Q. Wang, M. Olechnowicz and R. P. Quirk, Macromolecules, 2008, 41, 2663–2670 CrossRef CAS.
- Y. T. Hu, J. Rheol., 2010, 54, 1307–1323 CrossRef CAS.
- P. T. Callaghan and A. M. Gil, Macromolecules, 2000, 33, 4116–4124 CrossRef CAS.
- S. Jaradat, M. Harveyab and T. A. Waigh, Soft Matter, 2012, 8, 11677–11686 RSC.
- P. E. Boukany, Y. T. Hu and S.-Q. Wang, Macromolecules, 2008, 41, 2644–2650 CrossRef CAS.
- P. E. Boukany and S.-Q. Wang, Soft Matter, 2009, 5, 780–789 RSC.
- P. E. Boukany and S.-Q. Wang, J. Rheol., 2009, 53, 73–83 CrossRef CAS.
- I. Kunita, K. Sato, Y. Tanaka, Y. Takikawa, H. Orihara and T. Nakagaki, Phys. Rev. Lett., 2012, 109, 248303 CrossRef.
- P. E. Boukany, S.-Q. Wang and X. Wang, Macromolecules, 2009, 42, 6261–6269 CrossRef CAS.
- Y. Fang, G. Wang, N. Tian, X. Wang, X. Zhu, P. Lin, G. Ma and L. Li, J. Rheol., 2011, 55, 939–949 CrossRef CAS.
- P. E. Boukany and S.-Q. Wang, Macromolecules, 2010, 43, 6950–6952 CrossRef CAS.
- S. Cheng and S.-Q. Wang, J. Rheol., 2012, 56, 1413–1428 CrossRef CAS.
- Y. Li, M. Hu, G. B. McKenna, C. J. Dimitriou, G. H. McKinley, R. M. Mick, D. C. Venerus and L. A. Archer, J. Rheol., 2013, 57, 1411–1428 CrossRef CAS.
- S.-Q. Wang, G. Liu, S. Cheng, P. E. Boukany, Y. Wang and X. Li, J. Rheol., 2014, 58, 1059–1069 CrossRef CAS.
- S. Ravindranath, S.-Q. Wang, M. Olechnowicz, V. S. Chavan and R. P. Quirk, Rheol. Acta, 2011, 50, 97–105 CrossRef CAS.
- S.-Q. Wang, S. Ravindranath and P. E. Boukany, Macromolecules, 2011, 44, 183–190 CrossRef CAS.
- K. A. Hayes, M. R. Buckley, I. Cohen and L. A. Archer, Phys. Rev. Lett., 2008, 101, 218301 CrossRef.
- K. A. Hayes, M. R. Buckley, H. Qi, I. Cohen and L. A. Archer, Macromolecules, 2010, 43, 4412–4417 CrossRef CAS.
- (a) L. Leger, E. Raphael and H. Hervet, Adv. Polym. Sci., 1999, 138, 185–225 CrossRef CAS; (b) M. M. Denn, Annu. Rev. Fluid Mech., 2001, 33, 265 CrossRef; (c) E. Granick, et al. , J. Polym. Sci., Part B: Polym. Phys., 2003, 41, 2755 CrossRef PubMed; (d) G. S. Hatzikiriakos, Prog. Polym. Sci., 2012, 37, 624 CrossRef PubMed.
- P. E. Boukany and S.-Q. Wang, Macromolecules, 2009, 42, 2222–2228 CrossRef CAS.
- P. E. Boukany, O. Hemminger, S.-Q. Wang and L. J. Lee, Phys. Rev. Lett., 2010, 105, 027802 CrossRef.
- L. J. Fetters, D. J. Lohse, D. Richter, T. A. Witten and A. Zirkel, Macromolecules, 1994, 27, 4639–4647 CrossRef CAS.
- K. Hayes, Nonlinear Rheolgy of Entangled Polymers: Implications of Shear Banding and Interfacial Slip, PhD dissertation, Cornell University, 2009 Search PubMed.
- P. Tapadia, PhD thesis, University of Akron, 2005.
- R. G. Larson, Rheol. Acta, 1992, 31, 213–263 CrossRef CAS.
- S. Ravindranath and S. Q. Wang, J. Rheol., 2008, 52, 957–980 CrossRef CAS.
- R. I. Tanner and M. Keentok, J. Rheol., 1983, 27, 47–57 CrossRef.
- J. Meissner, R. W. Garbella and J. Hostettler, J. Rheol., 1989, 33, 843–864 CrossRef CAS.
- T. Schweizer, Rheol. Acta, 2002, 41, 337–344 CrossRef CAS.
- F. Snijkers and D. Vlassopoulos, J. Rheol., 2011, 55, 1167–1186 CrossRef CAS.
| This journal is © The Royal Society of Chemistry 2015 |

