 Open Access Article
Curing kinetics and morphology of a nanovesicular epoxy/stearyl-block-poly(ethylene oxide) surfactant system
K.
Bogaerts
a,
A.
Lavrenova
a,
A. B.
Spoelstra
b,
N.
Boyard
c and
B.
Goderis
*a
aPolymer Chemistry & Materials, KU Leuven, Celestijnenlaan 200F, P.O. Box 2404, 3001 Heverlee, Belgium. E-mail: bart.goderis@chem.kuleuven.be
bDepartment of Chemical Engineering and Chemistry, Laboratory of Polymer Technology, Eindhoven University of Technology, P.O. Box 513, 5600 MB, Eindhoven, The Netherlands
cLaboratoire de Thermocinétique de Nantes, UMR 6607 CNRS/Université de Nantes, La Chantrerie, Rue Christian Pauc, BP 50609, F-44306 Nantes Cedex 3, France
First published on 29th June 2015
Abstract
Brittle epoxy based thermosets can be made tougher by introducing structural inhomogeneities at the micro- or nanoscale. In that respect, nano vesicles and worm-like micelles from self-assembling blockcopolymers have been shown to be very effective. This paper describes the curing kinetics and morphology of an epoxy composed of diglycidyl ether of bisphenol A (DGEBA) and 4,4′-methylenedianiline (MDA), modified by 20% of the surfactant stearyl-block-poly(ethylene oxide). Time resolved, synchrotron small-angle X-ray scattering demonstrates that at any time during the epoxy curing process, the surfactant predominantly adopts a bilayer vesicular nano-morphology. Transmission electron microscopy on fully cured systems reveals the coexistence of spherical and worm-like micelles. Differential scanning calorimetry experiments prove that the presence of surfactant reduces the epoxy curing rate but that ultimately full curing is accomplished. The material glass transition temperature falls below that of the pure resin due to plasticization. It is suggested that favorable secondary interactions between the PEO segments and the epoxy resin are responsible for the observed phenomena.
1. Introduction
The development of high performance materials, combining high stiffness and toughness, is one of the main challenges in polymer material science. Toughening stiff, but inherently brittle epoxy based thermosets can be accomplished by introducing structural inhomogeneities at the micro- or nanoscale.1–6 However, traditional toughening routes, involving the addition of micrometre sized rubbery inclusions, often undermine the material stiffness and creep resistance and frequently lower the glass-transition temperature.2 Alternatively, the blending with high performance thermoplastics creates processing difficulties, while only marginally enhancing the material toughness.7 Toughening without these shortcomings can be accomplished by amphiphilic block copolymer modification, thereby providing the system with a distinct nanometer morphology, which depends on the nature of the block copolymer, the curing kinetics and matrix viscosity. Dean et al.8,9 demonstrated that block copolymer vesicles and especially cylindrical (worm-like) micelles can very effectively toughen epoxy resins. This conclusion was challenged in later research10–12 but the ultimate conclusion seems to be that indeed morphologies composed of vesicles and cylindrical micelles are optimal for epoxy toughening.13The interplay of several parameters dictates the block copolymer self-assembly, which in the end is governed by a minimization of unfavorable interactions. These parameters include the block copolymer molar mass, the (mass or volume) fraction f of each block and the effective interaction energy (ε) between block monomers.14 Furthermore, to form nanostructures one block should be miscible, the other immiscible with the matrix.15
According to Israelachvili,16 the packing parameter, p, dictates the most likely self-assembled morphology and is defined as follows:
 | (1) |
From an application point of view, the curing kinetics and the final curing degree (conversion) are crucial, besides the materials ultimate properties. During curing the system glass transition temperature (Tg) increases. In isothermal conditions, the reaction is chemically controlled until Tg reaches the curing temperature (Tcure), after which it becomes diffusion controlled. In the latter stage, the reaction can only slowly proceed until Tg is generally 50 °C above Tcure.21 If the reaction temperature is chosen too low, the final conversion is lower than unity and can only be increased when the temperature is increased.
The present paper reports on the isothermal cure kinetics and nanostructure of a block copolymer modified epoxy. The blockcopolymer is a stearylether-block-poly(ethylene oxide) surfactant of which the PEO chains are expected to mix with the epoxy resin up to very high conversion degrees, whereas stearyl represents the incompatible block. Both blocks are crystallizable. The copolymer is blended with a thermosetting epoxy system composed of diglycidyl ether of bisphenol A (DGEBA) and 4,4′-methylenedianiline (MDA) at the stoichiometric ratio. The ultimate glass transition temperature (Tg∞) of this resin has been reported to be in between 165 °C![[thin space (1/6-em)]](https://www.rsc.org/images/entities/char_2009.gif) 22 and 175 °C
22 and 175 °C![[thin space (1/6-em)]](https://www.rsc.org/images/entities/char_2009.gif) 23 implying that complete curing of the pure resin is expected after sufficient time at an isothermal temperature of at least 115–125 °C.
23 implying that complete curing of the pure resin is expected after sufficient time at an isothermal temperature of at least 115–125 °C.
The isothermal cure kinetics were analyzed by differential scanning calorimetry (DSC) and the morphology by simultaneous synchrotron small and wide angle X-ray scattering (SAXS and WAXD) in combination with transmission electron microscopy (TEM).
2. Experimental
2.1 Materials and sample preparation
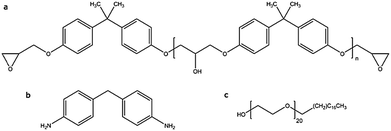
Diglycidyl ether of bisphenol A (DGEBA) with epoxide equivalent weight of 184–190 (Epikote828LVEL) was purchased at Hexion. The curing agent, 4,4′-methylenedianiline (MDA), was supplied by Aldrich Chemical Co. The structure forming diblock copolymer, namely stearyl-block-poly(ethylene oxide20) was supplied under the commercial name Brij S-20 from Aldrich Chemical Co. The blend contains 20% S-20 relative to the total material mass. For its preparation DGEBA was mixed with the right amount of S-20 at 70 °C and degassed at 70 °C in vacuum. Next, this mixture was brought to 100 °C and sonicated for 4 min. Half way the sonication time, the curing agent was added at the stoichiometric ratio (i.e. half the DGEBA molar quantity) while sonication continued. Finally, the mixture was quenched in salted ice water to prevent further curing and stored in a freezer at −18 °C until measurements took place. A reference resin was prepared without the addition of S-20, following exactly the same procedure. Fig. 1 illustrates the chemical components used in this work.2.2 DSC
The calorimetric measurements were carried out on a TA instruments Q2000 DSC, equipped with an RCS cooler. Nitrogen was used as purge gas. For enthalpy and temperature calibration an indium standard was used. Samples between 12 and 25 mg were enclosed in Tzero aluminum hHermetic pans. Firstly, samples were heated from −50 to 300 °C at a heating rate of 10 °C min−1 to determine the total reaction enthalpy (ΔH0). Secondly, isothermal curing was executed at different temperatures while the evolution of the reaction enthalpy was followed. For these isothermal measurements, the samples were heated at 200 °C min−1 to the selected temperature to minimize curing during heating. The isothermal time at a given temperature varied between 300 and 400 min, which was enough to complete the reaction for most samples. After the isothermal curing, samples were cooled at 10 °C min−1 to −50 °C and after 2 min heated again to 300 °C to record the system glass transition temperature and residual reaction heat. Another DSC experiment aimed at mimicking the synchrotron X-ray thermal protocol and involved cooling of the starting mixture from 60 °C to −50 °C at 10 °C min−1 (cooling 1), followed by 2 min isothermal time and heating at the same rate to 130 °C (heating 1) where the sample was allowed to cure for 60 min. Afterwards the sample was cooled down to −50 °C (cooling 2) and heated up again after 2 min to 200 °C (heating 2), all at 10 °C min−1.2.3 Synchrotron SAXS/WAXD
Temperature-resolved synchrotron X-ray scattering experiments were performed at DUBBLE, the Dutch-Belgian Beamline (BM26) at the European Synchrotron Radiation Facility (ESRF; Grenoble, France) using a wavelength, λ, of 1.03 Å. The samples were placed in Tzero Aluminium Hermetic DSC pans. Temperature was imposed through a Linkam DSC 600 heating/freezing stage. Small-angle X-ray scattering (SAXS) patterns were collected on a two-dimensional (2D) Pilatus 1 M detector, placed at 2 m from the sample after an evacuated tube. The wide-angle X-ray diffraction (WAXD) data were collected on a Pilatus 300K-W detector from Dectris put closely to the sample. The scattering angles were calibrated with Silver Behenate (SAXS) and HDPE (WAXD). SAXS data were normalized by the total WAXD intensity, assuming conservation of the total scattering mass. The 2D data were averaged azimuthally using the ConeX24 software and represented as a function of the scattering vector modulus q = 4π/λ sin(θ/2), with λ the wavelength and θ the scattering angle. The following temperature profile was imposed to the sample shortly after having been taken out from the freezer: cooling from 60 °C to −50 °C at 10 °C min−1 (cooling 1), 2 min isothermal time, heating at 10 °C min−1 to 130 °C (heating 1), 60 min isothermal at 130 °C and cooling from 130 °C down to −50 °C at 10 °C min−1 (cooling 2). Simultaneous SAXS and WAXD patterns were collected for 4.6 s every 6 s during the segments 1 and 3 and every 60 s during the isothermal segment 2.2.4 TEM
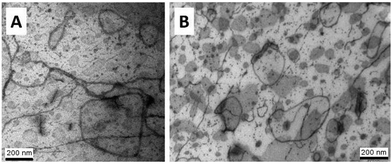
An epoxy-copolymer blend sample was prepared for transmission electron microscopy (TEM) by isothermal curing at 130 °C for 60 min and cooling down at 10 °C min−1 to room temperature. TEM was performed using a Tecnai 20 microscope, operated at 200 kV. The samples were trimmed using a Diatome trimming tool and subsequently ultrathin sections (70 nm) were obtained at −85 °C using a Leica Ultracut S/FCS microtome, equipped with a Diatome 35° diamond knife. The sections were put on a 200 mesh copper grid with a carbon support layer. Staining was applied using the vapor of a rutheniumtetroxide (RuO4)-solution prepared according to Montezinos et al. for 15/30 minutes.25In a second experiment, samples were cured at 45 °C for 2 days and postcured successively at 80 °C for 6 h and 150 °C for 90 min. TEM images were made with a Philips CM10, operating at 80 kV. After trimming, 90 nm sections were made using a Drukker International diamond knife at a sample temperature of −80 °C and with the knife at −60 °C. The sections were collected in a solution of water/dimethylsulfoxide (50/50) filled boat, attached to the diamond knife. They were deposited on 300 mesh copper grids and dried on a filter paper. Staining with vapors of a 0.5 wt% aqueous solution of RuO4 was applied for 15–30 min, following the process described elsewhere.26
RuO4 selectively stains the components in the order PEO > stearyl ether > cured epoxy, leading to an increased contrast between the potential phases. Note that RuO4 is a powerful oxidizer, irritant to both the eyes and respiratory system. It has to be used with a maximum of safety conditions.
3. Results and discussion
3.1 Curing kinetics of S-20 modified epoxy resin
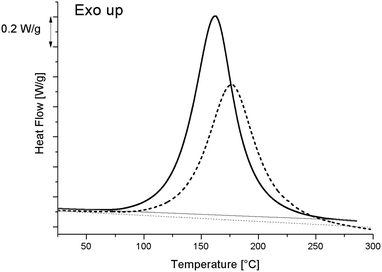
As curing kinetics are important in epoxy systems, governing the mobility of the matrix and therefore possibly influencing the morphology development, a thorough analysis of the curing kinetics was performed. Fig. 2 displays the heat flow as measured by DSC while heating from −90 °C to 300 °C at 10 °C min−1. The reference resin sample (i.e. without S-20) curing reaction generates a broad exothermic peak, starting at around 80 °C and peaking at 164 °C. The total reaction enthalpy (ΔH0), calculated by integrating the area enclosed between the curves and straight baselines, amounts to 432.0 J g−1 for the reference resin and to 358.0 J g−1 for the blend with 20% S-20. Since the curing starts at 80 °C, it is clear that the preparation method, involving sonication at 100 °C should already have induced some curing. To estimate the conversions properly, one must determine the maximum total reaction enthalpy, further referred to as ΔHmax. A resin with stoichiometric amounts of DGEBA and MDA was prepared by stirring rather than sonicating at 100 °C for only 1 min in order to minimize curing during preparation. This system was subjected to a similar DSC heating run, yielding a ΔHmax of 447.8 J g−1. These conditions cannot fully exclude resin curing but are mandatory to enable MDA melting (the melting point is 89 °C) and resin mixing.The curing enthalpy during sample preparation (ΔHprep) can be calculated for both the S-20 modified and unmodified resins through eqn (2):
| ΔHprep = ΔHmax − ΔH0 | (2) |
| ΔHprep,0%S-20 = ΔHmax − ΔH0 = 447.8 (J g−1) − 432.0 (J g−1) = 15.8 (J g−1) | (3) |
| ΔHprep,20%S-20 = (ΔHmax × 0.8) − ΔH0 = 447.8 (J g−1) × 0.8 − 358.0 (J g−1) = 0.2 (J g−1) | (4) |
One can readily compute that only 0.2/(447.8 × 0.8) × 100 = 0.05% of the resin cured during blend preparation. The decreased conversion during mixing compared to the reference resin indicates that blending with S-20 reduces the reaction rate at 100 °C. Fig. 2 reveals that the reaction kinetics in general is slowed down: the peak maximum is shifted to a higher temperature compared to pure resin. Ultimately, during heating at 10 °C min−1 the S-20 modified system reaches full curing once 280 °C has been exceeded. It should be mentioned though that pure S-20 starts decomposing at about 150 °C following thermogravimetric evidence (data not shown). This degradation of S-20 as well as the heat associated with it (expected to be 5.5 J g−1 in the blend) was neglected in the ΔHprep,20%S-20 determination, but sets an upper limit to the useful isothermal curing temperature, which was limited to 130 °C in the present study.
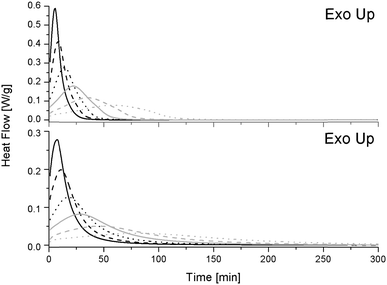
Fig. 3 displays the heat flow generated during isothermal conditions after heating the pure (top) and S-20 modified (bottom) resins to the desired temperature at 200 °C min−1. As heat flow is proportional to the reaction rate, the presence of an (isothermal) exothermic peak points at an acceleration of the initial reaction rate. This is known to be due to the formation of hydroxyl groups during the epoxy-amino reaction, which induce an autocatalytic effect.27 After this maximum, the reaction rate decreases, which may be due to a decrease of available functional groups, exhaustion of more reactive primary amines, gelation or vitrification.22 For both systems the maximum reaction rate is higher and the time to reach the maximum decreases at increasing isothermal temperatures. Reactions are thus accelerated by a thermal effect.
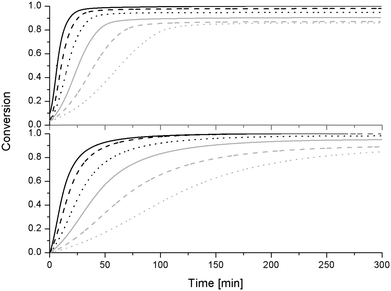
The epoxy resin conversion (α) at time t is calculated by dividing the reaction enthalpy at time t by the maximum total reaction enthalpy
| α = ΔHt/ΔHmax | (5) |
| α = (ΔHt + ΔHprep,0%S-20)/(ΔHmax) | (6) |
| α = (ΔHt + ΔHprep,20%S-20)/(ΔHmax × 0.8) | (7) |
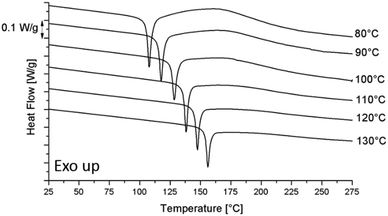 | ||
| Fig. 5 The DSC heating runs at 10 °C min−1 for the pure epoxy resin after curing at different Tcure and cooling down to −50 °C at 10 °C min−1. | ||
Complete curing in combination with a Tg reduction, suggests that S-20 acts as a plasticizer for the epoxy resin. Whether or not S-20 interferes chemically can be deduced from an analysis of the curing reaction activation energy as outlined in the next paragraph.
Following arguments by Lu and Kim,22 the time to reach a given conversion, tα, is related to the reaction activation energy, Ea and the thermodynamic temperature, T, via:
 | (8) |
![[thin space (1/6-em)]](https://www.rsc.org/images/entities/char_2009.gif) tα for different curing temperatures (expressed as 1/T) should yield straight lines with a slope equal to Ea/R. Changes in Ea as a function of the conversion may point to changes in the curing mechanism.
tα for different curing temperatures (expressed as 1/T) should yield straight lines with a slope equal to Ea/R. Changes in Ea as a function of the conversion may point to changes in the curing mechanism.
Fig. 6 is such a graph for the pure epoxy resin. All lines are linear. Conversions above 70% (data not shown) produced non-linear graphs, likely because a diffusion controlled stage was entered at the lowest curing temperatures.28 The experiment at 130 °C was excluded because of the uncertainty in the conversion.
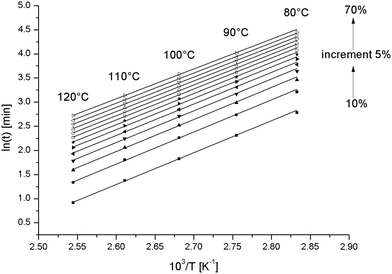 | ||
| Fig. 6 Correlation of the logarithm of time to reach a given conversion versus the inverse of the temperature for different conversions for the pure epoxy resin. | ||
In Fig. 7, Ea extracted from the slopes in Fig. 6 is displayed (open circles) for the different conversions. These values are slightly higher compared to values reported earlier for the same resin.22 The decrease in Ea with increasing conversion has been observed earlier and has been attributed to the formation of hydroxyl groups from the reaction between the amine and the epoxy.29 The hydroxyl groups facilitate epoxy ring opening and thereby catalyze the curing reaction. This is accompanied by a reduction of the activation energy.29 At higher conversions, one expects and often observes an increase in Ea because of an increase of the viscosity of the reaction mixture.29 But, as mentioned above, these data were excluded because of the non-linearity in the related graphs.
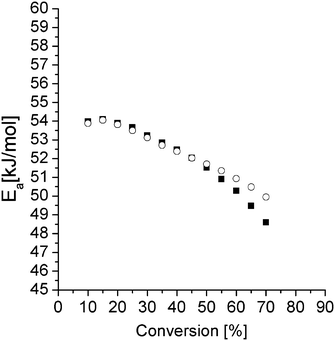 | ||
| Fig. 7 E a for the pure epoxy resin (open circles) and the S-20 modified resin (closed squares) extracted from the slopes in the Fig. 6 and 8 respectively. | ||
A change in the reaction mechanism by adding S-20, would show up in a change of Ea compared to in the pure epoxy resin. In Fig. 8, the counterpart of Fig. 6 is shown for the S-20 modified epoxy resin and the corresponding Ea values are included in Fig. 7 (black squares).
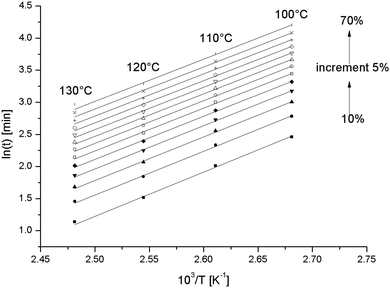 | ||
| Fig. 8 Correlation of the logarithm of time to reach a given conversion versus the inverse of the temperature for different conversions for the S-20 modified epoxy resin. | ||
Here the 130 °C data are included but the 80 °C and 90 °C data are left out for reasons mentioned above. The Ea values are not different from the pure resin values, except at the highest temperatures where the pure resin values are slightly higher. This result suggests that S-20 does not mechanistically interfere in the epoxy curing reaction. A plasticizing effect can be inferred from the lower Ea values for the S-20 modified system at high conversions where the pure epoxy system apparently starts experiencing mobility related problems. The slower curing rate for S-20 modified systems compared to pure epoxy resin can thus be fully attributed to a dilution effect.
3.2 Morphology of S-20 modified epoxy resin
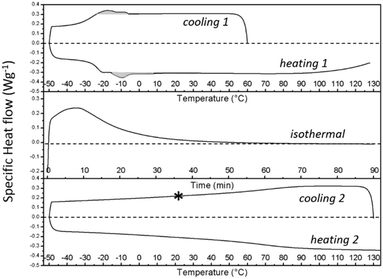 | ||
| Fig. 9 DSC thermograms for the S-20 modified epoxy resin, related to the thermal protocol used during time-resolved X-ray based morphological characterization. Exothermic signals are plotted upwards. The program includes cooling 1 and heating 1 at 10 °C min−1 (top panel), isothermal curing at 130 °C for 90 min (middle panel), followed by cooling 2 and heating 2 at 10 °C min−1 (bottom panel). The grey areas in the top panel highlight the exo (cooling 1) and endothermic (heating 1) heats related to respectively the crystallization and melting of S-20. The asterisk indicates the temperature at which transmission electron microscopy pictures were collected. This point corresponds to point F in Fig. 12. | ||
The thermal protocol up to the asterisk in the bottom panel of Fig. 9, corresponds to the protocol imposed to the sample that was investigated by TEM.
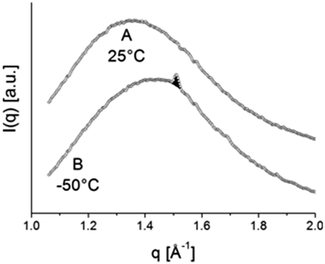 | ||
| Fig. 11 WAXD pattern, typical of amorphous material at 25 °C (A) and WAXD pattern at −50 °C (B), displaying one clear reflection at approximately q = 1.5 Å. The patterns A and B correspond to the temperatures labelled A and B in Fig. 12. | ||
For a hexagonal structure, one clear reflection at approximately q = 1.5 Å is expected, whereas for orthorhombic material besides the strongest 110 reflection at about q = 1.5 Å also a weaker 200 reflection at q = 1.62 Å is expected. The absence of the latter reflection might be just a consequence of sensitivity with the amount of crystalline material being very small. The evolution of the area of this crystalline reflection is depicted as a function of time in the bottom panel of Fig. 12. This area represents a WAXD crystallinity index and was normalized such that its maximum value equals 1. In further calculations, it will be assumed that all stearyl units are crystalline at the lowest temperature. The index thus represents the crystalline stearyl fraction.
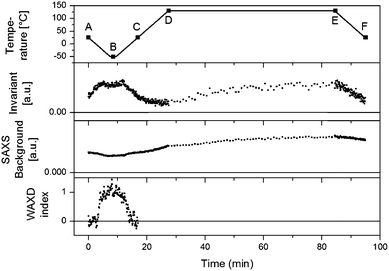 | ||
| Fig. 12 Top panel: the followed temperature profile with six key points highlighted. Second panel: the Invariant (Qt) for all SAXS patterns are interpreted in terms of (micro)phase density evolutions. Third panel: SAXS background. Bottom panel: WAXD index, the surface of the WAXD reflection (seen as the black shaded area in Fig. 11) at all times and normalized. | ||
 | (9) |
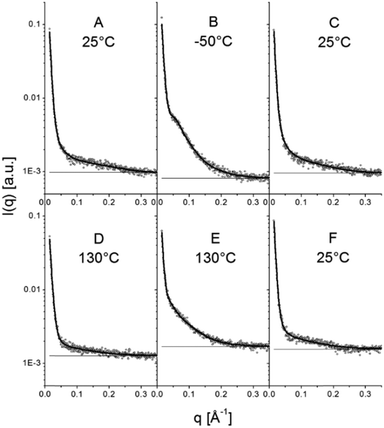 | ||
| Fig. 13 Selected SAXS patterns of the points highlighted in Fig. 12. Experimental patterns are depicted using open circles and the full lines are model curves based on eqn (15). The horizontal full lines represent the background. | ||
B is a constant background due to density fluctuations and equals the average scattered intensity in the range 0.33 Å−1 < q < 0.35 Å−1. The background values are represented by the horizontal full lines in Fig. 13. The SAXS invariant and background are depicted using arbitrary units in Fig. 12 since measurements were not conducted on an absolute scale.
Q t was nevertheless interpreted in terms of (micro)phase density evolutions, relying on a scaling procedure and some assumptions. Given that the stearyl moieties dislike the epoxy resin, most realistically the vesicular walls and micelles should be composed of a central stearyl microphase (with electron density ρ1), followed by a PEO layer on both sides (with electron density ρ2). With the epoxy matrix, the minimum number of electron densities to account for in the interpretation of Qt is three.
The mass density of the amorphous (liquid like) stearyl aliphatic chains, d1,amo, resembles that of molten polyethylene, which can be approximated by:31
| d1,amo = 0.8674 − 6.313 × 10⁻⁴T + 3.67 × 10⁻⁷T2 − 5.5 × 10⁻¹⁰T3 [g cm−3] | (10) |
The density of orthorhombic crystalline material, d1,cryst, can be computed from:32
 | (11) |
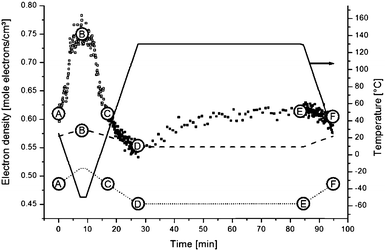 | ||
| Fig. 14 Electron densities of the different phases within the S-20 modified epoxy resin. At times larger than point C, the system is in the amorphous state and the electron density of the matrix was calculated by eqn (13) (full squares). At times shorter than point C, the system is (partly) crystalline, and therefore eqn (14) was solved to find the matrix electron density (open squares). The dotted and dashed lines respectively represent the electron density of amorphous and crystalline stearyl aliphatic chains. The full line represents the temperature profile (right axis). | ||
The density of amorphous PEO at 25 °C equals 1.092 g cm−3,33 which after multiplying with 0.5448 mole electrons per g yields an electron density of 0.59 mole electrons per cm3. DGEBA has a mass density of 1.17 g cm−3 at room temperature and MDA a (liquid) density of 1.05 g cm−3 at 100 °C. Assuming additivity and neglecting the MDA liquid density difference between 100 °C and 25 °C, the density of a stoichiometric mixture is 1.14 g cm−3. Multiplying with 0.535 mole electrons per g yields the electron density of uncured resin at 25 °C, i.e. 0.61 mole electrons cm−3. This value is very similar to that of amorphous PEO but rather different from that of the (amorphous) aliphatic segments at point A or C (see Fig. 14). With PEO and epoxy resin being well mixed, it can be assumed that Qt is dominated by the contrast between the central stearyl layer and the rest (PEO plus epoxy), further referred to as the matrix with electron density, ρm.
Accordingly, one can write for the invariant at a given time, t, and irrespective of the actual morphology, the following expression:
| Qt = P(ρm,t − ρ1,t)2 | (12) |
 | (13) |
At times shorter than point C, part of the stearyl phases is in the crystalline state. To find ρm,t the following quadratic equation needs to be solved, assuming that the stearyl microphases scatter independently and are either fully crystalline or fully amorphous:
 | (14) |
To a first approximation, ρm,t in Fig. 14 can be interpreted as being the evolution of the epoxy (electron) density. When cooled down from 25 °C (A) to −50 °C (B), the uncured epoxy density increases due to thermal contraction. The contraction decreases strongly from −22 °C onwards. This temperature coincides with the onset of vitrification seen in Fig. 9. During subsequent heating, the material expands and does so more rapidly at temperatures above −23 °C, which is at the end of the devitrification range in Fig. 9. The thermal expansion is not linear, in particular when surpassing 70 °C since the contraction due to the epoxy curing starts interfering. Once 130 °C is reached at D, curing progresses isothermally. The density increase at 130 °C is thus fully associated with the curing reaction. During cooling from E to F one expects a thermal contraction. Instead, the density remains rather constant, likely because of rapid vitrification during cooling. Interestingly, the vitrified, cured epoxy density at F is comparable with or even slightly lower than the uncured resin density at C (both 25 °C). This contra-intuitive effect has been reported earlier and can occur when rather fully cured systems vitrify isothermally or during cooling prior to reaching room temperature.34 Note that the curing induced densification of epoxy resins appears to be rather heterogeneous. This can be deduced from the increase of the SAXS background during curing (Fig. 12). In the simplest case, this background is only expected to increase with temperature due to increasing thermal density fluctuations. Curing seems to bring extra fluctuations, which are frozen in by gelation and vitrification because the expected background decrease during cooling from E to F is minimal. The heterogeneous nature of the epoxy resin can also be inferred from the broad glass transition range in the second cooling and heating runs of Fig. 9. In the past, attempts have been made to link changes in the SAXS background to the epoxy curing chemistry or to the creation of microvoids.35 The latter option is excluded since TEM did not provide any evidence for such voids (Fig. 10A). In summary, the evolution of the epoxy electron density seems realistic, supporting the underlying assumption that the stearyl demixing remains at all temperatures and times.
When sufficiently large, the vesicular curvature is limited and the SAXS patterns can be modelled as the scattering from flat vesicular walls. The black lines over the SAXS patterns in Fig. 13 are interpretations in terms of such a layer like morphology. However, to accurately describe all features in the SAXS patterns, 4 electron density levels had to be used rather than 3 and transition zones between them needed to be incorporated. Following Goderis et al.,37 such a 4 level system can be modelled as 3 superimposed block-like entities with electron density ρi and block length li on top of a constant 4th electron density level. All distances li are defined symmetrically around the center of the vesicle wall and the constraint holds that li < li+1. Eqn (15) describes the corresponding SAXS pattern:
 | (15) |
 | (16) |
Rather than reporting the resulting model parameters of eqn (15), it is instructive to compute and discuss the electron density profiles across the vesicular wall. These were obtained via a Fourier cosine transformation of the model scattering amplitude according to:
 | (17) |
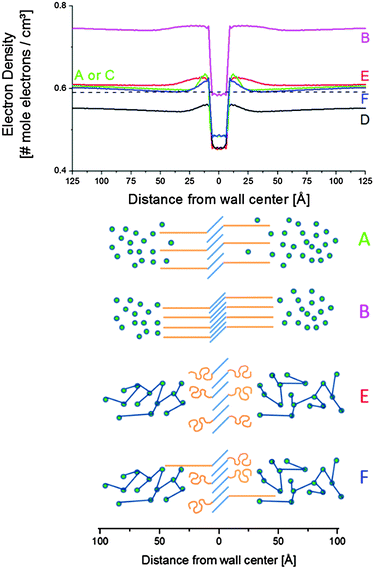 | ||
| Fig. 15 Electron density profiles across the vesicular wall (top) and sketches of corresponding structure (bottom). The blue lines in the sketches correspond to stearyl chains, the orange features to PEO. Epoxy is displayed as the green spheres, which are connected upon curing. The curve labels correspond to the letter labels in the Fig. 12, 13 and 14. | ||
Tilting and interdigitation of the aliphatic chains increases the chain cross-sectional area at the interface with the PEO zone (orange features in Fig. 15). This allows for a further separation of the PEO chains compared to when the stearyl chains would be fully stretched and oriented perpendicular to the wall surface.
The (green) electron density profiles for situation A as displayed in Fig. 15 exhibits an excess electron density at the aliphatic layer borders, suggesting a congestion of PEO chains at the interface. This crowding – likely as a result of being connected to the aliphatic chains – relaxes at larger distances from the aliphatic layer down to a density slightly higher than that of amorphous PEO at 25 °C (0.59 mole electrons per cm3, represented by the dashed line in Fig. 15). This may reflect the presence of (electron denser) epoxy resin in between the PEO chains. In fact, the driving force for the interdigitation and tilting of the aliphatic chains might be the swelling of PEO with epoxy resin. PEO is miscible with the uncured epoxy resin. The zones of lower density for situation A stretch out approximately 50 Å away from the central stearyl layer. At this point the electron density levels off to that of the epoxy matrix, ρ4. This distance corresponds to a fully stretched PEO chain with 20 monomeric units (i.e. 49 Å). The uncured epoxy resin is represented with green spheres in Fig. 15, thereby neglecting the two component nature of the resin.
At point B, all stearyl moieties are assumed to be closely packed in the crystalline state. The epoxy resin is in the uncured, vitrified state and has a higher density than in point A because of thermal contraction (see the magenta electron density profile in Fig. 15). The PEO layers now seem to be (electron) denser than the epoxy matrix. It is suggested that – because of the closer aliphatic packing – the PEO congestion now exists over the entire PEO layer, leaving little space for epoxy resin in between them. Upon heating to point C, all crystals melt and a situation identical to as in A is obtained.
Upon further heating to point D at 130 °C, all densities further decrease because of thermal expansion. Otherwise, the (black) electron density profile for situation D in Fig. 15 is very similar to that of A or C. However, the PEO regions do not stand out so clearly, suggesting less congestion at the interfaces with the stearyl layer and a higher degree of mixing with the epoxy resin compared to in A and C. Less congestion follows from the higher inter-chain distances in the central stearyl layer.
At E, the system is fully cured and still at 130 °C. The density of the central stearyl layer is identical to in D. In contrast, the cured epoxy density as well as the density of the PEO layers has increased compared to in D. The former is expected from the curing reaction. The PEO densification is accompanied by a contraction of the PEO layer, assuming that the regions of highest density represent the PEO layers. The thinner layers suggest that the PEO chains collapsed during the curing process, thereby segregating the epoxy. This process follows from the reduced mixing entropy during epoxy curing, as mentioned in the introduction. The stearyl chain tilt and interdigitation in the present case might be controlled by the necessity of accommodating the collapsed PEO chains. However, the dynamic interaction of the soft PEO chains with the curing epoxy at 130 °C may induce its softening (plasticization) and decrease of the glass transition temperature even up to distances relatively far away from the actual interface. With 20% S-20 and vesicles that are approximately 100 Å thick, it can be calculated that (for the hypothetic case of periodically stacked layers) the interaction penetration only needs to be 200 Å to affect the entire material volume. A progressively decaying interaction of the PEO chains with epoxy matrix may contribute to the heterogeneous nature of the epoxy matrix, inferred from the large SAXS background and the broad vitrification range.
After cooling down the cured material to 25 °C at point F, an electron density profile is obtained very similar to in A or C. The PEO density beyond the congestion points now reaches that of amorphous PEO, suggesting that it is a rather pure PEO phase. To avoid PEO overcrowding at the interface with the central stearyl layer, part of the PEO chains must have succeeded in stretching out to within the cured epoxy resin prior to its vitrification. The absence of exothermic heat in the DSC cooling run 2 in Fig. 9 demonstrates that the central stearyl layer is no longer able to crystallize after epoxy curing. The closer aliphatic chain packing required for crystallization seems to be prevented by the matrix vitrification prior to reaching the supercooling needed for crystallization.
3.3 Influence of curing protocol on the morphology of S-20 modified epoxy resin
To check the robustness of the obtained morphology, a second curing protocol was followed at 45 °C for a long time. The full protocol is outlined in section 2.4. This temperature falls below the ultimate Tg of the S-20 modified resin. Using eqn (8) and the data obtained in Fig. 8, one can estimate that the gelation point (70% conversion was taken) will be reached in less than 6 hours. This ensures that the morphology is fixed. Most likely curing was rather complete after 2 days, making the two post-curing steps at 80 °C and 150 °C pointless. Be that as it may, the morphology after this curing protocol as illustrated in Fig. 10B was identical to after curing at 130 °C, proving the morphological robustness of this formulation.4. Conclusions
In this work an epoxy matrix, DGEBA/MDA, was blended with 20% of an amphiphilic diblock copolymer, stearyl-block-poly(ethylene oxide20) and abbreviated as S-20, in order to introduce nanostructures by self-assembly. The epoxy curing kinetics, thermal properties and morphology were studied at the end of the curing protocol by transmission electron microscopy (TEM) and by time resolved X-ray scattering during the entire process.The S-20 modified system cures somewhat slower compared to pure epoxy resin because S-20 dilutes the epoxy reagents. However, irrespective of the studied curing temperature, which was varied between 80 °C and 130 °C, conversion progressed up to unity after curing for a sufficiently long time. S-20 does not interfere mechanistically in the resin curing reaction since the activation energies of the S-20 modified systems are identical to pure epoxy resin, at least in the early conversion stages. At higher conversions the pure resin starts experiencing mobility related problems, which lead to higher activation energies. This effect is absent in the S-20 modified system. S-20 acts as a plasticizer, bringing the cured resin glass transition temperature down from 170 °C for the pure resin to 30–90 °C for the S-20 modified system.
TEM at room temperature revealed that S-20 self-assembles into predominantly vesicles, together with a smaller fraction of cylindrical and spherical micelles. Relying on a modelling of the small angle X-ray scattering (SAXS) patterns, the vesicle walls are bilayers with stearyl moieties in the center and PEO facing the epoxy resin on both sides. Stearyl demixing remains at any time, regardless of its crystallization or the curing stage of the resin. Furthermore, SAXS based electron density profiles across the vesicular wall revealed that the stearyl chains in the central 15 Å thick layer are tilted and interdigitated throughout the entire protocol. At room temperature, the uncured epoxy is present in between the PEO chains which are presumably stretched out. The stearyl densification induced by its crystallization at low temperatures forces the PEO chains into a closer packing by which the uncured epoxy resin is squeezed out. High temperature curing reduces the PEO compatibility with the resin, by which the PEO chains coil up.
Plasticization of the matrix is an unwanted effect. However, for modifying the epoxy mechanical properties, lower S-20 concentrations can be used. The formation of nanostructures seems to be rather robust when adding S-20 since nanostructures remain during the entire curing cycle and as altering the curing protocol essentially produces the same nanostructures.
Acknowledgements
The work was performed in the context of the GOA/10/004 project “New model-based concepts for nanoengineered polymer composites”, funded by the Research Council of KU Leuven. B. Goderis thanks FWO-Vlaanderen for supporting the ESRF/DUBBLE Big Science project (G.0C12.13).References
- A. F. Yee and R. A. Pearson, J. Mater. Sci., 1986, 21, 2462–2474 CrossRef CAS.
- K. P. Unnikrishnan and E. T. Thachil, Des. Monomers Polym., 2006, 9, 129–152 CrossRef CAS PubMed.
- S. Wu, Q. Guo, S. Peng, N. Hameed, M. Kraska and Y. Mai, Macromolecules, 2012, 45, 3829–3840 CrossRef CAS.
- W. Zhang, I. Srivastava, Y.-F. Zhu, C. R. Picu and N. a. Koratkar, Small, 2009, 5, 1403–1407 CrossRef CAS PubMed.
- M. Larra, E. Serrano, M. D. Martin, A. Tercjak, G. Kortaberria, K. De Caba and C. C. Riccardi, Polym. Int., 2007, 56, 1392–1403 CrossRef PubMed.
- E. Girard-Reydet, J.-P. Pascault, A. Bonnet, F. Court and L. Leibler, Macromol. Symp., 2003, 198, 309–322 CrossRef CAS PubMed.
- M. Aravand, S. V. Lomov and L. Gorbatikh, Compos. Sci. Technol., 2015, 110, 8–16 CrossRef CAS PubMed.
- J. M. Dean, P. M. Lipic, R. B. Grubbs, R. F. Cook and F. S. Bates, J. Polym. Sci., Part B: Polym. Phys., 2001, 39, 2996–3010 CrossRef CAS PubMed.
- J. M. Dean, R. B. Grubbs, W. Saad, R. F. Cook and F. S. Bates, J. Polym. Sci., Part B: Polym. Phys., 2003, 41, 2444–2456 CrossRef CAS PubMed.
- J. M. Dean, N. E. Verghese, H. Q. Pham and F. S. Bates, Macromolecules, 2003, 36, 9267–9270 CrossRef CAS.
- J. Wu, Y. S. Thio and F. S. Bates, J. Polym. Sci., Part B: Polym. Phys., 2005, 43, 1950–1965 CrossRef CAS PubMed.
- Y. S. Thio, J. Wu and F. S. Bates, Communications, 2006, 7187–7189 CAS.
- L. Ruiz-Pérez, G. J. Royston, J. P. a. Fairclough and A. J. Ryan, Polymer, 2008, 49, 4475–4488 CrossRef PubMed.
- D. E. Discher and A. Eisenberg, Science, 2002, 297, 967–973 CrossRef CAS PubMed.
- J. Chen and A. C. Taylor, J. Mater. Sci., 2012, 47, 4546–4560 CrossRef CAS.
- J. N. Israelachvili, Intramolecular and Surface Forces, Academic Press, 2011 Search PubMed.
- H. Lü and S. Zheng, Polymer, 2003, 44, 4689–4698 CrossRef.
- P. M. Lipic, F. S. Bates and M. A. Hillmyer, J. Am. Chem. Soc., 1998, 7863, 8963–8970 CrossRef.
- M. A. Hillmyer, P. M. Lipic, D. A. Hajduk, K. Almdal and F. S. Bates, J. Am. Chem. Soc., 1997, 7863, 2749–2750 CrossRef.
- R. B. Grubbs, J. M. Dean, M. E. Broz and F. S. Bates, Macromolecules, 2000, 33, 9522–9534 CrossRef CAS.
- G. Van Assche, A. Van Hemelrijck, H. Rahier and B. Van Mele, Thermochim. Acta, 1995, 268, 121–142 CrossRef.
- M. Lu and S. Kim, J. Appl. Polym. Sci., 1999, 71, 2401–2408 CrossRef CAS.
- S. Swier, G. Van Assche and B. Van Mele, J. Appl. Polym. Sci., 2003, 91, 2814–2833 CrossRef PubMed.
- C. J. Gommes and B. Goderis, J. Appl. Crystallogr., 2010, 43, 352–355 CAS.
- D. Montezinos, B. G. Wells and J. L. Burns, J. Polym. Sci., Part C: Polym. Lett., 1985, 23, 421–425 CrossRef CAS PubMed.
- J. S. Trent, J. I. Scheinbeim and P. R. Couchman, Macromolecules, 1983, 16, 589–598 CrossRef CAS.
- M. R. Kamal, Polym. Eng. Sci., 1974, 14, 231–239 Search PubMed.
- J. I. M. Gonis, G. P. Simon and W. D. Cook, J. Appl. Polym. Sci., 1999, 72, 1479–1488 CrossRef CAS.
- Z. Man, J. L. Stanford and B. K. Dutta, J. Appl. Polym. Sci., 2009, 112, 2391–2400 CrossRef CAS PubMed.
- A. G. Marangoni and S. E. Mcgauley, Cryst. Growth Des., 2003, 3, 95–108 CAS.
- J. Mark, Polymer data Handbook, Oxford University Press, 1999 Search PubMed.
- P. Swan, J. Polym. Sci., 1960, 42, 525–534 CrossRef CAS PubMed.
- L. Li, F. Meng, Z. Zhong, D. Byelov, W. H. De Jeu and J. Feijen, J. Chem. Phys., 2007, 126, 024904 CrossRef PubMed.
- K. Pang and J. Gillham, J. Appl. Polym. Sci., 1989, 37, 1969–1991 CrossRef CAS PubMed.
- A. Izumi, T. Nakao, H. Iwase and M. Shibayama, Soft Matter, 2012, 8, 8438 RSC.
- J. S. Pedersen, Adv. Colloid Interface Sci., 1997, 70, 171–210 CrossRef CAS.
- B. Goderis, J. A. Putseys, J. Gommes, G. M. Bosmans and J. A. Delcour, Cryst. Growth Des., 2014, 14, 3221–3233 CAS.
| This journal is © The Royal Society of Chemistry 2015 |

