 Open Access Article
Creative Commons Attribution 3.0 Unported Licence
In situ laser-imprinted surface realignment of a nematic liquid crystal†
Giorgio
Mirri
*a,
Miha
Škarabot
a and
Igor
Muševič
ab
aCondensed Matter Physics Department, Jožef Stefan Institute, Jamova 39, 1000 Ljubljana, Slovenia. E-mail: giorgio.mirri@ijs.si; igor.musevic@ijs.si
bFaculty of Mathematics and Physics, University of Ljubljana, Jadranska 19, 1000 Ljubljana, Slovenia
First published on 5th March 2015
Abstract
We present a new method for the in-plane realignment of nematic liquid crystals in already fully assembled cells with uni-directionally rubbed polyimide as an aligning layer. We use nematic liquid crystals (NLCs) with a relatively high nematic–isotropic transition temperature and we focus the IR laser beam of the laser tweezers selectively onto one or the other of the inner interfaces. The heat generated by the IR absorption locally melts the liquid crystal and creates an isotropic island with well-defined molecular anchoring at the nematic–isotropic interface. By scanning the laser beam along a pre-defined line, the moving isotropic–nematic interface leaves behind a well oriented LC domain, with LC molecules aligned at 45° to the rubbing direction. If we in addition move the sample with respect to this scanning line, we would be able to selectively realign micro-domains of the liquid crystal with respect to the original alignment induced by the PI rubbing. The realignment can be performed independently on each LC–glass interface, thereby producing predefined domains with customized and controllable alignment within an otherwise uniformly aligned cell.
Introduction
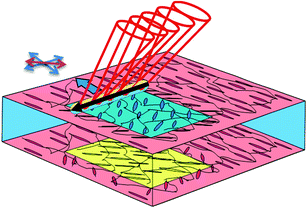
Unidirectional planar alignment of liquid crystals plays a fundamental role in liquid crystal display (LCD) technological applications. The most common way to achieve unidirectional alignment is by rubbing a polymer film on a glass with a velvet or cotton cloth.1 In this case, the alignment mechanism2,3 involves the formation of micro-grooves on the polymer surface,2 accompanied by unidirectional stretching of the polymer backbones due to the rubbing process.3 Recently the effect of the grooves on the alignment of the liquid crystal molecules was revised taking into account the azimuthal anchoring strength4,5 and the chemical interaction between the liquid crystal medium and the surface.6 Alternative methods have been developed in order to generate patterns of domains with different orientational order with respect to the surrounding. The atomic force microscope (AFM) has been used for this purpose7 where the nanometre-sharp AFM tip is scanned in contact with the surface producing nano-grooves and deformation of the polymer chains. Consequently the LC molecules align along the scanning direction of the tip. These domains can be rewritten and they preserve the direction of the last scan.8,9 Because AFM might be impractical for large area patterning, other methods were developed, such as photolithography, to generate master masks that can be used to imprint specific patterns onto the aligning photo-active polymer film,10 while laser induced micro-patterning was used to generate pattern domains onto polyimide (PI) films.11 Furthermore, self-assembling systems were used to obtain uniform alignment in rubbing-free processes.12In situ methods have also been developed, such as photo-switchable polymer aligning coatings, e.g. diazobenzene moieties.13–16 These compounds undergo a reversible molecular isomerization when irradiated with light at a specific wavelength, and a specific direction is chosen by using polarised light. Domains can be obtained by means of masks, which on the other hand, require a photolithographic preparation. All described methods give the possibility of patterning liquid crystal cells on a μm-scale. However, the main limitation resides in the difficulties to obtain selective reorientation of the two glass slides at a specific point in the cell in order to obtain a micro-domain with customized orientation in the bulk cell. In particular, the methods that allow the patterning of each of the two aligning layers before the cell is assembled will require a sophisticated assembly process in order to precisely superimpose two realigned areas on the two glasses for the formation of micro-domains. On the other hand, the in situ photoisomerisation of diazabenzene polymers will give rise to equal isomerisation on both glasses. Alignment of LCs can be also achieved by the surface memory effect (SME), where the anisotropization of isotropic surfaces can be obtained by contact with anisotropic moieties. It was first observed by Friedel on isotropic surfaces which were in contact with anisotropic crystals.17 In the 1980s Clark reported the SME caused by smectic LCs.18 The effect was then characterized by Ouchi on unrubbed polymers,19 and by Myrvold on rubbed PI layers.20 It was proven that this effect is largely enhanced by the hydrophobicity of the surface, due to a partial solubility of the polymer layer by the LC.Our idea is to modify the surface orientation of a liquid crystal in a controlled and customized way, by local application of a focused laser beam, as shown in Fig. 1. This beam dissipates power upon absorption and can locally melt the liquid crystal into the isotropic phase. The molecules at this laser-created interface have a well-defined orientation, which might be locally and permanently imprinted and can overwrite surface rubbing anchoring.
Controllable and focused laser beams have been proven to be a powerful tool in the liquid crystal field. Focused beams of laser tweezers were used for localized colloidal manipulation and one-by-one construction of 2D21,22 and 3D23 colloidal structures in nematic LCs. In more complex chiral nematic colloidal assemblies, tweezers were used to locally manipulate, cut, join and knit the nematic defect lines around the colloidal particles.24 Moreover, laser tweezers were used to selectively and unidirectionally reorient the bistable liquid crystal structure from homeotropic to planar.25 The flexibility of this tool in terms of programmability of the movement of the laser and control over the power and direction is the fundamental characteristic that we need for our purpose.
Results and discussions
Materials and methods
We used the liquid crystal MLC 2132 (Merck, Southampton, UK) which has a nematic–isotropic transition temperature of 114 °C. The refractive indices of MLC 2132 are no = 1.51 and ne = 1.77. The LC was introduced by capillary force into cells of different thicknesses (from 10 to 50 μm), which were assembled by gluing together two glass slides, each of them having a thin layer of indium-tin-oxide (ITO), covered by a thin layer of spin-coated polyimide (PI-2555, NISSAN Chemicals). The two glasses were separated by a suitable spacer. Prior to cell assembly, the PI layer was rubbed to obtain good macroscopic unidirectional alignment. Surface modification was obtained by local heating of the LC using laser tweezers built around an inverted optical microscope with a Nd-YAG laser (1064 nm) that was controlled with an AOD system (see the ESI†). The laser tweezers were programmed to iteratively move the laser focus in one direction along a straight line,26 with the frequencies of 500 to 700 Hz.Effect of the laser on the alignment of liquid crystal molecules
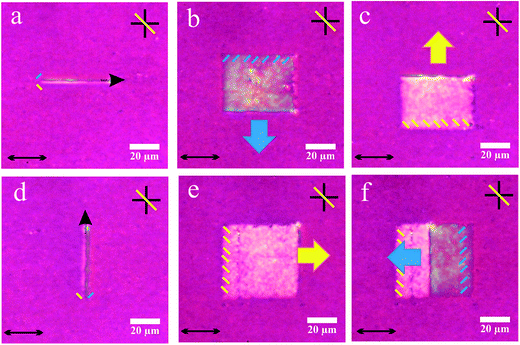
For a better understanding of the method we should first describe the effect of the laser on the LC and on the polymer. The power of the laser was adjusted in a way that the heat generated by absorption of IR light on only one of the two ITO layers was sufficient to locally melt the liquid crystal, giving rise to a thin isotropic island, as shown in Fig. 2a, which does not extend from one plate to the other. This can be achieved in a cell with a thickness down to 5 μm. At the nematic–isotropic (N–I) interface LC molecules are oriented planarly; this can be assessed by using a full-wave retardation plate.9,27 In Fig. 2a, bluish and yellowish regions (for an explanation on the origin of these colours please refer to the ESI†) of the NLC close to the circumference of the isotropic island clearly indicate planar alignment of the LC molecules at the nematic–isotropic interface.28 When the laser is moved fast along a line the alignment of the LC molecules follows the tailing part of the nematic droplet as clearly visible in Fig. 2b, where the laser is moving from bottom to top; therefore the alignment on the two sides of the line corresponds to the alignment of the bottom part of the isotropic island in Fig. 2a. When the laser is turned off we notice that the alignment is imprinted on the polymer layer as shown in Fig. 2c; this happens when the laser is kept moving along the line for a few seconds.The “tailing” side of the moving island therefore imprints the molecular orientation, which is present at that interface. Now, having demonstrated the effect of the laser on the liquid crystal medium and on the polymer layer we want to assess if the realignment can be performed to larger areas of the PI layer in a controlled fashion. First we move the sample perpendicular to the laser line (Fig. 3) by moving the optical stage. It is clear that such moving of the laser line creates reorientation of LC molecules in the direction, which is determined by the “tailing” side of the moving line. In the experiment it is observed as the fact that always the back or the tail part of the line determines the observed colour of the realigned area. This is true for parallel (Fig. 3a–c) and perpendicular (Fig. 3d–f) orientations of the laser line with respect to the rubbing direction. The realignment is stable, but can be always reversed by scanning the imprinted area in the opposite direction as shown in Fig. 3f.
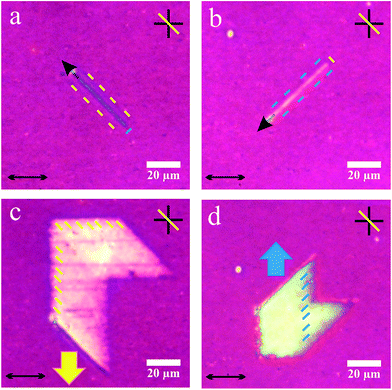
In the second experiment the fast movement of the laser was oriented along a line at 45° with respect to the rubbing direction and the slow scanning was again performed parallel or perpendicular to the original rubbing direction (Fig. 4). Here the line in Fig. 4a appears mostly blue with yellowish side bands, whereas the perpendicular line in Fig. 4b appears mostly yellowish with bluish edges. Now, when the slow-axis scanning is turned-on, as shown in Fig. 4c and d, the imprinted regions appear yellowish (Fig. 4c) or bluish (Fig. 4d).
The LC reorientation is similar to the previous case, since it always follows the orientation around the tailing part of the isotropic island with respect to the slow movement of the line on the surface. Here the realignment is parallel to the laser line.
The main feature of this method is that the realignment can be carried out independently on each surface of the cell by just changing the focus of the laser. The only requirement is that the cell be thick enough in order to allow the creation of the isotropic island on one surface only, without extending over the whole thickness of the cell. When both surfaces are laser-realigned with a fast scanning axis at ±45° with respect to the rubbing direction in a planar cell, one can obtain 90° twisted nematic (TN) or planar LC pixels, as shown in Fig. 5. One can clearly see a checkboard pattern of micro-sized pixels with alternating twisted and parallel orientation, all with a different orientation with respect to the original rubbing direction, as indicated by the blue and orange double headed arrows in Fig. 5b. The intersections between parallel oriented areas are actually parallel cells; therefore they appear black under crossed conditions with the polariser parallel and the analyser perpendicular to the nematic director (black squares in Fig. 5b). Intersections of two perpendicularly oriented areas on the two glasses are in any aspect similar to twisted cells (white squares in Fig. 5b). Fig. 5c shows the pattern under parallel analyser and polariser 45° with respect to the original rubbing direction. In this case twisted cells appear black and parallel cells appear white.
AFM study of the polymer surface
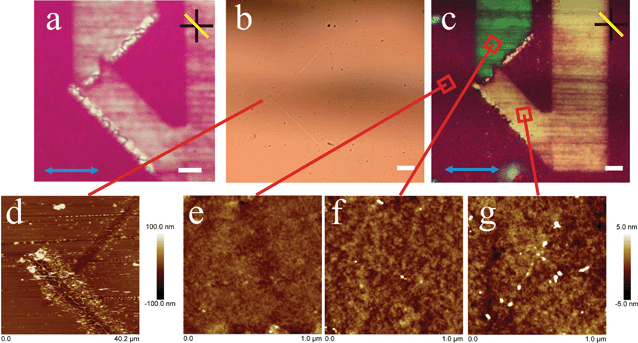
Next we study the effect of the imprinting process on the polymer layer. We imprint a new realignment with a recognisable pattern on the surface as shown in Fig. 6a. At the end of each realigning process we keep the line in the same position for at least 5 seconds; the laser is then turned off leaving the two marks in a way resembling the symbol <. We then open the cell and wash out the liquid crystal. Using an optical microscope we can only observe the two lines on the positions where the laser is left scanning for a longer time (Fig. 6b). To check the memory effect on the polymer layer, we place a small droplet of a nematic LC on the same spot and the LC is covered with a thin glass cover slip. The LC preserves the new imprinted orientation (Fig. 6c) that is a clear evidence of the permanent realignment of the PI layer. Finally, after again having washed the LC out of the surface, we check the effect of the laser induced polymer modification using atomic force microscopy (AFM). We can clearly observe the burned polymer at the two positions observed already with an optical microscope (Fig. 6d), but we cannot observe any reorientation of the polymer, which probably occurs at a molecular scale and cannot be observed on a relatively rough polymer surface. The only measurable effect is the increase of surface roughness due to the imprinting process. In particular, the realigned areas have been estimated to have a roughness parameter Rq ≈ 0.9 ± 0.1 (Fig. 6f and g) whereas the roughness of the non-scanned area is smaller, Rq ≈ 0.6 ± 0.1 (Fig. 6e). This result is important for future technological application of this methodology.Thermal stability of the realignment and surface memory effect (SME)
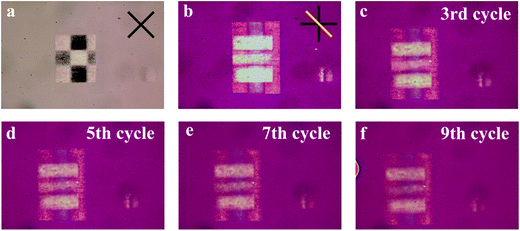
The stability of the imprinting process is also confirmed by heating up the sample above the transition temperature (114 °C for MLC 2132). We observe that the realignment is completely recovered when the LC is cooled back down to the nematic phase. Fig. 7 shows images of such heating and cooling cycles where laser induced realignment is completely preserved. It is worth noting that the isotropic phase starts in droplets on the non-imprinted area (Fig. 7, first panel heating row) but covers completely the realigned area on the glass nearer to the heater (Fig. 7, second panel heating row). This is due to the increased wettability of the isotropic LC in the realigned area compared to the non-imprinted one, caused most probably by the modification of the surface of the polymer layer on the molecular scale.The imprinted realignment can be decreased only by several repetition of heating–cooling cycles to temperatures 30–40 °C higher than the clearing temperature of the liquid crystalline medium as shown in Fig. 8.
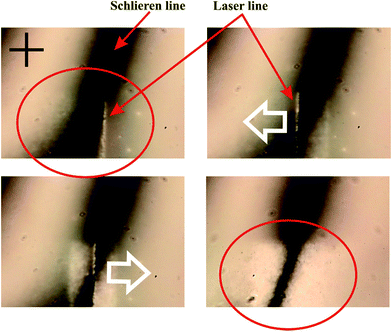
The temperature stability of laser induced realignment is a clear evidence that reorientation of LC molecules induce realignment of the polymer surface. This surface memory effect can be also observed in cells without a PI layer as shown in Fig. 9. In the absence of aligning agents the LC has a degenerated planar alignment, i.e. the molecules lie parallel to the surface without a preferential azimuthal direction. Under crossed polariser conditions the texture is characterised by the presence of black stripes (schlieren texture) that correspond to areas where the LC molecules are aligned with one of the polarisers. By focussing the laser line on one of the surfaces and moving it in a different direction we observe a change in the alignment of the LC, which is evidenced by the narrowing of the schlieren texture as clearly visible in the two ellipses in the first and in the last panels of Fig. 9. The only difference from the effect obtained in uni-directionally rubbed cells is that in the case of degenerated planar realignment we lose control over the direction of the realignment, since the initial planar distribution around the isotropic island is linked to the uniform director of the LC.
This is the demonstration that this method represents, to the best of our knowledge, the first example of direct control of the SME of the liquid crystal, on rubbed PI, in all its aspects; direction of alignment, size and shape of the realigned domains.
Flexibility of the method
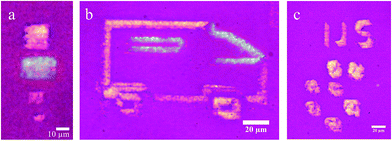
With this LC system the smallest pixel size obtainable is about 10 × 10 μm. In fact, under the presented experimental conditions, using lines shorter than 10 μm is indeed more difficult to obtain a uniformly realigned region as shown in Fig. 10a. At last we demonstrate the flexibility of this method. Fig. 10b and c show two “handmade” pictures obtained by moving the laser line with the length of 12.5 μm. These pictures demonstrate that the realignment process can be used to produce any kind of pattern. The drawings shown in Fig. 10 were manually prepared and their quality depends only on the skills of the operator. The quality could be improved by electronically controlling the movement of the sample to move along a programmed path.Conclusions
To summarise, we developed a new method that allows for the customised and selective in situ patterning of liquid crystal cells on a μm scale by controlling the SME of LC media on uni-directionally aligned polymer layers. The realignment is carried out by fast scanning of a focused IR laser beam along a line and by moving it across the sample. The realignment occurs solely by focussing the IR laser beam on one of the ITO glasses, where a strong absorption of light results in local increase of the temperature which causes localised melting of a liquid crystal. The realignment is imprinted by the tailing line of the nematic–isotropic interface and it is rather thermally stable, i.e. it is preserved after heating to the isotropic phase and cooling to the nematic phase. Moreover, AFM showed that the topography of the surface is only limitedly affected by the imprinting process. Compared to other methods this one has the advantage that it does not involve photolithographic processes and can be independently applied on each surface of the liquid crystal cell. In LCD manufacturing this method could be used to generate patterned micro-twisted pixels.Contribution of the authors
G.M. ideated and carried out the experiments in addition to drafting the manuscript. M.Š. carried out AFM imaging and roughness measurements and revised the manuscript. I.M. mentored G.M. and revised the manuscript.Acknowledgements
This research was supported by a Marie Curie Intra European Fellowship (Nemcode MC-PEOPLE-IEF-2012-331350) within the 7th European Community Framework Program. G.M. Would like to thank also Gregor Posnjak for his help in programming the laser.References
- J. Hoogboom, T. Rasing, A. E. Rowan and R. J. M. Nolte, J. Mater. Chem., 2006, 16, 1305–1314 RSC.
- D. W. Berreman, Phys. Rev. Lett., 1972, 28, 1683–1686 CrossRef CAS PubMed.
- J. M. Geary, J. W. Goodby, A. R. Kmetz and J. S. Patel, J. Appl. Phys., 1987, 62, 4100–4108 CrossRef CAS PubMed.
- J. Fukuda, M. Yoneya and H. Yokoyama, Phys. Rev. Lett., 2007, 98, 187803 CrossRef.
- J. Fukuda, J. S. Gwag, M. Yoneya and H. Yokoyama, Phys. Rev. E: Stat., Nonlinear, Soft Matter Phys., 2008, 77, 011702 CrossRef.
- L. Cattaneo, J. Zhang, M. Zuiddam, M. Savoini and T. Rasing, Nano Lett., 2014, 14, 3903–3907 CrossRef CAS PubMed.
- J. H. Kim, M. Yoneya and H. Yokoyama, Nature, 2002, 420, 159–162 CrossRef CAS PubMed.
- A. Rastegar, M. Skarabot, B. Blij and T. Rasing, J. Appl. Phys., 2001, 89, 960–964 CrossRef CAS PubMed.
- I. I. Smalyukh, R. Pratibha, N. V. Madhusudana and O. D. Lavrentovich, Eur. Phys. J. E, 2005, 16, 179–191 CrossRef CAS PubMed.
- J. Kim, Y. W. Lim, J. H. Na and S. D. Lee, Appl. Opt., 2013, 52, 1752–1757 CrossRef CAS PubMed.
- X. Li, X. M. Lu, Q. H. Lu and C. A. Ohlin, Jpn. J. Appl. Phys., Part 2, 2006, 45, L591–L594 CrossRef CAS.
- J. Hoogboom, J. A. A. W. Elemans, T. Rasing, A. E. Rowan and R. J. M. Nolte, Polym. Int., 2007, 56, 1186–1191 CrossRef CAS.
- W. M. Gibbons, P. J. Shannon, S. T. Sun and B. J. Swetlin, Nature, 1991, 351, 49–50 CrossRef CAS.
- P. Wolfer, K. Kreger, H.-W. Schmidt, N. Stingelin and P. Smith, Mol. Cryst. Liq. Cryst., 2012, 562, 133–140 CrossRef CAS.
- A. Martinez, H. C. Mireles and I. I. Smalyukh, Proc. Natl. Acad. Sci. U. S. A., 2011, 108, 20891–20896 CrossRef CAS PubMed.
- T. Seki, S. Nagano and M. Hara, Polymer, 2013, 54, 6053–6072 CrossRef CAS PubMed.
- G. Friedel, Ann. Phys., 1922, 18, 273 CAS.
- N. A. Clark, Phys. Rev. Lett., 1985, 55, 292–295 CrossRef CAS.
- Y. Ouchi, M. B. Feller, T. Moses and Y. R. Shen, Phys. Rev. Lett., 1992, 68, 3040–3043 CrossRef CAS.
- B. O. Myrvold, Liq. Cryst., 1995, 18, 287–290 CrossRef CAS.
- I. Muševič, M. Škarabot, U. Tkalec, M. Ravnik and S. Žumer, Science, 2006, 313, 954–958 CrossRef PubMed.
- G. Mirri, V. S. R. Jampani, G. Cordoyiannis, P. Umek, P. H. J. Kouwer and I. Muševič, Soft Matter, 2014, 5797–5803 RSC.
- A. Nych, U. Ognysta, M. Škarabot, M. Ravnik, S. Žumer and I. Muševič, Nat. Commun., 2013, 4, 1489 CrossRef CAS PubMed.
- U. Tkalec, M. Ravnik, S. Čopar, S. Žumer and I. Muševič, Science, 2011, 333, 62–65 CrossRef CAS PubMed.
- V. S. R. Jampani, M. Škarabot, H. Takezoe, I. Muševič and S. Dhara, Opt. Express, 2013, 21, 724–729 CrossRef CAS PubMed.
- The length of the linear segment can change depending on the working distance of the objective. In some cases the segment was rescaled keeping constant the number of steps. For the actual length in each experiment refer to the scale bars.
- U. Tkalec, M. Škarabot and I. Muševič, Soft Matter, 2008, 4, 2402–2409 RSC.
- M. Škarabot, Ž. Lokar and I. Muševič, Phys. Rev. E: Stat., Nonlinear, Soft Matter Phys., 2013, 87, 062501 CrossRef.
Footnote |
| † Electronic supplementary information (ESI) available. See DOI: 10.1039/c5sm00282f |
| This journal is © The Royal Society of Chemistry 2015 |

