
 Open Access Article
 This Open Access Article is licensed under a Creative Commons Attribution-Non Commercial 3.0 Unported Licence
Real-time detection of histone deacetylase activity with a small molecule fluorescent and spectrophotometric probe†
Debra R.
Rooker
 and
Daniela
Buccella
*
and
Daniela
Buccella
*
Department of Chemistry, New York University, New York, New York 10003, USA. E-mail: dbuccella@nyu.edu
First published on 3rd August 2015
Abstract
Histone deacetylases (HDACs) are central players in transcription regulation and important targets in cancer treatment. Activity assays are critical tools for the study of the function and regulation of these enzymes, as well as for the screening of potential inhibitors. We report a small-molecule probe for single-step, continuous detection of deacetylase activity based on an acetyl-lysine mimic functionalized with an amine-reactive fluorophore, designed to undergo rapid intramolecular imine formation upon deacetylation. The probe exhibits a bathochromic shift in the absorption spectrum and changes in fluorescence emission intensity that enable unprecedented real-time detection of HDAC activity of purified enzymes or in cell lysates, and offers a means to evaluate HDAC inhibitors via simple spectrophotometric or fluorescence readings without the need of additional reagents.
Introduction
Post-translational modifications are often exploited by nature to regulate a variety of protein functions in biological systems. Acetylation of the ε-amino group of lysine residues in the histone proteins induces changes in chromatin structure that are predominantly associated with activation of DNA transcription and replication,1 and is one of the most prominent epigenetic mechanisms influencing human carcinogenesis.2 Acetylation levels are maintained by the opposing action of two families of enzymes, the histone acetyltransferases (HAT, responsible for lysine acetylation) and the histone deacetylases (HDAC, responsible for acetyl removal). Up-regulation of HDACs has been associated with the silencing of tumor-suppressing genes, which are responsible for controlling cell proliferation, differentiation and apoptosis.3 Consequently, HDAC inhibition has emerged as a promising strategy for cancer treatment.Activity assays are a critical tool in the study of the mechanism, biological function and regulation of enzymatic deacetylation as well as in the evaluation of HDAC-targeting inhibitors with potential therapeutic value. In early studies, deacetylase activity was estimated through the detection of [3H]acetate product from the hydrolysis of isotopically-labeled acetylated histones4 or by immunoblotting.5 Only a limited number of non-isotopic activity assays, primarily based on the use of fluorescent substrates, have been developed to date.6–10 For example, a method developed by Jung and coworkers uses an acetyl-lysine functionalized with a fluorescent coumarin to quantitate deacetylation after extraction and chromatographic analysis of the product mixture.6,11 Alternative fluorogenic assays developed in the last decade exploit fluorophore-decorated acetylated peptides that, after deacetylation, are subjected to protease degradation leading to fluorophore release and fluorescence activation.7,12,13 The latter approach constitutes the basis of various commercially available activity assay kits. Nevertheless, the multistep nature of these assays, which require a separation or ‘fluorescence-developing’ step prior to sample analysis, limits the use of the probes to the assessment of activity in vitro in a discontinuous fashion.
More recently, a series of fluorogenic substrates amenable for single-step detection of deacetylase activity were reported by Kikuchi and coworkers.9,14 The peptide substrates undergo spontaneous intramolecular transesterification upon deacetylation of a lysine residue, giving rise to a fluorescence signal. The key transesterification step, however, is slow and dominates the kinetics of the fluorescence response. Under these conditions, the prospects of real-time observation of deacetylation are still limited. In this context, we report herein the design of a new small-molecule probe that serves as both HDAC substrate and optical reporter, offering a rapid response that enables the detection of enzymatic deacetylation in real time via spectrophotometric or fluorometric measurements. With this new probe, we demonstrate continuous detection of deacetylase activity of purified enzymes and in cell lysates, without additional reagents, which offers a convenient method for evaluation of HDAC inhibitors via simple optical readings.
Results and discussion
We envisioned a small-molecule deacetylase activity probe consisting of an acetyl-lysine mimic functionalized with an amine-reactive coumarin fluorophore, designed to undergo rapid intramolecular imine formation that ensued optical changes upon enzymatic deacetylation (Fig. 1). Based on crystal structures of inhibitor-bound HDACs15,16 and insight from design of HDAC inhibitors,17 we chose to introduce an aromatic moiety as part of the linker between the reporter and reactive moieties of the probe, to aid its interaction with residues surrounding the catalytic pocket of the enzymes.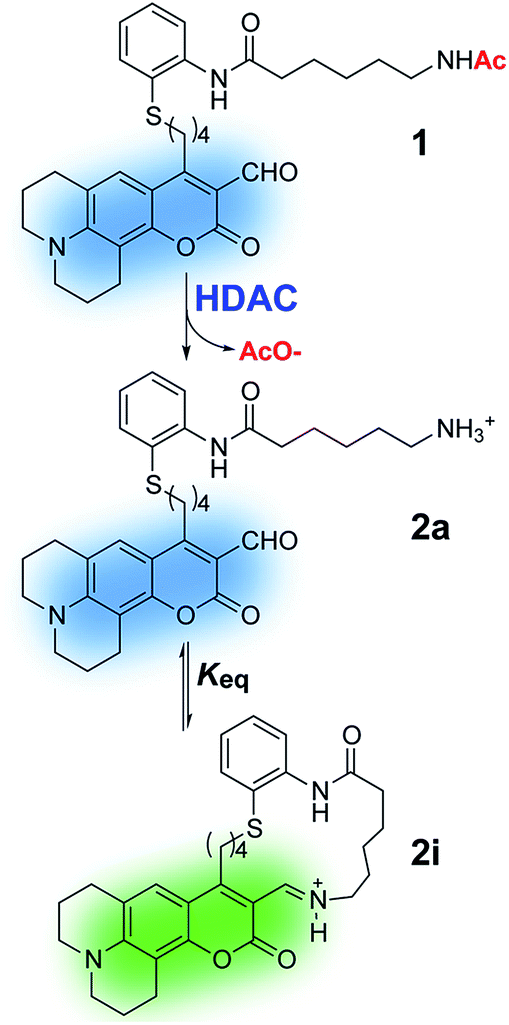 | ||
| Fig. 1 Probe for single-step spectrophotometric and fluorescence-based detection of HDAC activity. | ||
Probe 1 was prepared following the protocol depicted in Scheme 1. Amine-reactive 4-chloro-3-formylcoumarin 4 was treated with an appropriate alkyl cuprate yielding tert-butyldimethylsilyl (TBS) ether 5. Following deprotection under acidic conditions, the alcohol was mesylated and converted to alkyliodide 6.18 Final probe 1 was obtained via reductive alkylation19 of aryldisulfide 7a bearing an amide of 6-acetamidohexanoic as an acetyl lysine mimic. A similar synthetic route was employed to prepare Boc-protected analogue 3a, which provides convenient access to the product of deacetylation (compound 2a, Fig. 1) via chemical deprotection.
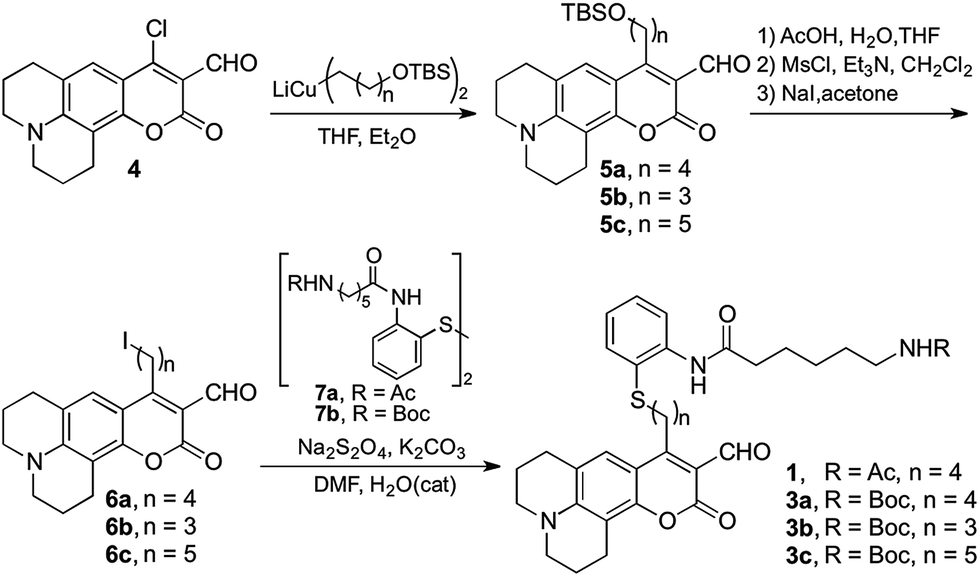 | ||
| Scheme 1 Synthetic route to HDAC activity probe and acid-cleavable Boc-protected analogues. | ||
With probe in hand, we focused our initial studies on the intramolecular imine formation step. Boc-protected compound 3a was deprotected quantitatively with trifluoroacetic acid and the product amine was diluted and allowed to equilibrate in aqueous buffer at pH 8.0 and 37 °C. A bathochromic shift from 471 nm to 499 nm was observed in the absorption spectrum upon equilibration, consistent with the formation of an imine product (Fig. 2A and Table 1 and S1, ESI†). In this regard, Glass and coworkers have reported similar spectroscopic changes induced by the intermolecular formation of imines between 7-diethylamino-3-formyl-coumarins and amino acids20,21 or catecholamine neurotransmitters.18,22 On the basis of NMR and optical spectroscopic studies, it has been suggested that the s-trans conformation of the imine favors its protonation and intramolecular hydrogen bonding with the coumarin carbonyl,20 leading to a red shift in the absorption maximum.
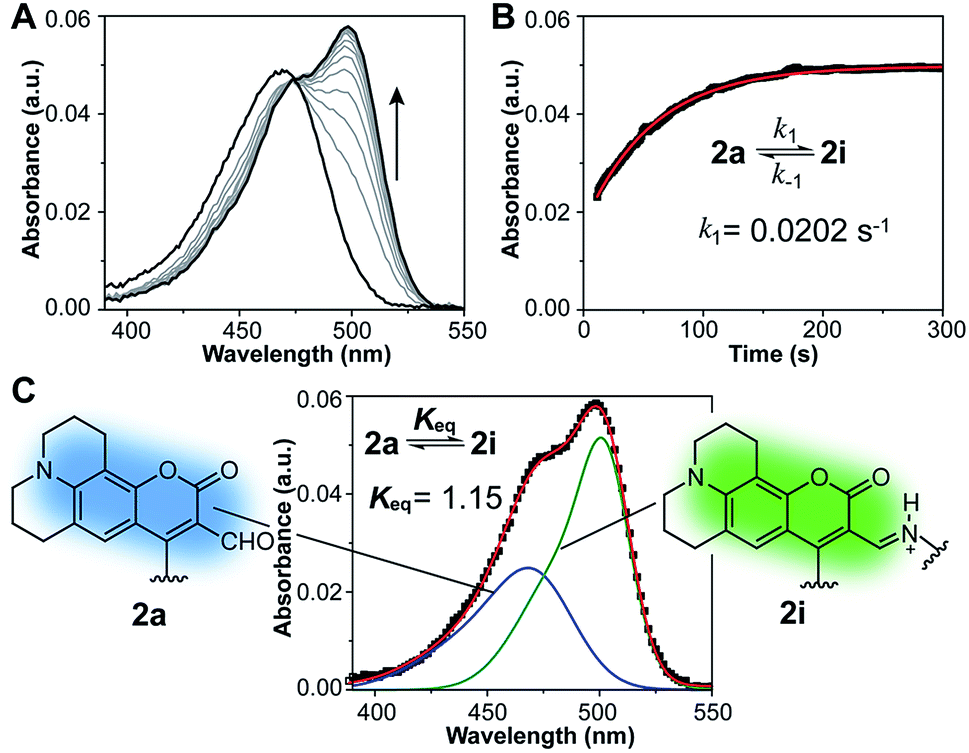 | ||
| Fig. 2 Spectroscopic changes observed upon intramolecular imine formation from 2a in aqueous buffer at pH 8.0 and 37 °C. (A) Absorption spectra during equilibration of a ∼1.5 μM solution of amine 2a. (B) Absorbance at 499 nm over time (black squares) fitted to an integrated rate law for a reversible first order reaction (approach to equilibrium, red line). (C) Deconvolution of the absorption spectrum (black squares) of equilibrated sample showing individual contributions of the aldehyde (blue line) and imine (green line) to the overall absorption. | ||
| Compound | ε 471 (× 103 M−1 cm−1) | ε 499 (× 103 M−1 cm−1) | Φ 499 |
|---|---|---|---|
| a Values determined from measurements in 50 mM HEPES, 100 mM KCl, pH 8.0 at 37 °C. Errors in the last significant figure indicated in parenthesis. b Deacetylated product obtained from acid deprotection of compound 3a. c Fluorescein in 0.1 N NaOH (Φ492 = 0.95) used as standard. | |||
| Probe 1 | 23.4 (7) | 6.0 (2) | 0.53 (4) |
| Equilibrated mixture of 2a and 2i | 22.6 (9) | 28 (1) | 0.21 (3) |
In addition to the observed changes in absorption, compound 2a exhibited changes in fluorescence emission intensity upon imine formation (Fig. S2†). An increase in emission was observed upon excitation at 499 nm, whereas a modest decrease resulted upon excitation at 477 nm (isosbestic point). Measurements of the quantum efficiency of the equilibrated sample indicate that the mixture of amine and imine products 2a and 2i is overall less emissive than the parent acetylated probe (Table 1). This difference could be explained by a possible quenching effect of the free amine to the coumarin fluorophore in 2a, leading to its lower contribution to the emission.
The absorption spectra were employed to estimate the equilibrium constant for the intramolecular imine formation leading to macrocycle 2i. The spectrum of an equilibrated mixture of 2a and 2i was deconvoluted as a sum of Gaussian functions (Fig. 2C and S3†) representing the individual contributions of the aldehyde and imine to the overall absorption. In this process, the spectrum of aldehyde 2a was assumed to be identical to that of the acetylated probe 1 measured independently. Derivatives with linkers of various lengths between the fluorophore and the lysine mimic, i.e. compounds 3b and 3c, were prepared and evaluated in order to assess the optimal length of the tether for intramolecular imine formation (Fig. S1†). The equilibrium mixture of the deacetylated product 2a, with a four-carbon alkyl linker, showed the largest fraction of imine in solution (Keq = 1.15 ± 0.04) and the largest optical change compared to analogues with shorter and longer linkers (Keq = 0.77 ± 0.07 and 0.51 ± 0.02 for the equilibrium mixture obtained after deprotection of 3b and 3c, respectively).
Kinetics of the reversible imine formation step were studied via pH jump experiments, starting from pure amine samples obtained by quantitative cleavage of the Boc-protected compounds 3a–c. Forward and reverse rate constants (Table S2†) were determined from a nonlinear fit of the absorption at 499 nm as a function of time (Fig. 2B and S4†). In all cases, equilibrium was reached within a few minutes, with forward rate constants, k1, ranging between 0.0071 and 0.0202 s−1 for the three derivatives. Among these, the species with a four-carbon alkyl linker between fluorophore and lysine mimic displayed the fastest equilibration. The advantageous kinetics combined with favorable thermodynamics for imine formation in this model compound led us to choose acetylated probe 1 as our best candidate for the development of a deacetylation assay.
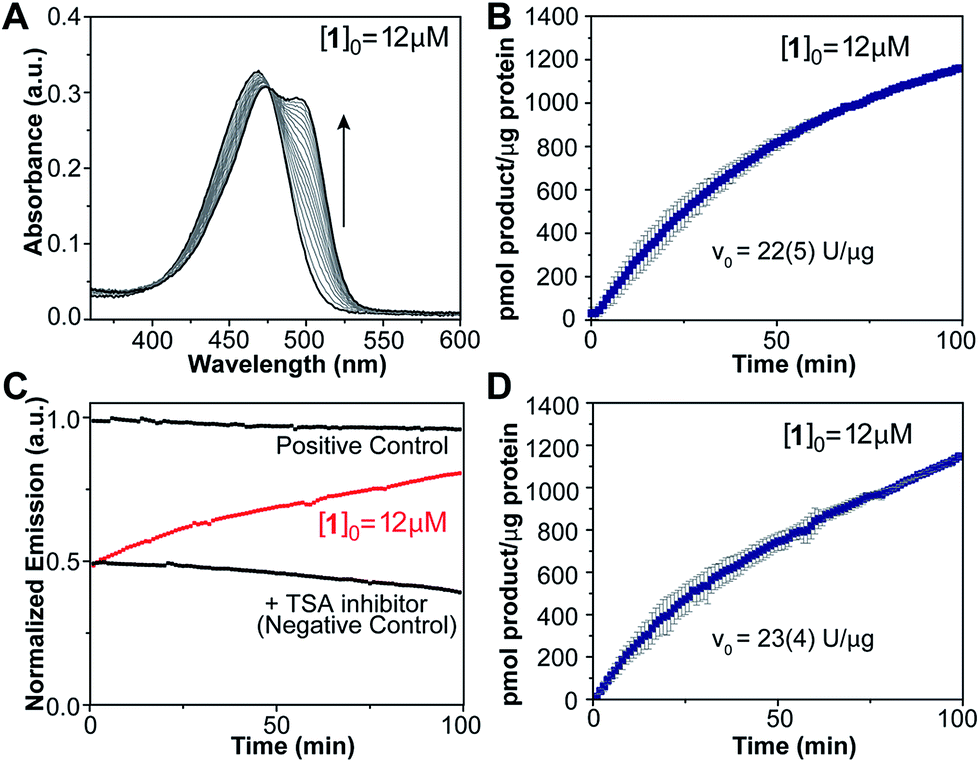
The marked optical changes and rapid equilibration of the probe after amine deprotection suggested that our design would enable continuous, real-time detection of enzymatic deacetylation by spectroscopic methods without the need for chemical extraction of the product or the addition of developing reagents typically used in commercial assays. To test this notion, compound 1 was used as a substrate for human recombinant HDAC3 in a 1![[thin space (1/6-em)]](https://www.rsc.org/images/entities/char_2009.gif) :1 stoichiometry complex with the deacetylase activation domain of NCOR1.23 An aliquot of enzyme complex was diluted in HEPES buffer at pH 8.0 and 37 °C, and treated with 12 μM of the probe. Product formation was observed over time (Fig. 3A) as revealed by the appearance of the absorption band centered at 499 nm corresponding to the coumarin imine. A negative control was conducted by treating the enzyme with 1.2 μM of a reversible HDAC inhibitor, trichostatin A (TSA), prior to addition of the probe. For this fully inhibited sample, no significant changes were observed in the absorption spectrum over time. A similar sample treated with chemically deacetylated probe 2a was employed as positive control. Absorption values at 499 nm obtained from negative and positive control experiments were employed to estimate the signal corresponding to zero and 100% conversion levels, respectively, and to calibrate the optical response of the probe over time (Fig. 3B). A 74% probe conversion was achieved over 100 min,24 with an initial velocity of 22 U μg−1 of protein.
:1 stoichiometry complex with the deacetylase activation domain of NCOR1.23 An aliquot of enzyme complex was diluted in HEPES buffer at pH 8.0 and 37 °C, and treated with 12 μM of the probe. Product formation was observed over time (Fig. 3A) as revealed by the appearance of the absorption band centered at 499 nm corresponding to the coumarin imine. A negative control was conducted by treating the enzyme with 1.2 μM of a reversible HDAC inhibitor, trichostatin A (TSA), prior to addition of the probe. For this fully inhibited sample, no significant changes were observed in the absorption spectrum over time. A similar sample treated with chemically deacetylated probe 2a was employed as positive control. Absorption values at 499 nm obtained from negative and positive control experiments were employed to estimate the signal corresponding to zero and 100% conversion levels, respectively, and to calibrate the optical response of the probe over time (Fig. 3B). A 74% probe conversion was achieved over 100 min,24 with an initial velocity of 22 U μg−1 of protein.
 | ||
| Fig. 3 Deacetylation of probe 1 in a sample of HDAC3/NCOR1 complex (100 nM enzyme) at pH 8.0 and 37 °C. (A) Absorption spectrum over time. (B) Product formation over time, calculated from changes in absorption at 499 nm. (C) Change in fluorescence emission (λEx = 499 nm, λEm = 523 nm) for probe 1 (red) and corresponding negative and positive controls (black). (D) Product formation over time calculated from changes in emission intensity. Reported activity values were estimated from the slope of the curve in the first 10 minutes. | ||
The applicability of probe 1 as a deacetylase activity probe was further demonstrated using fluorescence emission measurements. Over the course of the reaction catalyzed by HDAC3/NCOR1, deacetylated product formation was detected by the change in emission intensity at 523 nm upon excitation at 499 nm (Fig. 3C). Positive and negative control experiments were conducted in the same fashion as for the absorption-based assays, and product formation over time was calibrated based on the signal obtained from these experiments. A slow decline in emission intensity was observed for both controls over time, presumably as a result of some photobleaching caused by prolonged exposure to the excitation light source. The reaction progress curve obtained from the fluorescence experiment (Fig. 3D) resembles those obtained from the absorption spectroscopy experiments, revealing 73% conversion in 100 min and similar initial velocity. Overall, these results indicate that changes in optical properties of our probe enable the real-time detection of enzyme activity, with good Z′ values of 0.88 for absorption and 0.82 for fluorescence detection methods (Table S3†).25
To explore the isoform specificity of the probe, we conducted spectrophotometric measurements in the presence of representative examples of other classes of deacetylases, namely HDAC6 (Class IIa) and Sirt1 (Class III) in addition to HDAC3 (Class I). The probe was rapidly converted in the presence of HDAC6, but no significant conversion was detected with up to 100 nM Sirt1 and 0.3 mM NAD+ under the typical conditions of our experiments (Fig. S5 and S6†).
An important application of activity assays is the evaluation of inhibitors as potential drug candidates for HDAC-targeting therapeutics. To evaluate the performance of our probe, we constructed dose response curves for the inhibition of HDAC3/NCOR1 by valproic acid, a drug used in the treatment of seizures and bipolar disorders, which has been shown to target histone deacetylases26 (Fig. 4). Samples of enzyme equilibrated with the desired concentrations of the drug were incubated with probe 1 and deactivated by heat shock at 95 °C after 3.5 hours. An EC50 value in the sub-millimolar range was estimated from either absorption or fluorescence measurements, which is within the range of IC50 values reported for HDAC3.27,28
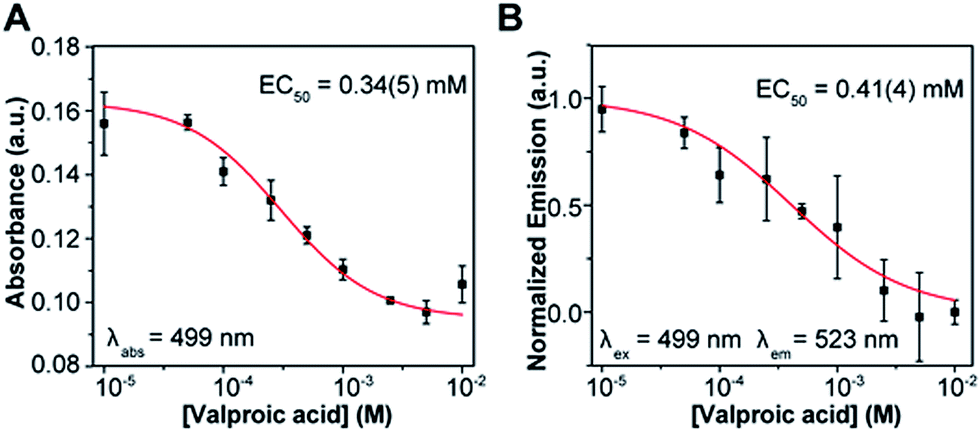 | ||
| Fig. 4 Dose response curve for inhibition of 37 nM HDAC3/NCOR1 activity by valproic acid. (A) Curve constructed from absorption readings at 499 nm. (B) Data obtained from fluorescence readings (λex = 499 nm, λem = 523 nm). | ||
Finally, we sought to gauge the performance of our probe for the detection of deacetylase activity in cell lysates, in which the HDAC complexes are largely intact and should display closer to native activity. An aliquot of HeLa nuclear extract was diluted in HEPES buffer at pH 8.0 and 37 °C, and treated with the probe for a total concentration of 4 μM. Product formation was monitored over the course of 4 hours by measuring the increase in absorption at 510 nm (Fig. 5A),29 or fluorescence emission at 523 nm upon excitation at 499 nm (Fig. 5C). Positive and negative controls were conducted in the same fashion as those described for the experiments with purified proteins.
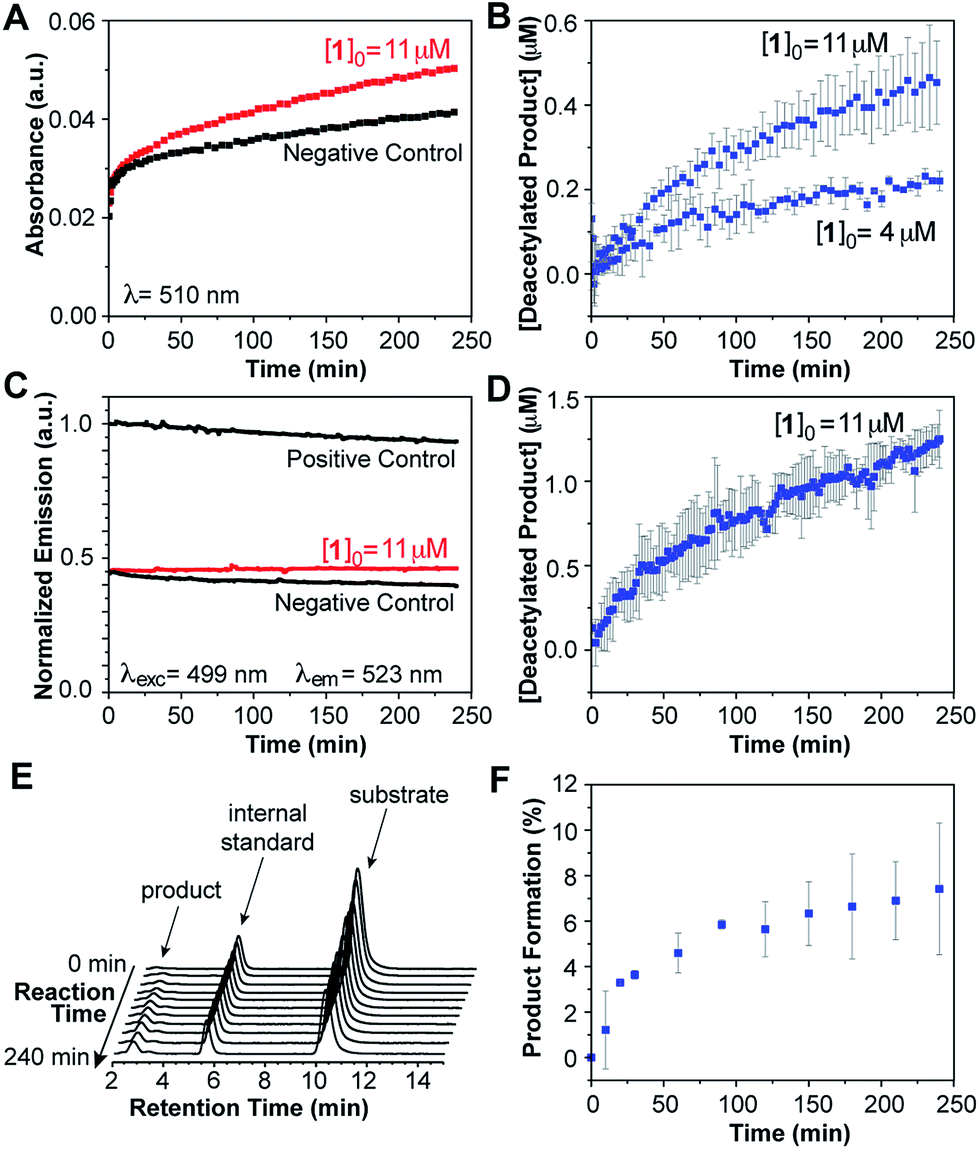 | ||
| Fig. 5 Deacetylation of probe 1 in diluted HeLa nuclear extract at pH 8.0 and 37 °C. (A) Change in absorption at 510 nm over time for probe 1 (red) and negative control (black). (B) Concentration of deacetylated product over time calculated from changes in absorption. (C) Change in fluorescence emission (λEx = 499 nm, λEm = 523 nm) for probe 1 (red) and corresponding negative and positive controls (black). (D) Concentration of deacetylated product over time calculated from changes in emission intensity. (E) HPLC chromatograms of a reaction mixture showing the appearance of deacetylated product (standard = coumarin 6H). (F) Product formation over time estimated by HPLC. | ||
For the fully HDAC-inhibited sample treated with TSA, a rapid increase in absorption was observed over the first 5 min of the experiment, followed by a slow, small increase over the course of hours. We attributed these changes to nonspecific binding of the probe to nucleophiles present in the cell extract, as confirmed by the absence of deacetylated product in the HPLC analysis of the sample. For comparison, an association constant K < 4 M−1 was determined for the intermolecular reaction of the probe with 6-aminohexanoic acid in aqueous buffer at pH 8.0 and 37 °C. In this regard, Hooker and coworkers have exploited the intermolecular reaction of an enzymatically-released aldehyde moiety with endogenous cellular nucleophiles as a means to increase the intracellular retention of a fluorescent HDAC probe.30
Subtraction of the signal caused by background reactions, as determined by the negative control, revealed the changes in absorption associated with the formation of the deacetylated product in our assay (Fig. 5B). Using the positive and negative controls to calibrate the optical signal, we estimated 5–10% product formation over 4 hours.31 Higher probe concentrations led to proportionally faster deacetylation, and similar conversion levels at the end of the run. However, limits in the solubility of the probe beyond ∼14 μM precluded studies at much higher concentrations. Future adjustments in the molecular design will be aimed at fine-tuning the properties of the probe to provide a wider working range of concentrations for kinetic studies.
Lastly, HPLC was employed to monitor the progress of the deacetylation of probe 1 in a sample of diluted HeLa extract (pH 8.0 and 37 °C), treated with coumarin 6H as an internal standard (Fig. 5E). Aliquots were taken at various time points over the course of 4 hours and mixed with equal volumes of acetonitrile to precipitate the protein component. Product concentration estimated from chromatographic analysis of the supernatant at various time points (Fig. 5F) matched the values calculated from the spectroscopic studies, thus indicating that the latter indeed reveal, in real time, the progress of the reaction through a faster and much simpler analysis.
Conclusions
In summary, we have developed a small-molecule probe that enables single-step detection of HDAC activity from simple spectrophotometric and fluorescence measurements, based on a new application of an intramolecular imine formation process with an amine-reactive coumarin fluorophore. We have illustrated the utility of the probe with the first examples of continuous, real-time measurement of deacetylation activity in samples of purified enzymes and in cell lysates. The convenience of the optical readouts and good Z′ values make our probe a valuable tool for evaluation of HDAC inhibitors with potential therapeutic application. The wavelength shift observed in the absorption spectrum upon imine formation is an attractive feature, as it may enable ratiometric determination of substrate conversion. Finally, with a rapid and continuous response, and no need for additional reagents or extraction steps, we envision that our small-molecule probe may serve as a starting point in the development of new methods for the real time measurement of deacetylase activity in cells, a valuable tool in the epigenetics research arena.Acknowledgements
This work was supported by an NYU Whitehead Fellowship for Junior Faculty in Biomedical and Biological Sciences to D.B. and a Margaret Strauss Kramer Fellowship to D.R. The Bruker Avance 400 and 500 NMR spectrometers were acquired with support of NSF under award number CHE-01162222. The authors thank Harriet Lloyd and Boris Ryabtsev for assistance during initial studies.Notes and references
- T. Kouzarides, Cell, 2007, 128, 693–705 CrossRef CAS PubMed
.
- C. B. Yoo and P. A. Jones, Nat. Rev. Drug Discovery, 2006, 5, 37–50 CrossRef CAS PubMed
- M. A. Glozak and E. Seto, Oncogene, 2007, 26, 5420–5432 CrossRef CAS PubMed
- D. Kölle, G. Brosch, T. Lechner, A. Lusser and P. Loidl, Methods, 1998, 15, 323–331 CrossRef PubMed
- Y. Zhang, G. LeRoy, H.-P. Seelig, W. S. Lane and D. Reinberg, Cell, 1998, 95, 279–289 CrossRef CAS
- K. Hoffmann, G. Brosch, P. Loidl and M. Jung, Nucleic Acids Res., 1999, 27, 2057–2058 CrossRef CAS PubMed
- D. Wegener, F. Wirsching, D. Riester and A. Schwienhorst, Chem. Biol., 2003, 10, 61–68 CrossRef CAS
- K. Dhara, Y. Hori, R. Baba and K. Kikuchi, Chem. Commun., 2012, 48, 11534–11536 RSC
- R. Baba, Y. Hori, S. Mizukami and K. Kikuchi, J. Am. Chem. Soc., 2012, 134, 14310–14313 CrossRef CAS PubMed
- M. Minoshima, T. Matsumoto and K. Kikuchi, Anal. Chem., 2014, 86, 7925–7930 CrossRef CAS PubMed
- K. Hoffmann, B. Heltweg and M. Jung, Arch. Pharm., 2001, 334, 248–252 CrossRef CAS
- D. Wegener, C. Hildmann, D. Riester and A. Schwienhorst, Anal. Biochem., 2003, 321, 202–208 CrossRef CAS
- Bioluminogenic variants of this method have been reported as well. See: F. Halley, J. Reinshagen, B. Ellinger, M. Wolf, A. L. Niles, N. J. Evans, T. A. Kirkland, J. M. Wagner, M. Jung, P. Gribbon and S. Gul, J. Biomol. Screening, 2011, 16, 1227–1235 CrossRef CAS PubMed
- R. Baba, Y. Hori and K. Kikuchi, Chem.-Eur. J., 2015, 21, 4695–4702 CrossRef CAS PubMed
- A. Vannini, C. Volpari, G. Filocamo, E. C. Casavola, M. Brunetti, D. Renzoni, P. Chakravarty, C. Paolini, R. De Francesco, P. Gallinari, C. Steinkühler and S. Di Marco, Proc. Natl. Acad. Sci. U. S. A., 2004, 101, 15064–15069 CrossRef CAS PubMed
- M. S. Finnin, J. R. Donigian, A. Cohen, V. M. Richon, R. A. Rifkind, P. A. Marks, R. Breslow and N. P. Pavletich, Nature, 1999, 401, 188–193 CrossRef CAS PubMed
- A. V. Bieliauskas and M. K. H. Pflum, Chem. Soc. Rev., 2008, 37, 1402–1413 RSC
- K. E. Secor and T. E. Glass, Org. Lett., 2004, 6, 3727–3730 CrossRef CAS PubMed
- R.-Y. Tang, P. Zhong and Q.-L. Lin, Synthesis, 2007, 2007, 85–91 CrossRef
- E. K. Feuster and T. E. Glass, J. Am. Chem. Soc., 2003, 125, 16174–16175 CrossRef CAS PubMed
- C. M. Cooley, K. S. Hettie, J. L. Klockow, S. Garrison and T. E. Glass, Org. Biomol. Chem., 2013, 11, 7387–7392 CAS
- K. S. Hettie, X. Liu, K. D. Gillis and T. E. Glass, ACS Chem. Neurosci., 2013, 4, 918–923 CrossRef CAS PubMed
- V. Perissi, K. Jepsen, C. K. Glass and M. G. Rosenfeld, Nat. Rev. Genet., 2010, 11, 109–123 CrossRef CAS PubMed
- HPLC analysis of the mixture at the end of each experiment was used to verify the amount of product obtained, based on calibration conducted with pure samples prepared independently.
- J.-H. Zhang, T. D. Y. Chung and K. R. Oldenburg, J. Biomol. Screening, 1999, 4, 67–73 CrossRef PubMed
- M. Göttlicher, S. Minucci, P. Zhu, O. H. Krämer, A. Schimpf, S. Giavara, J. P. Sleeman, F. Lo Coco, C. Nervi, P. G. Pelicci and T. Heinzel, EMBO J., 2001, 20, 6969–6978 CrossRef PubMed
- D. M. Fass, R. Shah, B. Ghosh, K. Hennig, S. Norton, W.-N. Zhao, S. A. Reis, P. S. Klein, R. Mazitschek, R. L. Maglathlin, T. A. Lewis and S. J. Haggarty, ACS Med. Chem. Lett., 2011, 2, 39–42 CrossRef CAS PubMed
- N. Gurvich, O. M. Tsygankova, J. L. Meinkoth and P. S. Klein, Cancer Res., 2004, 64, 1079–1086 CrossRef CAS
- Absorption at 510 nm shows a smaller contribution from the aldehyde than absorption at 499 nm.
- H. V. K. Diyabalanage, G. C. van de Bittner, E. L. Ricq and J. M. Hooker, ACS Chem. Biol., 2014, 9, 1257–1262 CrossRef CAS PubMed
- Some variability in the conversion rate was observed between experiments conducted with different batches of the nuclear extract. In every case, however, the amount of product formed estimated by the spectroscopic measurements were in accordance with the values calculated by chromatographic analysis of the mixture at the end of the run.
Footnote |
| † Electronic supplementary information (ESI) available: Experimental details, additional absorption and fluorescence spectra, kinetic and thermodynamic parameters of intramolecular imine formation and characterization data for all compounds. See DOI: 10.1039/c5sc02704g |
| This journal is © The Royal Society of Chemistry 2015 |