 Open Access Article
Platinum-decorated carbon nanotubes for hydrogen oxidation and proton reduction in solid acid electrochemical cells†
V. Sara
Thoi
,
Robert E.
Usiskin
and
Sossina M.
Haile
*
Departments of Materials Science and Chemical Engineering, California Institute of Technology, 1200 California Blvd, Pasadena, CA 91125, USA. E-mail: smhaile@caltech.edu
First published on 22nd December 2014
Abstract
Pt-decorated carbon nanotubes (Pt-CNTs) were used to enhance proton reduction and hydrogen evolution in solid acid electrochemical cells based on the proton-conducting electrolyte CsH2PO4. The carbon nanotubes served as interconnects to the current collector and as a platform for interaction between the Pt and CsH2PO4, ensuring minimal catalyst isolation and a large number density of active sites. Particle size matching was achieved by using electrospray deposition to form sub-micron to nanometric CsH2PO4. A porous composite electrode was fabricated from electrospray deposition of a solution of Pt-CNTs and CsH2PO4. Using AC impedance spectroscopy and cyclic voltammetry, the total electrode overpotential corresponding to proton reduction and hydrogen oxidation of the most active electrodes containing just 0.014 mg cm−1 of Pt was found to be 0.1 V (or 0.05 V per electrode) at a current density of 42 mA cm−2 for a measurement temperature of 240 °C and a hydrogen-steam atmosphere. The zero bias electrode impedance was 1.2 Ω cm2, corresponding to a Pt utilization of 61 S mg−1, a 3-fold improvement over state-of-the-art electrodes with a 50× decrease in Pt loading.
Introduction
Fuel cells are promising alternatives to combustion engines for converting chemical energy into electrical energy due to their high efficiencies and benign byproducts.1–4 However, current fuel cell technologies have focused on polymeric electrolytes that require critical water management and significantly drive up the production cost. Emerging as an attractive class of fuel cells, solid acid fuel cells (SAFCs), which utilize a proton-conducting membrane of a solid-state acid electrolyte, have the potential to mitigate these issues as well as operate at intermediate temperatures to take advantage of higher kinetics and enhanced tolerance to fuel impurities.5–7 In addition, a solid-state electrolyte inherently avoids challenges with catalyst dissolution and fuel crossover.Of all the known solid acids, cesium dihydrogen phosphate (CsH2PO4) has been the most developed for fuel cells and hydrogen separation applications due to its high proton conductivity (2 × 10⁻² S cm−1 at 230–250 °C), compatibility with catalysts, and stability.8–11 A fuel cell peak power density of 415 mW cm−2 (at 0.35 V) has been achieved at 250 °C using a CsH2PO4 membrane and composite electrodes of Pt black, Pt on carbon, and the electrolyte itself, in a 3![[thin space (1/6-em)]](https://www.rsc.org/images/entities/char_2009.gif) :
:![[thin space (1/6-em)]](https://www.rsc.org/images/entities/char_2009.gif) 1
1![[thin space (1/6-em)]](https://www.rsc.org/images/entities/char_2009.gif) :
:![[thin space (1/6-em)]](https://www.rsc.org/images/entities/char_2009.gif) 3 mass ratio.12–15 Such devices show good activity for hydrogen oxidation and proton reduction, but at rather high Pt loadings; the performance quoted above required a loading of 7.7 mg cm−2 at each electrode. Accordingly, the mass normalized activity of Pt, or Pt utilization (defined as the area specific electrode conductance, S cm−2, divided by the Pt loading, mg cm−2) for such a device is rather low, 2.2 S mg−1. Pre-commercial efforts have increased the Pt utilization at the anode of CsH2PO4 fuel cells to 21 S mg−1, using 0.8 mg cm−2 of Pt in composite structures.15,16 Remarkably, the Pt utilization for a dense thin-film Pt electrode is 19 S mg−1,17 comparable to that in the optimized, porous, pre-commercial electrodes, despite the nominal absence of triple phase boundaries in the former. This surprising similarity suggests that a large fraction of the Pt in the composite electrodes is catalytically inactive as a result of electrical isolation, consistent with the still high Pt loadings required to achieve attractive fuel cell power outputs. Thus, enhancing electrical connectivity is suggested as a means of lowering the Pt loading while maintaining or even increasing the Pt utilization.
3 mass ratio.12–15 Such devices show good activity for hydrogen oxidation and proton reduction, but at rather high Pt loadings; the performance quoted above required a loading of 7.7 mg cm−2 at each electrode. Accordingly, the mass normalized activity of Pt, or Pt utilization (defined as the area specific electrode conductance, S cm−2, divided by the Pt loading, mg cm−2) for such a device is rather low, 2.2 S mg−1. Pre-commercial efforts have increased the Pt utilization at the anode of CsH2PO4 fuel cells to 21 S mg−1, using 0.8 mg cm−2 of Pt in composite structures.15,16 Remarkably, the Pt utilization for a dense thin-film Pt electrode is 19 S mg−1,17 comparable to that in the optimized, porous, pre-commercial electrodes, despite the nominal absence of triple phase boundaries in the former. This surprising similarity suggests that a large fraction of the Pt in the composite electrodes is catalytically inactive as a result of electrical isolation, consistent with the still high Pt loadings required to achieve attractive fuel cell power outputs. Thus, enhancing electrical connectivity is suggested as a means of lowering the Pt loading while maintaining or even increasing the Pt utilization.
Beyond electrical interconnectivity, a second factor shown to impact electrode overpotential is the size of the electrolyte particles in the composite electrode. Specifically, it has been shown that decreasing the CsH2PO4 particle size at a fixed Pt loading lowers the electrode overpotential, a result attributed to a concomitant increase in the number density of electrolyte–catalyst–gas triple-phase boundary points.15 Electrospray deposition is an attractive approach for achieving the goal of small electrolyte particles. By controlling the drying rate of the electrosprayed droplets, sub-micron to nanometric particles can be generated and ultimately deposited to form a high surface area structure.18 We recently demonstrated the use of electrospray deposition to form Pt–CsH2PO4 composite structures with electrolyte particle sizes in the 50–300 nm size range and a 35 times enhancement in Pt utilization at 2.2 S mg−1 over electrodes of identical composition prepared by mechanical milling.19 In a subsequent study, we further showed that carbon nanotubes (CNTs), grown directly onto the carbon fibers in the carbon paper current collector, could enhance the electrical interconnectivity of the Pt nanoparticles to the exterior circuit. The resulting structure displayed a mass normalized activity of 6.6 S mg−1, a 3-fold increase relative to electrosprayed electrodes without CNTs.20
The results achieved to date underscore the importance of architectural control over electrode features in maximizing Pt utilization in solid state electrochemical devices. Here, we build on the concepts of carbon nanotubes as Pt interconnects and electrospray deposition of high surface area structures to create high activity electrodes for solid acid electrochemical cells. Specifically, we incorporate free-standing Pt-decorated carbon nanotubes into CsH2PO4 composite electrodes. While Pt-decorated CNTs have been employed in polymer electrolyte membrane (PEM) fuel cells and indeed have led to enhanced Pt utilization,21–23 the anhydrous nature of the solid acid electrolyte employed here eases the need to firmly anchor the Pt to the CNT on functionalized sites to prevent nanoparticle detachment. Using a relatively simple preparation, we achieve a 3-fold enhancement in Pt utilization and a 50× decrease in Pt loading relative to state-of-the-art composite electrodes, with only a small penalty in absolute activity.
Experimental
General
Commercial multi-walled carbon nanotubes (MWCNTs, 15 ± 5 nm diameter, 1–5 μm length) were purchased from Nanolab, Inc. These CNTs were not subject to any explicit chemical treatment for functionalization. In-house CsH2PO4 was synthesized by dissolving stoichiometric quantities of Cs2CO3 and H3PO4 (85% assay) in deionized water, followed by a methanol-induced precipitation. The resulting precipitate was dried at 120 °C for 12 h. Untreated Toray carbon paper (TGP-H-120, Fuel Cell Earth, LLC.) was used as the current collector in electrochemical cells and as the substrate for electrospray deposition. Polyvinylpyrrolidone (Alfa Aesar, Mw ∼ 8000 g mol−1) and Nanosperse AQ (Nanolab, Inc.) were used as dispersants for suspending carbon nanotubes in aqueous solutions in the electrospray step. Scanning electron microscopy images were collected at the Department of Geological and Planetary Sciences at Caltech (ZEISS 1550VP FESEM) and at Northwestern University's Atomic and Nanoscale Characterization Experimental Center (Hitachi SU8030). Thermogravimetric analysis was conducted on Netzsch STA 449 C Jupiter and Netzsch STA 449 F3 Jupiter thermal analyzers. X-Ray powder diffraction was performed using a PANalytical X'Pert PW3040-PRO (Cu Kα). Raman spectra were collected with a Renishaw M1000 Micro Raman Spectrometer System, using a green laser at 514.5 nm.Synthesis of Pt-decorated CNTs (Pt-CNTs)
Pt decoration of the CNTs followed a procedure reported by Xue et al. that involves essentially direct solid state reaction between a metal salt and the CNTs24 and eliminates the need for explicit functionalization of the support to create metal nanoparticle anchor sites. 100 mg of MWCNTs was dispersed by sonication for 2 h in an aqueous solution of H2PtCl6 with the metal salt concentration fixed to obtain an ultimate target Pt weight percent (30–50 wt%). The water was allowed to evaporate and the CNTs were dried at 60 °C in air for 18 h. The resulting powder was transferred to an aluminum boat and then heated in a tube furnace (Lindberg/Blue M Mini-Mite) to 200 °C at a rate of 15 °C min−1 under a flow of argon. Reduction of the Pt precursor was accomplished by flowing 250 sccm (standard cubic centimeter per minute, gas-phase velocity of 85 cm min−1) of hydrogen for 60 min at 200 °C. The system was cooled to room temperature under a flow of argon. The actual Pt weight percent achieved was determined by thermogravimetric analysis (TGA). The steps for CNT decoration are summarized in Scheme 1.Electrospray deposition
Two types of Pt-bearing solutions were utilized for electrode preparation by electrospray deposition. The first solution was a suspension of Pt-decorated CNTs in a solvent of 50 mol% methanol in DI water.19,20 The loading was set at 10 mg of Pt-CNT per 20 mL of solution, and one drop of a commercial dispersant (Nanosperse AQ, Nanolab, Inc.) was added (to a 20 mL solution) to prevent agglomeration. The second solution was one in which both CNTs and CsH2PO4 were incorporated, termed hereafter a composite solution. This was prepared by dissolving 20 mg of CsH2PO4 and 10 mg of polyvinylpyrrolidone in 6 mL of DI water. After complete dissolution, 10 mg of Pt-CNT was added and the solution was diluted with 14 mL of methanol to yield a final methanol concentration of 50 mol% in DI water. Both solutions were sonicated for two hours, resulting in a stable suspension suitable for electrospray deposition. As a note, Pt-CNTs can spark if placed in direct contact with neat methanol; accordingly, the Pt-CNT powder was always added to water prior to the introduction of methanol.The electrospray deposition was performed using a custom-built apparatus, shown schematically in Fig. S1.†19,20 A voltage of 5.5 kV was applied across a distance of 19 mm between the substrate and the tip of the stainless steel capillary (Sigma Aldrich, 0.5 mm inner diameter, 1.6 mm outer diameter, 15 cm length) through which the solution was supplied. To encourage rapid solvent evaporation and ensure deposition of dry particles (that would not be subject to the rapid agglomeration expected of deposition of damp particles), N2 heated at 140 °C was flowed through the chamber at 1 L min−1. The substrate, a 19 mm diameter piece of carbon paper, was held in place using a 15 mm diameter mask and was similarly heated to 140 °C. The apparatus configuration positions the substrate above the capillary such that the spray is directed upwards and any large droplets are pulled by gravity away from the deposition area. The deposition mass was determined by comparing the mass of the carbon paper substrate before and after deposition, using a Cahn C-35 Ultra-Microbalance (with a sensitivity of 1 μg) to obtain the starting mass. Prior to the initial measurement, the bare carbon paper was heat-treated at 140 °C for 5 h. For example, a typical two-hour deposition of 46 wt% Pt-CNT–CsH2PO4 yielded a total mass (inclusive of all three components) of 200 μg or ∼0.11 mg cm−2. For each Pt loading value, at least three cells were evaluated. Two variations of this overall fabrication approach are discussed.
Electrochemical characterization
From the electrosprayed structures, electrodes were formed by cutting out two 6 mm diameter circles from the electrosprayed 15 mm diameter substrate, confining the active electrode area to be 0.28 cm2. Geometrically symmetric cells were fabricated by pressing two of these electrodes on either side of 500 mg of CsH2PO4 powder in a 19 mm die at 69 MPa for 20 min. The thickness of the CsH2PO4 electrolyte was typically 0.6 mm with density ∼90% of the theoretical value.Stainless steel gas diffusion layers (McMaster-Carr, Type 316, mesh size 100 × 100) were placed on either side of the cell. The assembly was pressed together in a custom-made holder and tightened by four screws. Each electrode was connected to the impedance analyser by Ag wire leads. The holder was placed inside a stainless steel tube (40 mm diameter) and the temperature was ramped up to 140 °C at 2 °C min−1 in air. Under a flow of humid argon (0.4 atm H2O, 6 cm min−1), the temperature was increased to 240 °C at 2 °C min−1. Humid hydrogen (0.4 atm H2O, 6 cm min−1) was introduced 30 min prior to the first measurement to allow for gas equilibration. Gases were humidified by flowing through a water bubbler heated to 80 °C. All electrochemical measurements were performed at a single temperature (240 °C) and gas atmosphere condition (pH2 = 0.4 atm, balance H2O).
AC impedance spectra were collected using a Solartron 1260 Impedance/Gain-Phase Analyzer. The perturbation voltage was 20 mV and the sampling frequency range was 106 to 0.05 Hz. Because the cells were symmetric, the electrode impedance measured was the summed result of both proton reduction and hydrogen oxidation. Data were visualized and analyzed using the commercial software package ZView 2. Polarization curves were measured using a Metrohm AutoLab PGSTAT-302 at a scan rate of 1 mV s−1. Again, because of the symmetric nature of the cell and the gas environment, the measured voltage drops included contributions from both forward and reverse reactions.
Results and discussion
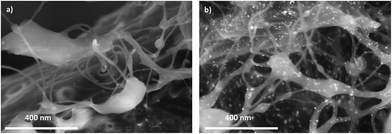
X-ray powder diffraction (XRD) patterns of the as-prepared Pt-CNTs (after reduction in hydrogen) show broad peaks that can be assigned to C, Pt (111), Pt (200) and Pt (220),25 as expected for Pt on CNTs (Fig. 1a). The Pt peaks are broad, characteristic of nanoparticles, and the grain/particle sizes are estimated, based on the full-width half-max of the (111) peak (after subtraction of the instrumental broadening) and the Scherrer equation,26 to be 9.4 nm and 13.7 nm for 30 and 46 wt% Pt-CNTs, respectively. The very small intensity of the CNT (002) peak at 26° 2Θ in Fig. 1a is consistent with the high Pt loading.27 Characteristic D, G, D′, and G′ bands of carbon nanotubes in the region of 500–3000 cm−1 were observed by Raman spectroscopy (Fig. 1b).28 The spectra collected before and after Pt decoration are similar, implying that the CNTs are largely unchanged through the processing steps. The slight increase in the relative intensity of the D band at ∼1400 cm−1 upon treatment suggests a small change in the structure surrounding defect sites, as may be expected if Pt nanoparticle nucleation and growth is initiated at such sites. SEM images show that the CNTs are structurally unchanged as a result of the processing (Fig. 2). Here, images of as-received CNTs and 46 wt% Pt-treated CNTs are compared. Bright spots, in the size range of 3–17 nm diameter are evident (only) in the Pt-treated CNTs using both secondary and back-scatter electron detectors. The sizes of these nanoparticles are consistent with the size estimation by XRD for the Pt particles.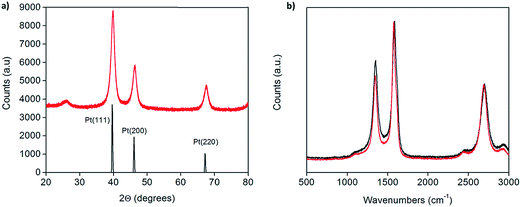 | ||
| Fig. 1 (a) X-ray powder diffraction of 46 wt% Pt-CNTs (red) along with a reference trace25 (black), and (b) Raman spectra of as-received (red) and 46 wt% Pt-decorated (black) commercial CNTs showing that the carbon nanotube structure is largely unchanged after decoration. | ||
Representative thermogravimetric traces (under flowing air, 200 mL min−1, heating rate of 2 °C min−1, total sample size of 10 mg), Fig. 3, show that Pt-decorated CNTs are resistant to oxidation in air to ∼350 °C. Negligible mass changes (<1%) were observed upon the introduction of a reducing gas (2% H2 bal. Ar, Fig. S2†) at 800 °C, indicating that PtOx does not contribute to the residual mass. From the weight of this mass, it was found that loadings of 30 and 40 wt% Pt could be reproducibly achieved. In contrast, several attempts to reach 50 wt% loading consistently yielded a value of 46 wt% of Pt. The reason for this behavior was not explored, but may reflect a saturation of native defect sites on the nominally unfunctionalized commercial CNTs onto which Pt precipitation can occur. It is noteworthy that, at high (but unspecified) Cu loadings, Chen et al. observed a transition in deposit morphology from isolated nanoparticles to continuous coatings, using a nearly identical approach.29 No such transition is evident here. Traditional Pt-deposition approaches in which a Pt-bearing salt is reduced on the surface of oxidized (functionalized) CNTs routinely yield Pt loadings as high as 30 wt%.30 These loadings can be increased to as much as 60 wt% using more exotic techniques.31,32 Thus, the loadings obtained here fall within the ranges possible by other methods, but with the benefit of greatly simplified procedures.
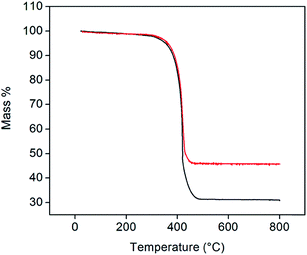 | ||
| Fig. 3 TGA profiles of 30 (black) and 46 wt% (red) Pt-CNTs (measured under flowing air at a heating rate of 2 °C min−1). | ||
The morphological characteristics of electrosprayed structures from Pt-CNT suspensions and composite Pt-CNT–CsH2PO4 solutions are presented in Fig. 4 and 5, respectively; for illustrative purposes, the image of a drop-cast structure, obtained simply by allowing a drop of the Pt-CNT suspension to dry on carbon paper, is also shown. A dramatic difference is evident between dropcast and electrosprayed morphologies. In the former, the CNTs are highly agglomerated and non-uniformly distributed (Fig. 4a), whereas the electrosprayed structure of the same Pt-CNT suspension shows a homogenous distribution of material over the carbon fibers (Fig. 4b). The composite electrosprayed structure (Fig. 5) additionally displays a relatively uniform distribution of the CsH2PO4 electrolyte particles. These particles are formed directly on the CNTs, a desirable configuration, and have a size ranging from as small as 10 nm up to ∼1 μm. The appearance of large particles has been attributed elsewhere to incomplete drying of the electrosprayed droplets prior to deposition,19,20 however, this was not confirmed in the experiments reported here.
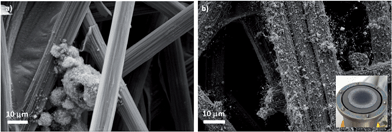 | ||
| Fig. 4 SEM images of (a) drop-cast 30 wt% Pt-CNTs and (b) electrosprayed 30 wt% Pt-CNTs (inset: image of electrosprayed Pt-CNTs on a carbon paper substrate). | ||
 | ||
| Fig. 5 SEM images of electrosprayed 46 wt% Pt-CNT–CsH2PO4 composites, showing direct contact between the electrolyte particles with the carbon nanotubes: (a) low and (b) high magnification. | ||
The impedance behavior of two symmetric cells constructed using two different electrode fabrication strategies (Scheme 2) from 30 wt% Pt-CNTs are compared in Fig. 6. In the first case, a layered-composite electrode was prepared using sequential electrospray deposition of 30 wt% Pt-CNTs for 90 min (0.5 g L−1 in 50 mol% methanol in DI water, solution flow rate of 1 mL h−1) and then CsH2PO4 (10 g L−1 with 5 g L−1 polyvinylpyrrolidone in 50 mol% methanol in DI water, solution flow rate of 0.3 mL h−1) for 30 min. In the second case, a 30 wt% Pt-CNTs–CsH2PO4 composite solution was sprayed for 90 min (1 g L−1 CsH2PO4, 0.5 g L−1 polyvinylpyrrolidone, and 0.5 g L−1 Pt-CNT in 50 mol% methanol in DI water, solution flow rate of 1 mL h−1) to obtain a direct-composite structure. The combination of component concentrations, flow rates, and deposition times were selected to create electrodes of comparable total mass and a 2![[thin space (1/6-em)]](https://www.rsc.org/images/entities/char_2009.gif) :
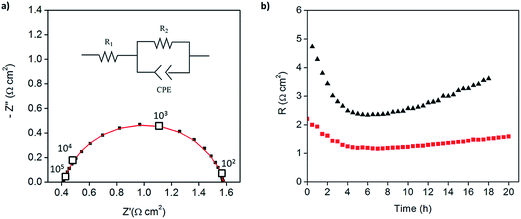
:![[thin space (1/6-em)]](https://www.rsc.org/images/entities/char_2009.gif) 1 mass ratio of electrolyte to Pt-CNTs. Cross-sectional SEM analyses of the as-deposited electrodes showed that the layered composite (strategy 1) was about 50 μm thick, whereas the co-sprayed composite (strategy 2) was much thicker, about 200 μm (Fig. S3†). This unanticipated difference may result because the sequential depositions of Pt-CNT and CsH2PO4 in strategy 1 does not require interactions between hydrophobic and hydrophilic components. In contrast, deposition from a single solution (strategy 2) may involve repulsive interactions between components such that the electrode porosity and hence thickness increase. Regardless of these differences, the impedance spectra of both of these representative electrodes show a characteristic offset along the real axis, readily attributed to the resistance of the electrolyte, along with a single arc, which corresponds to the electrode processes. The offset resistance, R1, of 2.7 Ω cm2 is precisely equal to the expected value implied by the electrolyte dimensions (thickness of 0.06 cm, area of 0.28 cm2) and conductivity of 2.2 × 10⁻² S cm−1 at 240 °C. Accordingly, the impedance response in all cases was described using a R1–R2(CPE) equivalent circuit (as indicated in the inset to Fig. 6),33 with R2 representing the electrochemical reaction resistance and CPE being a constant phase element34 representing the capacitive behavior of the electrodes.
1 mass ratio of electrolyte to Pt-CNTs. Cross-sectional SEM analyses of the as-deposited electrodes showed that the layered composite (strategy 1) was about 50 μm thick, whereas the co-sprayed composite (strategy 2) was much thicker, about 200 μm (Fig. S3†). This unanticipated difference may result because the sequential depositions of Pt-CNT and CsH2PO4 in strategy 1 does not require interactions between hydrophobic and hydrophilic components. In contrast, deposition from a single solution (strategy 2) may involve repulsive interactions between components such that the electrode porosity and hence thickness increase. Regardless of these differences, the impedance spectra of both of these representative electrodes show a characteristic offset along the real axis, readily attributed to the resistance of the electrolyte, along with a single arc, which corresponds to the electrode processes. The offset resistance, R1, of 2.7 Ω cm2 is precisely equal to the expected value implied by the electrolyte dimensions (thickness of 0.06 cm, area of 0.28 cm2) and conductivity of 2.2 × 10⁻² S cm−1 at 240 °C. Accordingly, the impedance response in all cases was described using a R1–R2(CPE) equivalent circuit (as indicated in the inset to Fig. 6),33 with R2 representing the electrochemical reaction resistance and CPE being a constant phase element34 representing the capacitive behavior of the electrodes.
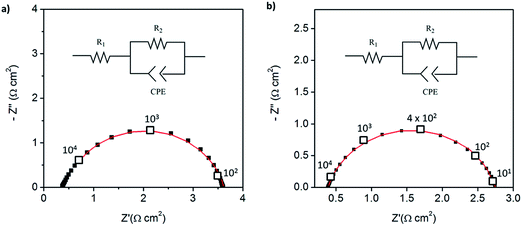 | ||
| Fig. 6 Symmetric cell impedance measurements of 30 wt% Pt-CNT based electrodes prepared by (a) strategy 1 (see Scheme 2) in which Pt-CNT bearing and CDP bearing solutions were electrosprayed sequentially, and (b) strategy 2 in which a single Pt-CNT and CDP bearing solution was sprayed. In (a), the Pt loading and utilization are 4.2 × 10⁻³ mg cm−2 Pt and 64 S mg−1, respectively, whereas in (b) they are 5.1 × 10⁻³ mg cm−2 Pt and 86 S mg−1. Measurements are performed at 240 °C in a dynamic atmosphere of 0.4 atm H2O and balance H2 supplied at a gas velocity of 6 cm min−1 and spectra are taken after 4 hours (insets: equivalent circuit used for fitting). | ||
In general, the two 30 wt% Pt-CNT-containing cells, which are representative of all the samples examined, display exceptional performance in light of the ultra-low Pt loadings. The layered-composite electrode has a Pt loading of just 4.2 μg cm−2 of Pt yet an area-specific electrochemical reaction resistance of 3.7 Ω cm2. These values imply a Pt utilization of 64 S mg−1, 3 times higher than that of state-of-the-art solid acid fuel cell electrodes.15,16 The composite electrode of Pt-CNTs and CsH2PO4 has a resistance value of just 2.3 Ω cm2, a significant improvement over Pt-CNTs alone, while maintaining a high Pt utilization. Overall, it was found that Pt utilization between the two approaches was similar, but measurably higher loadings could be achieved with direct-composite fabrication, suggesting a better deposition efficiency by this approach and resulting in lower electrode impedances. For reference, cells with non-treated CNTs were also evaluated (Fig. S4†). Not surprisingly, these displayed extremely high electrochemical reaction resistance values (∼6500 Ω cm2, fitted to the same equivalent circuit as described above), indicating that any residual metals from the CNT growth contribute negligible activity for hydrogen electro-oxidation/proton reduction.
Because of the enhanced activity of direct-composite electrodes over layered-composite electrodes, all subsequent experiments employed direct-composite electrodes. A further improvement to the catalysis was achieved by increasing the Pt loading on the carbon nanotubes. The 46 wt% Pt-CNT–CsH2PO4 composite electrode (Fig. 5) has an electrode resistance value of just 1.2 Ω cm2 (Fig. 7a). Given the Pt loading of 0.014 mg cm−2, this result implies a Pt utilization of 61 S mg−1. Thus, the global activity can be enhanced by increasing the loading while maintaining a high Pt utilization. The results for all the measurements are summarized in Table 1. In the case of Pt loading, ranges are reported due to the difficulty of measuring small masses accurately (on the μg scale). In addition, there is a possibility that the soluble CsH2PO4 preferentially deposits on the carbon substrate due to accumulation of the suspended Pt-CNTs at the tip of the capillary. Therefore, the Pt utilization and loading reported here are conservative estimates, representing the lower limits of activity. Irrespective of this uncertainty, the general trend of extremely high Pt utilization at low resistance values is evident, as is a tendency towards higher global activity at fixed utilization with increasing Pt loading. Two additional features are noteworthy. First, the Pt utilization in the Pt-CNT electrodes of the present work exceeds the value obtained from a thin-film electrode in which presumably the entirety of the Pt film was electrically connected and thus electrochemically accessible. The higher Pt utilization obtained here implies that not only is all of the Pt accessible, it has higher inherent mass normalized activity than a film 7.5 nm in thickness. Perhaps not surprisingly, the implication is that nanoparticle Pt provides triple phase boundary sites not present in the hydrogen permeable film. Second, the Pt particle sizes obtained here are larger than those typically obtained from solution reduction methods,22 yet high activity is achieved. Given the general observation that catalytic activity improves with decreasing particles size, a clear path for enhancing performance emerges. Furthermore, if one presumes that the observed trend of fixed utilization with increased loading continues, even without relying on smaller particles, one can extrapolate to an expected electrode resistance of about 0.05 Ω cm−2 at a Pt loading of just 0.25 mg cm−2. This represents a factor of 3 reduction in Pt loading from state-of-the-art pre-commercial electrodes.15,17 Accordingly, efforts are under way to enhance the deposition procedures to achieve higher loadings without loss of the desirable architectural features.
| Electrode | R (Ω cm2) | Pt loading (mg cm−2) | Pt Utilization (S mg−1) |
|---|---|---|---|
| 30 wt% Pt-CNTs | 3.3–3.8 | 3.2–4.6 (×10−3) | 64–81 |
| 30 wt% Pt-CNT–CsH2PO4 composite | 2.0–3.0 | 4.9–5.7 (×10−3) | 68–88 |
| 40 wt% Pt-CNT–CsH2PO4 composite | 1.6–1.9 | 6.3–11 (×10−3) | 45–94 |
| 46 wt% Pt-CNT–CsH2PO4 composite | 1.2–1.3 | 10–14 (×10−3) | 61–78 |
| 7.5 nm sputtered Pt17 | 3.1 | 17 × 10−3 | 19 |
Pt![[thin space (1/6-em)]](https://www.rsc.org/images/entities/char_2009.gif) : :![[thin space (1/6-em)]](https://www.rsc.org/images/entities/char_2009.gif) Pt/C Pt/C![[thin space (1/6-em)]](https://www.rsc.org/images/entities/char_2009.gif) : :![[thin space (1/6-em)]](https://www.rsc.org/images/entities/char_2009.gif) CsH2PO415,16 CsH2PO415,16 |
0.06 | 0.8 | 21 |
Pt![[thin space (1/6-em)]](https://www.rsc.org/images/entities/char_2009.gif) : :![[thin space (1/6-em)]](https://www.rsc.org/images/entities/char_2009.gif) Pt/C Pt/C![[thin space (1/6-em)]](https://www.rsc.org/images/entities/char_2009.gif) : :![[thin space (1/6-em)]](https://www.rsc.org/images/entities/char_2009.gif) CsH2PO4 (3 CsH2PO4 (3![[thin space (1/6-em)]](https://www.rsc.org/images/entities/char_2009.gif) : :![[thin space (1/6-em)]](https://www.rsc.org/images/entities/char_2009.gif) 1 1![[thin space (1/6-em)]](https://www.rsc.org/images/entities/char_2009.gif) : :![[thin space (1/6-em)]](https://www.rsc.org/images/entities/char_2009.gif) 3) mech. mix13,14 3) mech. mix13,14 |
0.06 | 7.1 | 2.2 |
Pt![[thin space (1/6-em)]](https://www.rsc.org/images/entities/char_2009.gif) : :![[thin space (1/6-em)]](https://www.rsc.org/images/entities/char_2009.gif) CsH2PO4 (1 CsH2PO4 (1![[thin space (1/6-em)]](https://www.rsc.org/images/entities/char_2009.gif) : :![[thin space (1/6-em)]](https://www.rsc.org/images/entities/char_2009.gif) 2) electrosprayed on carbon19 2) electrosprayed on carbon19 |
1.5 | 0.3 | 2.2 |
Pt![[thin space (1/6-em)]](https://www.rsc.org/images/entities/char_2009.gif) : :![[thin space (1/6-em)]](https://www.rsc.org/images/entities/char_2009.gif) Pt/C Pt/C![[thin space (1/6-em)]](https://www.rsc.org/images/entities/char_2009.gif) : :![[thin space (1/6-em)]](https://www.rsc.org/images/entities/char_2009.gif) CsH2PO4 (3 CsH2PO4 (3![[thin space (1/6-em)]](https://www.rsc.org/images/entities/char_2009.gif) : :![[thin space (1/6-em)]](https://www.rsc.org/images/entities/char_2009.gif) 1 1![[thin space (1/6-em)]](https://www.rsc.org/images/entities/char_2009.gif) : :![[thin space (1/6-em)]](https://www.rsc.org/images/entities/char_2009.gif) 3) electrosprayed on CNT overgrown on carbon20 3) electrosprayed on CNT overgrown on carbon20 |
0.5 | 0.3 | 6.6 |
Beyond initial performance, stability is an essential parameter in the evaluation of an electrode. As shown in Fig. 7b, both the 30 and 46 wt% Pt-CNT samples, represented in Fig. 6c and 7a, respectively, displayed an initial decrease in electrochemical reaction resistance which persisted for the first 4–5 h (the full spectra shown correspond to the minimum impedance conditions), and then reverted towards an increase. Furthermore, both the initial increase in activity and the subsequent degradation with time are more pronounced for the electrode with lower Pt loading. The reasons for these changes, which are representative of all samples examined, are unknown. The initial improvement in performance may be due to enhanced interfacial contacts under the pressure of the measurement apparatus; the later degradation in performance may be due to loss in triple phase boundaries between the gas, the catalyst, and the electrolyte, also as a result of compaction under pressure. The high plasticity of superprotonic solid acids is well documented13,15,35 and may contribute to morphological evolution, with higher Pt loadings serving to provide enhanced mechanical stabilization by increasing the chemical interaction between the electrolyte and conductive phase. The large pores in the carbon paper current collectors are areas lacking mechanical support and may exacerbate morphological evolution. Coarsening of Pt particles may also be a contributing factor to long term degradation, and this might be expected to be less pronounced for the higher loading compositions in which the initial Pt size is larger. Given the thermal behavior documented in Fig. 3, oxidation of the CNTs under the conditions of electrochemical measurement is considered unlikely to contribute to degradation. On the expectation that closing off the pore structure in the carbon paper electrode would enhance stability, direct-composite Pt-CNT–CsH2PO4 electrodes were electrosprayed onto a current collector onto which a dense forest of carbon nanotubes had been directly grown. Preliminary results showed this approach to be a promising avenue for enhancing stability and confirm the detrimental role of the highly open porosity in the current collector.
An IR-corrected36 polarization curve of 46 wt% Pt-CNTs–CsH2PO4 is shown in Fig. 8, where the ohmic contribution is determined from the AC impedance behavior. The slope of the curve near 0 mV (1.2 Ω cm2 per electrode) is essentially identical to the area-normalized electrode resistance measured in AC impedance spectroscopy, showing consistency between the two methods. The DC behavior is remarkably linear, and stands in stark contrast to what would be expected for Butler–Volmer kinetics.37 Even accounting for the fact that proton reduction occurs at one electrode and hydrogen oxidation at the other in these experiments, conventional electrochemical theory predicts a non-linear response with decreasing instantaneous resistance as current increases. Where oxidation and reduction have been probed separately at the Pt|CsH2PO4 interface, the polarization curve is also rather linear, but reveals slight asymmetry with reduction being more facile than oxidation.11 The observed linearity suggests that perhaps electron or ion transport to/from the reaction sites (ohmic processes) may be rate-limiting as opposed to the electrochemical reaction itself, but no further evidence is available in support of this hypothesis. Furthermore, it is unknown whether the anodic reaction occurs via direct electrochemical reaction of H2O (to generate oxygen and protons) or oxidation of H2 also supplied to the anode. Returning to the performance characteristics, the current density reaches an attractive value of 42 mA cm−2 at only 0.1 V, where this voltage is the summed electrode overpotential and implies an average of 0.05 V per electrode. While further improvements are desirable and may be possible by increasing absolute Pt loadings as indicated above, these characteristics demonstrate the potential of Pt-CNT based electrodes for enhancing solid acid electrochemical cells for a range of applications from fuel cells and electrolyzers to hydrogen pumps and even sensors.
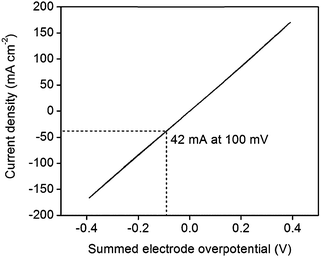 | ||
| Fig. 8 IR-corrected polarization curve of a 46 wt% Pt-CNT–CsH2PO4 composite electrode at 1 mV s−1, showing high current density at low overpotentials for both proton reduction and hydrogen oxidation. | ||
Conclusions
We have shown that Pt-decorated carbon nanotubes can be used to create electrodes with ultralow loadings of Pt that are capable of catalyzing both proton reduction and hydrogen oxidation at low overpotentials in solid acid electrochemical cells. Direct growth of Pt nanoparticles onto carbon nanotubes ensured minimal catalyst particle isolation, whereas electrospray deposition of electrolyte and electrocatalyst-bearing solutions led to composite electrode structures with uniformly distributed and size-matched components. Electrode impedance generally decreased with increasing Pt loading, while Pt utilization was largely independent of loading, remaining at a high value relative to previous studies. With this fabrication method, the Pt utilization has been increased by an order of magnitude over that of other composite electrodes formed of Pt and CsH2PO4. This dramatic improvement is likely a result of electrical access to all Pt particles in the structure. The lowest interfacial impedance attained here was 1.2 Ω cm2, achieved with a direct-composite electrode of 46 wt% Pt-CNT–CsH2PO4 in which the Pt loading was only 0.014 mg cm−1 of Pt. The DC polarization behavior revealed that a current density of 42 mA cm−2 can be obtained at the low overpotential of 0.1 V, or 0.05 V per electrode. If the Pt-decorated CNTs perform in a manner that maintains a high Pt utilization (∼80 S mg−1) in an electrode structure thicker than can be readily created by a single-nozzle electrospray process, one can reasonably anticipate that a target anode impedance of 0.05 Ω cm2 could be achieved with a Pt loading of only 0.25 mg cm−2. Moreover, further increases in activity may be possible by decreasing Pt nanoparticle sizes from the 9–14 nm employed here to the 3–6 nm sizes that are typical of polymer electrolyte membrane fuel cells. While the total electrode impedance obtained to date exceeds target values for technological implementation, the high Pt utilization achieved by electrospray deposition of Pt-CNT–CsH2PO4 composites points towards a clear path for moving solid acid electrochemical cells into a significant role in a sustainable energy future.Acknowledgements
This work was supported by the Dow-Bridge Program through the Resnick Sustainability Institute at Caltech, as well as by a Resnick Graduate Student Fellowship (R.E.U.). We thank Dr Tim Davenport, Michael Ignatowich, and Webster Guan for their assistance in TGA measurements, and Nate Thomas and Anupama Khan for their assistance in imaging. We also acknowledge Prof. George R. Rossman for his assistance with Raman Spectroscopy, Ben Myers from Northwestern University's Atomic and Nanoscale Characterization Experimental Center (NUANCE) for SEM imaging (Fig. 2). In addition, we acknowledge Caltech's Kavli Nanoscience Institute (KNI) for access to additional imaging instrumentation and the Molecular Materials Research Center at Caltech for the use of the Cahn C-35 Ultra-Microbalance.Notes and references
- S. M. Haile, Acta Mater., 2003, 51, 5981–6000 CrossRef CAS.
- J. Larminie, A. Dicks and M. S. McDonald, Fuel cell systems explained, Wiley, New York, 2003 Search PubMed.
- US Department of Energy, Fuel Cell Handbook, EEG&G Technical Services, Inc., 7th edn, 2004 Search PubMed.
- B. C. H. Steele and A. Heinzel, Nature, 2001, 414, 345–352 CrossRef CAS PubMed.
- A. Goñi-Urtiaga, D. Presvytes and K. Scott, Int. J. Hydrogen Energy, 2012, 37, 3358–3372 CrossRef.
- W. H. J. Hogarth, J. C. Diniz da Costa and G. Q. Lu, J. Power Sources, 2005, 142, 223–237 CrossRef CAS.
- S. M. Haile, D. A. Boysen, C. R. I. Chisholm and R. B. Merle, Nature, 2001, 410, 910–913 CrossRef CAS PubMed.
- A. B. Papandrew, C. R. I. Chisholm, R. A. Elgammal, M. M. Özer and S. K. Zecevic, Chem. Mater., 2011, 23, 1659–1667 CrossRef CAS.
- A. B. Papandrew, D. L. Wilson, N. M. Cantillo, S. Hawks, R. W. Atkinson, G. A. Goenaga and T. A. Zawodzinski, J. Electrochem. Soc., 2014, 161, F679–F685 CrossRef CAS.
- S. M. Haile, H. Liu and R. A. Secco, Chem. Mater., 2003, 15, 727–736 CrossRef.
- K. A. Sasaki, Y. Hao and S. M. Haile, Phys. Chem. Chem. Phys., 2009, 11, 8349–8357 RSC.
- D. A. Boysen, T. Uda, C. R. Chisholm and S. M. Haile, Science, 2004, 303, 68–70 CrossRef CAS PubMed.
- S. M. Haile, C. R. I. Chisholm, K. Sasaki, D. A. Boysen and T. Uda, Faraday Discuss., 2007, 134, 17 RSC.
- T. Uda and S. M. Haile, Electrochem. Solid-State Lett., 2005, 8, A245–A246 CrossRef CAS.
- C. R. I. Chisolm, D. A. Boysen, A. B. Papandrew, S. Zecevic, S. Y. Cha, K. A. Sasaki, A. Varga, K. P. Giapis and S. M. Haile, Electrochem. Soc. Interface, 2009, 3, 53–59 Search PubMed.
- Personal communication with SAFCell, Inc.
- M. W. Louie and S. M. Haile, Energy Environ. Sci., 2011, 4, 4230 CAS.
- V. N. Morozov, in Nano/Micro Biotechnology, ed. I. Endo and T. Nagamune, Springer, Berlin Heidelberg, 2010, vol. 119, ch. 44, pp. 115–162 Search PubMed.
- A. Varga, N. A. Brunelli, M. W. Louie, K. P. Giapis and S. M. Haile, J. Mater. Chem., 2010, 20, 6309 RSC.
- A. Varga, M. Pfohl, N. A. Brunelli, M. Schreier, K. P. Giapis and S. M. Haile, Phys. Chem. Chem. Phys., 2013, 15, 15470–15476 RSC.
- T. Matsumoto, T. Komatsu, H. Nakano, K. Arai, Y. Nagashima, E. Yoo, T. Yamazaki, M. Kijima, H. Shimizu, Y. Takasawa and J. Nakamura, Catal. Today, 2004, 90, 277–281 CrossRef CAS.
- K. Lee, J. Zhang, H. Wang and D. P. Wilkinson, J. Appl. Electrochem., 2006, 36, 507–522 CrossRef CAS.
- W. Zhang, P. Sherrell, A. I. Minett, J. M. Razal and J. Chen, Energy Environ. Sci., 2010, 3, 1286–1293 CAS.
- B. Xue, P. Chen, Q. Hong, J. Lin and K. L. Tan, J. Mater. Chem., 2001, 11, 2378–2381 RSC.
- A. W. Hull, Phys. Rev., 1921, 17, 571–588 CrossRef CAS.
- A. L. Patterson, Phys. Rev., 1939, 56, 978–982 CrossRef CAS.
- Y. Mu, H. Liang, J. Hu, L. Jiang and L. Wan, J. Phys. Chem. B, 2005, 109, 22212–22216 CrossRef CAS PubMed.
- M. S. Dresselhaus, G. Dresselhaus, R. Saito and A. Jorio, Phys. Rep., 2005, 409, 47–99 CrossRef.
- P. Chen, X. Wu, J. Lin and K. L. Tan, J. Phys. Chem. B, 1999, 103, 4559–4561 CrossRef CAS.
- Y. Xing, J. Phys. Chem. B, 2004, 108, 19255–19259 CrossRef CAS.
- Z. Q. Tian, S. P. Jiang, Y. M. Liang and P. K. Shen, J. Phys. Chem. B, 2006, 110, 5343–5350 CrossRef CAS PubMed.
- P. K. Shen and Z. Tian, Electrochim. Acta, 2004, 49, 3107–3111 CrossRef CAS.
- R 1 is the resistance from the electrolyte, while R2 is the resistance related to the catalysis at the electrode. The constant phase element, CPE, models the behavior of an imperfect capacitor at the electrode surface. Inductance from the wire connections was evaluated (L < 10−8 H) and subtracted from the raw data before the final fitting to a R1–R2CPE circuit.
- S. Kochowski and K. Nitsch, Thin Solid Films, 2002, 415, 133–137 CrossRef CAS.
- L. F. Kirpichnikova, A. A. Urusovskaya and V. I. Mozgovoi, JETP Lett., 1995, 62, 638–641 Search PubMed.
- IR correction was completed by subtracting the resistance of the electrolyte membrane, R1.
- A. J. F. Bard and R. Larry, Electrochemical Methods: Fundamentals and Applications, John Wiley & Sons, New York, 2001 Search PubMed.
Footnote |
| † Electronic supplementary information (ESI) available. See DOI: 10.1039/c4sc03003f |
| This journal is © The Royal Society of Chemistry 2015 |


