
 Open Access Article
 This Open Access Article is licensed under a Creative Commons Attribution-Non Commercial 3.0 Unported Licence
Ion structure controls ionic liquid near-surface and interfacial nanostructure†
Aaron
Elbourne
a,
Kislon
Voïtchovsky
b,
Gregory G.
Warr
c and
Rob
Atkin
*a
aDiscipline of Chemistry, University of Newcastle, NSW 2308, Callaghan, Australia. E-mail: rob.atkin@newcastle.edu.au
bDepartment of Physics, Durham University, Durham, England, UK
cSchool of Chemistry, University of Sydney, NSW 2006, Australia
First published on 29th October 2014
Abstract
A unique, but unifying, feature of ionic liquids (ILs) is that they are nanostructured on the length scale of the ions; in many ILs well-defined polar and apolar domains exist and may percolate through the liquid. Near a surface the isotropic symmetry of the bulk structure is broken, resulting in different nanostructures which, until now, have only been studied indirectly. In this paper, in situ amplitude modulated atomic force microscopy (AM-AFM) has been used to resolve the 3-dimensional nanostructure of five protic ILs at and near the surface of mica. The surface and near surface structures are distinct and remarkably well-defined, but are very different from previously accepted descriptions. Interfacial nanostructure is strongly influenced by the registry between cations and the mica surface charge sites, whereas near surface nanostructure is sensitive to both cation and anion structure. Together these ILs reveal how interfacial nanostructure can be tuned through ion structure, informing “bottom-up” design and optimisation of ILs for diverse technologies including heterogeneous catalysis, lubrication, electrochemical processes, and nanofluids.
Introduction
When a bulk liquid is placed in contact with a solid, their common physical boundary is referred to as the interface. Although idealised as a two-dimensional surface, the interface is in fact a region that may be many molecular (or ionic) layers thick. The structure, properties and dynamics of liquid interfaces are critical for many important chemical, physical and environmental processes including energy storage, surface coatings and food preparation.1 Molecular liquid interfaces are experimentally and theoretically well understood1–3 which has enabled optimisation of interface dependent processes. However, the structure of ionic liquid (IL) interfaces is not as well described, especially the lateral structure parallel to the interface. This lack of understanding means that, despite their “designer liquid”4,5 pedigree, the structure of IL interfaces cannot be optimised a priori for a given application.Ionic liquids (ILs) are pure salts that have melting points less than 100 °C.6–14 ILs have attracted considerable scientific interest15–18 due to their remarkable physicochemical properties which often include large electrochemical windows,19,20 negligible vapour pressures6,8 and thermal stability.21 ILs are classified as protic or aprotic based on the synthesis method.21 Radiation scattering experiments22–24 and molecular dynamic (MD) simulations25 have shown that aprotic ILs with alkyl chains 4 carbon units or longer have well-defined bulk nanostructures.25,26 For protic ILs, cation alkyl chains as short as C2 can be nanostructured.27
Nanostructure is the key to understanding many of the unusual bulk liquid and solvent properties of ILs,8 but is especially significant at solid surfaces.28 Nanostructure arises in the bulk because strong electrostatic attractions between cation charge groups and anions induce them to associate into charged regions. Cation alkyl chains are solvophobically excluded from these charged regions and sequestered into apolar domains.27 The polar and apolar domains form a bicontinuous network that percolates through the IL bulk, frequently in a sponge-like (L3) structure.27 The presence of a macroscopic interface breaks the isotropic symmetry of the IL bulk obliging a different, but related, interfacial structure to form. In addition to specific structuring of the surface layer of ions, near-surface ordering occurs which propagates into the IL phase by at least several nanometers.28,29 Based on AFM force curves, we have previously hypothesised that near a surface the bulk sponge structure is oriented into a lamellar-like arrangement of alternating polar and non-polar domains normal to the surface,28 similar to near-surface lamellar structures observed for aqueous surfactant sponge phases near solids. Similar layered structures were also observed at the IL–air interface by X-ray reflectivity measurements.30,31 Here however, the layering was found to be inconsistent with complete segregation of polar and non-polar domains. Recent scanning probe microscopy experiments have suggested that ILs have heterogeneous nanostructure laterally parallel to, as well normal to, the solid interface.32–37
Numerous simulation studies have predicted the lateral structure of surface bound ion layers at bulk IL–solid interfaces on the scale of the ions.38–51 However, experimental data validating these simulations is scarce,33 or of limited applicability because of concessions that must be made to achieve high resolution. Scanning tunnel microscopy (STM) has traditionally been used to achieve high resolution images of solid–IL interfaces. However, at bulk solid–IL interfaces, atomic resolution cannot be realised because the strong interfacial IL structure interferes with the STM signal.52,53 To compensate, monolayers37,54 and UHV/frozen monolayers35,36 have been studied, and molecular resolution has been achieved. However, the ion arrangements in these environments are expected to differ substantially from a bulk IL interface, because in a monolayer the relative concentration of the ions is fixed at 1![[thin space (1/6-em)]](https://www.rsc.org/images/entities/char_2009.gif) :1 and because the ions are necessarily in contact with the solid surface and gas (vacuum) phase simultaneously, rather than surface and bulk liquid.
:1 and because the ions are necessarily in contact with the solid surface and gas (vacuum) phase simultaneously, rather than surface and bulk liquid.
Prior studies of the lateral structure of solid–IL interfaces have focused essentially exclusively on the ion layer in contact with the solid surface in both experimental35–37 and simulation studies.38,40,42 We have previously used contact mode AFM imaging to probe the lateral structure of the EAN–mica and PAN–mica interfaces.32,34 These contact mode images revealed a repeating distance in the surface bound ion layer different to that of the underlying mica lattice, but the appearance of the EAN and PAN surface bound layers was quite similar, i.e. no effect of ion structure on interfacial morphology was apparent. We have recently shown that amplitude modulated atomic force microscopy (AM-AFM) is able to reveal the structure of both the surface bound and near surface ion layers with near molecular resolution for an aprotic ionic liquid on mica, and PAN on graphite.33,34 The resolution afforded by AM-AFM enables the study presented here, which elucidates the effect of ion structure on the morphology of the surface bound, and near surface, IL layers.
In this paper we use AM-AFM to examine how changing cation and anion structure in a set 5 protic ILs affects the surface layer and near surface structure of the IL–mica interface. The interfacial and near surface IL nanostructure are both found to be strongly influenced primarily by the registry between cation and the surface charge sites in the mica lattice, but the near surface structure is also determined by the bulk nanostructure, which is sensitive to both ions. 3-dimensional characterisation of these solid–IL interfaces at the nanoscale level will unlock the full designer potential of ILs for interface dependant processes.19,55–58
Methods
All ILs investigated in this research were made via a 1:1 molar acid-base reaction. Ethylammonium nitrate (EAN), propylammonium nitrate (PAN), and ethanolammonium nitrate (EtAN) were synthesised via slow addition of concentrated nitric acid (HNO3) (AJAX Finechem Pty. Ltd, 70% w/w) to a chilled solution (<10 °C) of hydrogenous ethylamine (Aldrich 68% w/w%), propylamine (Aldrich 99% w/w%) and ethanolamine (Sigma-Aldrich 99% w/w%), respectively, and milli-Q water. Ethylammonium formate (EAF) and N,N-dimethylethylammonium formate (DMEAF) were synthesised via a slow addition of concentrated formic acid (HCOOH) (Sigma-Aldrich ≤95% w/w%) to a chilled solution (<5 °C) of ethylamine (Aldrich 68% w/w%) and N,N-dimethylethylamine (Aldrich 99% w/w%), respectively. During the acid addition, the mixtures were stirred rapidly, in ice, to ensure dispersal of any heat generated.
Firstly, for purification, the resultant solutions were rotary evaporated for several hours; EAN, PAN and EtAN were heated to 40 °C, while EAF and DMEAF were heated to <30 °C, to avoid formation of amide impurities. All samples were thoroughly purged with nitrogen to prevent impurity formation (nitrous oxides or amides). The nitrate ILs were then heated overnight in an oil bath at 105 °C under a nitrogen atmosphere to remove remaining water. The formate ILs were not heated, to stop amide formation, and instead stirred under ultrahigh vacuum for several hours to remove excess water. The water content of the nitrate ILs was undetectable by Karl Fisher titration prior to experimentation (<0.01 v/v%) and the formate ILs water content was <0.05 wt%. Mica (muscovite) (Brown Co., Sydney) was prepared, just before experimentation, using adhesive tape to cleave along the silicates basal plane. The freshly cleaved mica was therefore atomically smooth and clean.
The ILs were studied using an Asylum Research Cypher Atomic Force Microscope (Cypher AFM). All data was obtained at a constant temperature of 25 °C. All images and force spectroscopy profiles were obtained via AM-AFM with the cantilevers oscillating at (or close to) resonant frequency. In force spectroscopy experiments, because it is the variation in phase and amplitude that is monitored, rather than the tip deflection like in a contact mode AFM experiment, it is possible to move the tip to separations less than zero. When this is done, the tip strikes the surface increasingly more energetically and the phase and amplitude respond in unpredictable (and physically meaningless in terms of liquid structure) ways. As a consequence data obtained for separations less than zero is not shown.
Cantilevers with varying stiffness were employed to explore the near surface and innermost surface structure of the IL–mica interfacial layers. The softer cantilevers (BL-AC40TS, Olympus, Japan, nominal spring constant kc = 0.25 N m−1) were used to image the outer layers of the IL-mica interface, further away from the mica substrate (near-surface structure). Stiffer cantilevers (ArrowUHFAuD, NanoWorld, Switzerland, nominal spring constant kc = 6 N m−1) were utilised to image IL layers closer to, and in contact with, the mica surface (innermost surface structure). Each cantilever was calibrated using its thermal spectrum in IL prior to imaging and the lever sensitivity determined using force spectroscopy.
Cantilever tips were irradiated with UV light for 15 minutes prior to experimentation to remove organic contaminants. Scan sizes for amplitude/phase vs. distance curves were between 20 nm and 30 nm at rates between 0.05 and 0.2 Hz. The experiments were completed in a droplet exposed to the atmosphere within the AFM box (a sealed enclosure). As the ILs are hygroscopic, the water content of the liquid will increase over the course of an experiment. However, the water content was routinely checked after an experiment. Even after 4 hours the water content never exceeded 3 wt%. The data presented in this paper was obtained after no more than 30 minutes of the IL droplet being placed on the mica. Karl Fischer titration of the ILs collected from the cell after this time period had a value of no more than ∼1 wt% which depended slightly on the ambient humidity, so the water concentration in the data presented is <1%. The features, of all images presented, rotated as the scan angle was changed and scaled correctly with scan size, confirming they are not imaging artifacts.
Results
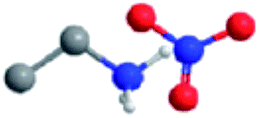
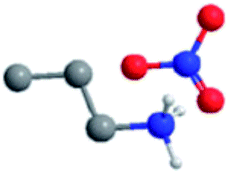
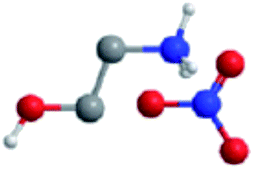
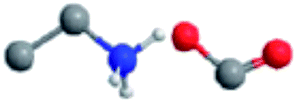
The ILs examined are ethylammonium nitrate (EAN), propylammonium nitrate (PAN), ethanolammonium nitrate (EtAN), ethylammonium formate (EAF) and dimethylethylammonium formate (DMEAF), cf.Table 1. This set of ILs has been selected to elucidate relationships between cation and anion type and near surface nanostructure, and because their bulk structures have been well characterised previously,27,59 except for DMEAF, which assists with interpretation of the topographic images and enables direct comparison of the bulk and interfacial nanostructures.| Ionic liquid | Structure | D (nm) | D* (nm) | ρ (g cm−3) | MP (°C) | η (mPa s) |
|---|---|---|---|---|---|---|
| Ethylammonium nitrate (EAN) |
|
0.53 (ref. 61) | 1.01 (ref. 27) | 1.21 (ref. 61) | 13 (ref. 61) | 35.9 (ref. 62) |
| Propylammonium nitrate (PAN) |
|
0.56 (ref. 61) | 1.19 (ref. 63) | 1.16 (ref. 61) | 3.5 (ref. 61) | 89.3 (ref. 62) |
| Ethanolammonium nitrate (EtAN) |
|
0.54 (ref. 61) | 0.82 (ref. 27) | 1.26 (ref. 61) | −25.2 (ref. 61) | 156 (ref. 62) |
| Ethylammonium formate (EAF) |
|
0.53 (ref. 61) | 1.00 (ref. 59) | 0.99 (ref. 61) | −15 (ref. 61) | 23.1 (ref. 62) |
| Dimethylethylammonium formate (DMEAF) |
|
0.57 (ref. 61) | N/A | 1.03 (ref. 61) | — | 9.8 (ref. 62) |
In an AM-AFM force spectroscopy experiment the cantilever (k ≈ 6 N m−1) is excited using a piezoelectric crystal.60 The tip oscillates at a frequency close to, or at, the cantilevers resonant frequency with set amplitude. Force spectroscopy experiments for the 5 ILs are shown in Fig. 1 column 1. As the tip is moved towards the surface, the phase and amplitude of the tip oscillation are recorded as a function of separation. In these ILs, the phase and amplitude change in response to the liquid compressibility between the tip and the surface.
 | ||
| Fig. 1 Interfacial data collected for the PAN–, EAN–, EtAN–, EAF– and DMEAF– mica systems. Column 1 shows typical amplitude (dotted) and phase (black) data recorded as an oscillating AFM tip approaches a mica substrate immersed in IL. The x-axis measures the extension of the AFM Z piezo. Steps tend to be less clear in the amplitude data. Arrows indicate the direction of the axis. Column 2 shows topographic images of the ILs innermost ion layer adsorbed to a mica surface. The insets show the 2 dimensional Fourier transforms. Column 3 shows topographic images of the first near-surface layer of the IL–mica systems. Section analysis of the near-surface structure as indicated by the blue line are shown as insets to the images. The slow scan direction of all images is down the image. | ||
For all the ILs the phase and amplitude are both almost constant at the pre-set (bulk liquid) values when the tip–surface separation is greater than ∼3 nm. This reveals that the tip is, on average, insensitive to the bulk liquid nanostructure. As the separation is decreased below ∼3 nm, the phase and amplitude both decrease as the tip oscillation is dampened. Coarsely, this is a consequence of reduced effective compressibility of the liquid due to the confining effect of the solid substrate. The decreasing region in the phase and amplitude data leads into a plateau at separations close to zero. The signals become constant because the tip pushes against matter it cannot displace. By convention, this distance is defined as zero separation. However, in any AFM experiment the true zero position, which denotes tip–surface contact, is not known. We have previously suggested that, for most protic ILs, at zero separation the tip is in contact with cations electrostatically bound the mica substrate so strongly that they cannot be displaced28 and, as such, the tip surface distance is referred to as the “apparent separation”.
For all the ILs examined, the change in both amplitude and phase as the tip moves from the bulk liquid to surface contact decreases as the effective liquid viscosity increases. For example, the phase and amplitude for EAN decrease by 12° and ∼0.24 nm, whereas for EtAN the phase decreases by only 6° and the amplitude by ∼0.04 nm. This is because high viscosity (Table 1) tends to overdamp the cantilever oscillation already in the bulk liquid, weakening the observed damping change observed at the interface, when compared to less viscous liquids.
The phase and amplitude signals derived from spectroscopy usually exhibit periodic oscillations as the tip moved closer to the mica. These oscillations are indicated by the dashed vertical lines in Fig. 1 (first column). In each case, the oscillation period is the same as the step size measured with standard force-distance curves (non-vibrating tip),28,64 and force oscillation in SFA data.29 For all ILs examined except EtAN the oscillations are clearer in the phase data than the amplitude data. For EtAN, the high viscosity of the liquid over-dampens tip oscillations resulting in the amplitude signal being more sensitive to liquid compressibility than the phase.34
For EAN, there are three clear oscillations in the phase data spaced 0.5 nm apart. This period is consistent with the ion pair dimension (D, cf.Table 1). The magnitude of the oscillation increases closer to the surface which is a consequence of more pronounced liquid nanostructure and confinement effects. For PAN, the oscillations are more intense (compared to the noise level in the data at wide separations), their number is increased to 4 or 5, and the period is larger at ∼0.6 nm. These results are consistent with the bulk structure of PAN being stronger (better defined) than EAN due to the longer alkyl chain of PAN producing stronger solvophobic segregation.63 There are fewer oscillations in the force spectroscopy data for EAF than EAN and PAN, and those that are present are less well defined. This is consistent with prior contact mode AFM force curves and is attributed to the reduced number of hydrogen bond acceptor atoms on formate compared to nitrate, leading to lower liquid cohesion in the polar domains.64 Four clear oscillations ∼0.5 nm apart are present in the EtAN phase data, similar to EAN, and consistent with earlier force data.64 For DMEAF, only one, strong oscillation is present, with a possible second peak further from the surface. Contact mode AFM force curves similarly revealed only one step, and on the basis of the step width it was hypothesized that for this liquid (and this liquid only) the tip was able to displace the surface bound cations and move into contact with the mica surface.64 This argument holds for the force spectroscopy data present here. The ability of the AFM tip to move into contact with the mica in DMEAF, but not with the primary ammonium cations, is a consequence of weaker electrostatic attractions between the cation and the surface; steric hindrance around the charged nitrogen atom means that DMEA+ cannot approach surface charge sites as closely as the primary ammonium ions. The weak decrease in amplitude observed between 2 nm and 5 nm for DMEAF was consistent across multiple experiments with different tips. Amplitude data extending 15 nm from the surface is shown in ESI Fig. 1.† For separations greater than 10 nm the amplitude is constant. This point is expanded upon below.
Imaging of the surface or near-surface structure in AM-AFM mode is achieved by imposing to the cantilever a set working amplitude (A), or ‘setpoint’, lower than its free amplitude (A0). This is realised by a feedback loop that constantly re-adjusts the average tip-sample distance. As the sample is scanned line by line, a topographic image can be obtained from the corrections imposed by the feedback loop. Here we typically used A/A0 ≥ 0.7, with the cantilever's free amplitude (A0) on the order of ∼1 nm. In these conditions the AFM tip can probe near-surface or surface-adsorbed ions (depending on the cantilever spring constant) without directly interacting with the substrate.65 Stiff cantilevers (k ≈ 6 N m−1) allowed the structure of the innermost layer of surface bound ions to be probed with minimal interference from the relatively delicate near surface IL structure.
10 nm × 10 nm AM-AFM topographic images of the IL–mica innermost layer obtained with stiff cantilevers are shown in Fig. 1 column 2. For all images except for DMEAF, a regular lattice structure is apparent, on which is superimposed a much longer-range and less regular superstructure. The hexagonal symmetry of this lattice is most easily seen in the Fourier transforms of all images, reflecting a repeat spacing of ∼0.5 nm, and consistent with that of the mica lattice (0.52 nm),66 within experimental error. Together, these results strongly suggest that the lattice is a consequence of cations electrostatically bound to mica charged sites.
The innermost layer of DMEAF is very different. Like the other ILs, the layer clearly exhibits lateral structure, but the features are much less regular and there is a complete absence of larger-scale superstructure. In some areas short, meandering rows are present, while in other areas individual white dots suggest the presence of isolated bound ions, and black dots or holes where the ion has been displaced from the surface. The less regular structure for DMEAF is likely a consequence of cation steric hindrance.30 The additional N-methyl group of DMEAF mean that it cannot pack as neatly into the surface layer as the primary ammonium which, combined with electrostatic interaction being weaker, means that the mica templates the adsorbed structure less strongly. This is consistent with previous force measurements that indicated that DMEAF is more easily displaced from the mica surface than the primary ammoniums,64 and therefore that the images all reflect the innermost ion layer adjacent to the mica surface.
The clarity with which the cation lattice structure is seen in these images depends on the extent of interference by the near surface superstructure: it is clearest for EAF because liquid cohesion is lower in this liquid compared to nitrate ILs, as also seen in the force spectroscopy. The near surface ions are thus readily displaced by the cantilever, leaving little evidence of superstructure, and here the three directions of the underlying lattice are clearest, which produces the 6 symmetry points in the FFT inset. In EAN, PAN and EtAN, the presence of an underlying lattice is clearly visible, but details are increasingly obscured by the near-surface superstructure. Symmetry points can be identified in the FFTs that suggest hexagonal symmetry for all the nitrate ILs, although some are difficult to discern for EAN and PAN because the prominent near surface structure introduces additional features into the FFT. The increased prominence of near surface nanostructure in the nitrate ILs is attributed to stronger liquid cohesion, and is again reflected in the force spectroscopy results.
Fig. 1 column 3 shows 20 nm × 20 nm AM-AFM images in which the near surface structure has been isolated with soft cantilevers. The features in these images are larger and substantially less regular than those in the innermost layer shown in column 2, and also differ markedly between ILs. In these topographic images the light and dark areas correspond to raised and depressed areas, respectively; the light areas indicate relatively immobile (firm) liquid domains near the surface, while the dark regions indicate mobile (softer) domains in which the tip oscillates with greater amplitude until it approached the surface and its motion is damped.67 For each IL (except perhaps DMEAF) the areas of the mobile and immobile domains in a given image are approximately equal. The average sizes of the firm domains for EAN, PAN and EtAN were determined by measuring the length of the structures in 4 directions in three different images, obtained with different tips. The aggregate size was consistent between different tips, making a reverse imaging effect unlikely. Histograms of this data are presented in the ESI as Fig. 2–4† representing the lateral dimensions of the raised (light) sections. All the histograms show some degree of leptokurtosis. This is a signature of amphiphilic self-assembly, and has been observed previously for aqueous surfactant systems.68
For EAN, the firm structures in the near surface layer have an average lateral diameter of ∼1.2 nm and extend ∼1 nm normal to the interface. For PAN, the size of the structure increases to, on average, ∼2 nm laterally and ∼1.5 nm normally. For both liquids, these dimensions are too large to attribute to individual ions or ion pairs. The near surface structure is quite different for EtAN; the stretched appearance (in the direction indicated by the arrow) also suggests image distortion, which we attribute to the high liquid viscosity (cf.Table 1). For EtAN lateral dimensions were only measured at 90° to the direction of the distortion, giving an average lateral dimension of 1.4 nm. The normal dimension of ∼1 nm is similar to the other ILs. For EAF, although extended superstructure is present, it is only ∼0.35 nm high, which is approximately the length of the ethylammonium cation.28 For DMEAF, the near surface layer shows little or no long-range lateral structure, in accordance with the weak structure in its innermost layer and the force spectroscopy data.
Discussion
The images of the innermost ion layer (Fig. 1 column 2), show the arrangements of cations electrostatically bound to the mica surface, which are relatively immobile. This means that as the tip scans these surface bound ions are held rigidly in place, while other ions in the near surface layer, that are not electrostatically bound to the surface but must be present on density grounds, are relatively mobile.All the primary ammonium ILs examined show an epitaxial innermost cation layer. This results from the strong electrostatic attractions of the small –NH3+ moiety with the surface site. The small cross-sectional area of these cations also allows unimpeded lateral packing in registry with the vacant potassium sites of the mica lattice, leading to the observed the 0.5 nm spacing between rows.66 The DMEA+ cation is much larger, which weakens binding by preventing close approach to individual surface sites, and also reduces lateral packing density. This frustration prevents epitaxial layer formation so that the innermost layer structure is weaker for this IL than for the primary ammonium ILs, and ions are aligned only weakly by mica's hexagonal lattice. Inspection of the DMEAF image (and its FFT) reveals that the spacing between features varies between ∼0.35 nm and ∼0.8 nm. 0.35 nm is consistent with the packing dimension of the DMEA+,64 while 0.8 nm is approximately equal to DMEA+ packing dimension plus the mica lattice dimension. This suggests that not every charged site on the mica surface is neutralized by a cation in the DMEAF innermost layer, consistent with frustrated packing and MD simulations of the aprotic ([CnCmim]+[NTf2]−)–mica interface.42 The residual charge of the mica surface will be neutralized by the near surface ion layers, as suggested previously for other ILs with larger cations on the basis of capacitance data.69 The weak decrease in the force spectroscopy amplitude data between 10 nm and 2 nm (cf. ESI Fig. 1†) may thus be a consequence of weak tip–surface electrostatic repulsions similar to, but shorter range than, those in recent reports results for aprotic ILs.70,71
In bulk protic ILs, electrostatic and hydrogen bonding interactions between charged groups and van der Waals attractions between cation alkyl chains cause a solvophobic nanosegregation into polar and apolar domains.27 These forces can lead to well defined nanostructures of differing morphologies within the bulk liquid,27,59,63 remnants of which are seen in the near surface layer structures shown in Fig. 1 column 3. As the cohesive forces between polar moieties are significantly stronger than those between alkyl groups, the stiff regions in the near surface structure (Fig. 1 column 3) correspond to polar domains and the soft regions to apolar domains.
In the bulk liquid, EAN and PAN both have sponge-like nanostructures with periodicities near twice their ion-pair dimension (see Table 1).27 The longer alkyl group of PAN means that repeat spacing is larger, but that solvophobic exclusion is also stronger, so that polar and apolar domains are better segregated.27 These features are both reflected in the images in column 3, where the contrast and differentiation between the mobile and immobile regions is greater for PAN than for EAN, and the height range is also greater for PAN than EAN. The height of these near surface domains is significantly greater than the ion pair dimension, but comparable with bulk periodicity. For both liquids, the average lateral size of the domains in the near surface layer is significantly greater than those in the bulk liquid, which by definition must be less than the repeat spacing (cf.Table 1). This suggests, therefore, that the near surface IL structure represents a compromise structure between the bulk liquid and the surface layer. This may be described as a flattening and lateral extension of the bulk structure similar to that which occurs for adsorbed aqueous surfactant micelles.3 Immediately adjacent to the surface this can be conceptualised as additional IL cations associating solvophobically with the surface bound layer, forming laterally-extended polar surface domains. These large, flat polar domains decay into the smaller, more highly-curved bulk nanostructure as the distance from the interface increases.
The stiffest parts of the near surface nanostructure of EAN and PAN remain visible even when the harsh imaging conditions used to study the innermost layer are employed, i.e. the superstructure that covers parts of the innermost layer is a consequence of strongly associated near surface domains. This is more prevalent for PAN than EAN because liquid cohesion is higher (compare also the viscosities in Table 1) due to the longer alkyl chain of PAN producing stronger solvophobic segregation.
Both the bulk liquid structure and surface layer structure of EAF and EAN are very similar,59 so we would expect similar near surface structures for these two ILs. The lateral size of the polar domains of near surface EAF shown in Fig. 1 column 3 are similar to EAN, but the contrast and corresponding height profiles are lower. Although this suggests that near surface structure is much more pronounced for EAN than for EAF, this is more likely a consequence of the AM-AFM imaging mechanism; liquid cohesion is lower in EAF than EAN (e.g. the viscosity of EAF is lower than EAN, cf.Table 1) because formate has one less H-bond acceptor site compared to nitrate. This means that the interfacial structures are more readily compressed/displaced by the AFM tip and the resultant contrast between polar and apolar domains is lower. While this is a disadvantage for studying the near surface structure, the same property allows the underlying innermost layer of EAF to be imaged more clearly.
The hydroxyl group on the end of the cation alkyl chain in EtAN increases hydrogen bond network capacity through both donor and acceptor sites, and reduces its amphiphilic character. In the bulk, this leads to a clustered morphology27 rather than the sponge-like nanostructures seen in primary alkylammonium ILs. There is no evidence for IL clusters in the near surface layer of EtAN; rather, the nanostructure is similar to the other primary alkylammonium ILs examined, but appears distorted (diagonally stretched). The corresponding superstructure seen in the innermost layer of EtAN (centre column), which is also due to near surface structure, is not similarly distorted, however. The stiff cantilevers used for these experiments are expected to be less affected by the high viscosity of EtAN than those used for near-surface imaging. However, in EtAN the near surface superstructure hides the underlying rows less effectively than EAN and PAN; the structure is fairly clear even in the raised regions of EtAN. These results suggest that the near surface structure of EtAN is thinner than either EAN or PAN, which is consistent with reduced amphiphilicity and cation structure.
The bulk liquid structure of DMEAF has not previously been described in detail, but SAXS/WAXS data (cf. ESI Fig. 5†) shows no evidence of the pre-peak72,73 signature of amphiphilic nanostructure seen in EAN, EAF and PAN.59 This is consistent with the absence of structure in previous contact mode AFM force curves64 so it is expected to be relatively unstructured in bulk, like a classical molten salt. This is consistent with the near surface structure for DMEAF, which is quite similar to that obtained for the innermost layer (note the different scales in the two images), except that the templating effect of the mica substrate is essentially lost. The heterogeneity in this image is thus primarily a consequence of individual ions and ion pairs.
Current descriptions of the near surface structure of ILs primarily relates to their surface normal structure, and are derived from AFM28 and surface force apparatus (SFA) measurements,74,75 together with simulations.76 The average cation and anion densities normal to the interface are understood to oscillate around their bulk values with a period equal to the ion pair dimension and an amplitude that decreases with distance from the substrate. This produces the steps in contact mode AFM and SFA force curves interpreted as being due to ion layers. The present results show that this interpretation is far too simplistic; near a solid surface, ILs have well-defined, three-dimensional nanostructures that are a consequence of the balance between ion packing constraints, the cohesive interactions between ions and the strength of the attraction between the ions and the surface. The near surface and bulk IL nanostructures are related insofar as the near surface nanostructure can also be tuned by varying the ion geometry and interactions.
The lateral structure of the ion layer in contact with the substrate32–34,43 is also sensitive to ion geometry, but its structure also dictates features of the near surface structure. As bulk structures25 and surface interactions77 of aprotic ILs are similar to those of protic ILs, it is likely that similar near surface structures are present in aprotic ILs; indeed, we have shown this to be the case for 1-ethyl-3-methylimidazolium bis(trifluoro-methylsulfonyl) imide.34
Revelations of pronounced near surface nanostructure radically changes our understanding of solid–IL interfaces, and will impact upon a wide range of IL–surface technologies. For processes where a solute must come into contact with the surface, such as heterogeneous catalysis,55 in dye solar cells,78 electrodeposition19 and capacitive charge storage,79 the solute must traverse the near surface structure and displace ions in the innermost layer to make contact with the surface. As solutes are generally solvated by either the polar or apolar phase the near surface structure may mean that the surface is not uniformly electrochemically (or catalytically) active. This impacts upon our understanding of the ionic liquid electrical double layer69 and may explain why applications employing an IL electrolyte sometimes perform below expectations.80–82 Using a sterically hindered ion like DMEA+ that binds to the surface weakly will mean the surface is available for reaction, but the weak or absent nanostructure may limit the solubility of strongly polar or apolar solutes.26
Because of their strong interactions with oppositely charged surfaces, favorable physical properties, and (perceived) layered interfacial structure, ILs have been identified as having considerable potential as lubricants and rheological fluids. Their tribological properties and fluid dynamics have been studied extensively at the nano-58 and macro-scales.83 Particularly at the nanoscale, lubricity has been interpreted using near surface ion layers58,77,84 which this work shows is too simplistic. At the very least, if layers are present when two macroscopic surfaces are only a few nanometers apart, the transition from curved interfacial nanostructure to ions layers upon compression should be considered as a mode of energy dissipation. In a recent study,85 the effect of ion structure on nanoscale friction for a silica colloid probe sliding over a mica surface was examined for a set of protic ILs similar to those investigated here. Friction was highest for C3 cations, intermediate for C2 cations, and lowest for DMEAF. This was primarily attributed to the strength of cohesive interactions between the innermost layer and the near surface layers decreasing in the same order, which reduces the energy required to expel “near surface IL multilayers” from the space between the probe and the surface during sliding. These imaging results show that uniform ion layers are not present at the mica interface, but that the near surface IL nanostructure becomes weaker in that order, which would similarly lower resistance to sliding as it is more readily expelled from the tip surface interstitial space. The lowest friction is thus detected from DMEAF because it has the weakest interfacial structure. However, sterically hindered cations like DMEAF can be displaced from the substrate at high force. This means the surfaces will come into contact, leading to wear and poor tribological performance.
In our earlier work28 as well as in subsequent studies,76,86 considerable variability in contact mode AFM force curves have been reported, even within a single experiment. While steps in the force curve are ubiquitous, their number, associated push through force and layer compressibility (whether they are vertical or tilted)28 varies, especially when an AFM tip is used rather than a large colloid probe particle. This variability is likely to be a consequence of whether the liquid between the tip and the surface is richer in the polar (immobile) or apolar (mobile) near surface nanostructure, which will change over time as the ions diffuse. While contact mode AFM and SFA force curve measurements are useful for understanding the interactions between the surface in an IL, they provide only a crude indication of the rich interfacial nanostructure that is present at the solid–IL interface.
Conclusions
The existence of nanostructure in the IL bulk was first predicted by molecular dynamic simulations26 and later confirmed by radiation scattering experiments.87 The structure of solid – IL interfaces has been well studied normal to the interface,28,86,88 but the lateral structure in the plane of the surface is much less well described for true bulk IL–solid interfaces, despite its key role for applications such as electrodeposition and lubrication. Molecular dynamic simulations38–51 have predicted the likely ion structure adsorbed to the substrate, but few papers have provided experimental confirmation of these results in situ with molecular resolution,28,89 and we are only aware of our own previous paper that has explicitly examined the lateral structure of near surface IL layers.32–34 The absence of reliable experimental data describing the evolution of IL interfacial morphology as the structure of the ions is changed has, until now, prevented tuning of interfacial IL nanostructure in the same way as can be done for the bulk. In this paper, in situ AM-AFM has revealed how the nanostructure of the mica–IL interface changes as a function of the cation alkyl chain length, the anion species, hydrogen bonding capacity, solvophobicity and steric hindrance of the cation charge group. The structure of the innermost ion layer is strongly affected by the registry between the cation and the mica charged sites, unless the cation is large and sterically hindered, but near surface nanostructure is sensitive to both cation and anion structure. The set of ILs examined reveals how interfacial nanostructure can be controlled through variation in the ion structure, which will enable optimisation of ILs for a range of applications including heterogeneous catalysis, lubrication and electrochemical processes.Acknowledgements
Paul FitzGerald (University of Sydney, Australia) is acknowledged for the DMEAF small angle X-ray scattering experiment. R.A. thanks the Australian Research Council Future Fellowship (FT120100313). This research was supported by an Australian Research Council Discovery Project (DP120102708) and Equipment Grant (LE110100235).References
- J. Israelachvili, Intermolecular and Surface Forces, Academic Press, 3rd edn, 2010 Search PubMed.
- R. M. Fitch, J. Polym. Sci., Polym. Lett. Ed., 1984, 22, 508–509 CrossRef.
- R. Atkin, V. S. J. Craig, E. J. Wanless and S. Biggs, Adv. Colloid Interface Sci., 2003, 103, 219–304 CrossRef CAS.
- T. L. Greaves, A. Weerawardena, C. Fong, I. Krodkiewska and C. J. Drummond, J. Phys. Chem. B, 2006, 110, 22479–22487 CrossRef CAS PubMed.
- R. Hayes, S. Z. El Abedin and R. Atkin, J. Phys. Chem. B, 2009, 113, 7049 CrossRef CAS PubMed.
- M. Freemantle, Chem. Eng. News, 1998, 76, 32–37 Search PubMed.
- D. R. MacFarlane and K. R. Seddon, Aust. J. Chem., 2007, 60, 3–5 CrossRef CAS.
- J. S. Wilkes, Green Chem., 2002, 4, 73–80 RSC.
- T. Torimoto, T. Tsuda, K. Okazaki and S. Kuwabata, Adv. Mater., 2010, 22, 1196–1221 CrossRef CAS PubMed.
- K. N. Marsh, J. A. Boxall and R. Lichtenthaler, Fluid Phase Equilib., 2004, 219, 93–98 CrossRef CAS PubMed.
- S. A. Forsyth, J. M. Pringle and D. R. MacFarlane, Aust. J. Chem., 2004, 57, 113–119 CrossRef CAS.
- M. J. Earle and K. R. Seddon, Pure Appl. Chem., 2000, 72, 1391–1398 CrossRef CAS.
- E. W. Castner and J. F. Wishart, J. Chem. Phys., 2010, 132, 9 CrossRef PubMed.
- S. Z. El Abedin and F. Endres, Acc. Chem. Res., 2007, 40, 1106–1113 CrossRef CAS PubMed.
- F. Endres, A. P. Abbott and D. R. MacFarlane, Electrodeposition from ionic liquids, Wiley-VCH, 2008 Search PubMed.
- R. D. Rogers, Nature, 2007, 447, 917 CrossRef CAS PubMed.
- R. D. Rogers and K. R. Seddon, Science, 2003, 302, 792–793 CrossRef PubMed.
- K. R. Seddon, J. Chem. Technol. Biotechnol., 1997, 68, 351–356 CrossRef CAS.
- F. Endres, Chem. Ing. Tech., 2011, 83, 1485–1492 CAS.
- F. Endres, N. Borisenko, R. Al Salman, M. Al Zoubi, A. Prowald, T. Carstens and S. Z. El Abedin, in Ionic Liquids Uncoiled, John Wiley & Sons, Inc., 2012, pp. 1–27, DOI: 10.1002/9781118434987.ch1 Search PubMed.
- T. Welton, Chem. Rev., 1999, 99, 2071–2083 CrossRef CAS PubMed.
- C. Hardacre, J. D. Holbrey, S. E. J. McMath, D. T. Bowron and A. K. Soper, J. Chem. Phys., 2003, 118, 273–278 CrossRef CAS PubMed.
- H. Christopher, S. E. J. McMath, N. Mark, T. B. Daniel and K. S. Alan, J. Phys.: Condens. Matter, 2003, 15, S159 CrossRef.
- C. Hardacre, J. D. Holbrey, M. Nieuwenhuyzen and T. G. A. Youngs, Acc. Chem. Res., 2007, 40, 1146–1155 CrossRef CAS PubMed.
- J. N. A. Canongia Lopes and A. A. H. Padua, J. Phys. Chem. B, 2006, 110, 3330–3335 CrossRef CAS PubMed.
- A. A. H. Pádua, M. F. Costa Gomes and J. N. A. Canongia Lopes, Acc. Chem. Res., 2007, 40, 1087–1096 CrossRef PubMed.
- R. Hayes, S. Imberti, G. G. Warr and R. Atkin, Phys. Chem. Chem. Phys., 2011, 13, 3237–3247 RSC.
- R. Atkin and G. G. Warr, J. Phys. Chem. C, 2007, 111, 5162–5168 CAS.
- R. G. Horn, D. F. Evans and B. W. Ninham, J. Phys. Chem., 1988, 92, 3531–3537 CrossRef CAS.
- D. Wakeham, A. Nelson, G. G. Warr and R. Atkin, Phys. Chem. Chem. Phys., 2011, 13, 20828–20835 RSC.
- P. Niga, D. Wakeham, A. Nelson, G. G. Warr, M. Rutland and R. Atkin, Langmuir, 2010, 26, 8282–8288 CrossRef CAS PubMed.
- A. Elbourne, J. Sweeney, G. B. Webber, E. J. Wanless, G. G. Warr, M. W. Rutland and R. Atkin, Chem. Commun., 2013, 49, 6797–6799 RSC.
- A. J. Page, A. Elbourne, R. Stefanovic, M. A. Addicoat, G. G. Warr, K. Voitchovsky and R. Atkin, Nanoscale, 2014, 6, 8100–8106 RSC.
- J. J. Segura, A. Elbourne, E. J. Wanless, G. G. Warr, K. Voitchovsky and R. Atkin, Phys. Chem. Chem. Phys., 2013, 15, 3320–3328 RSC.
- F. Buchner, K. Forster-Tonigold, B. Uhl, D. Alwast, N. Wagner, H. Farkhondeh, A. Groß and R. J. Behm, ACS Nano, 2013, 7, 7773–7784 CrossRef CAS PubMed.
- B. Uhl, T. Cremer, M. Roos, F. Maier, H.-P. Steinruck and R. J. Behm, Phys. Chem. Chem. Phys., 2013, 15, 17295–17302 RSC.
- T. Waldmann, H.-H. Huang, H. E. Hoster, O. Höfft, F. Endres and R. J. Behm, ChemPhysChem, 2011, 12, 2565–2567 CrossRef CAS PubMed.
- R. S. Payal and S. Balasubramanian, ChemPhysChem, 2012, 13, 3085–3086 CrossRef CAS PubMed.
- R. S. Payal and S. Balasubramanian, ChemPhysChem, 2012, 13, 1764–1771 CrossRef PubMed.
- D. Dragoni, N. Manini and P. Ballone, ChemPhysChem, 2012, 13, 1772–1780 CrossRef CAS PubMed.
- N. Sieffert and G. Wipff, J. Phys. Chem. C, 2008, 112, 19590–19603 CAS.
- P. Rajdeep Singh and B. Sundaram, J. Phys.: Condens. Matter, 2014, 26, 284101 CrossRef PubMed.
- K. Shimizu, A. Pensado, P. Malfreyt, A. A. H. Padua and J. N. Canongia Lopes, Faraday Discuss., 2012, 154, 155–169 RSC.
- S. Li, K. S. Han, G. Feng, E. W. Hagaman, L. Vlcek and P. T. Cummings, Langmuir, 2013, 29, 9744–9749 CrossRef CAS PubMed.
- J. L. Bañuelos, G. Feng, P. F. Fulvio, S. Li, G. Rother, N. Arend, A. Faraone, S. Dai, P. T. Cummings and D. J. Wesolowski, Carbon, 2014, 78, 415–427 CrossRef PubMed.
- N. Manini, M. Cesaratto, M. G. Del Pópolo and P. Ballone, J. Phys. Chem. B, 2009, 113, 15602–15609 CrossRef CAS PubMed.
- L. Liu, S. Li, Z. Cao, Y. Peng, G. Li, T. Yan and X.-P. Gao, J. Phys. Chem. C, 2007, 111, 12161–12164 CAS.
- K. C. Jha, H. Liu, M. R. Bockstaller and H. Heinz, J. Phys. Chem. C, 2013, 117, 25969–25981 CAS.
- T. P. C. Klaver, M. Luppi, M. H. F. Sluiter, M. C. Kroon and B. J. Thijsse, J. Phys. Chem. C, 2011, 115, 14718–14730 CAS.
- A. C. F. Mendonça, A. A. H. Pádua and P. Malfreyt, J. Chem. Theory Comput., 2013, 9, 1600–1610 CrossRef.
- H. Valencia, M. Kohyama, S. Tanaka and H. Matsumoto, Phys. Rev. B: Condens. Matter Mater. Phys., 2008, 78, 205402 CrossRef.
- G.-B. Pan and W. Freyland, Chem. Phys. Lett., 2006, 427, 96–100 CrossRef CAS PubMed.
- F. Endres and S. Z. El Abedin, Z. Phys. Chem., 2007, 221, 1407–1427 CrossRef CAS PubMed.
- R. Foulston, S. Gangopadhyay, C. Chiutu, P. Moriarty and R. G. Jones, Phys. Chem. Chem. Phys., 2012, 14, 6054–6066 RSC.
- C. M. Gordon, Appl. Catal., A, 2001, 222, 101–117 CrossRef CAS.
- J. P. Hallett and T. Welton, Chem. Rev., 2011, 111, 3508–3576 CrossRef CAS PubMed.
- T. L. Greaves and C. J. Drummond, Chem. Rev., 2008, 108, 206–237 CrossRef CAS PubMed.
- H. Li, M. W. Rutland and R. Atkin, Phys. Chem. Chem. Phys., 2013, 15, 14616–14623 RSC.
- R. Hayes, S. Imberti, G. G. Warr and R. Atkin, J. Phys. Chem. C, 2014, 118, 13998–14008 CAS.
- R. García, in Amplitude Modulation Atomic Force Microscopy, Wiley-VCH Verlag GmbH & Co. KGaA, 2010, pp. 41–57, DOI: 10.1002/9783527632183.ch4 Search PubMed.
- R. Hayes, G. G. Warr and R. Atkin, Phys. Chem. Chem. Phys., 2010, 12, 1709–1723 RSC.
- J. A. Smith, G. B. Webber, G. G. Warr and R. Atkin, J. Phys. Chem. B, 2013, 117, 13930–13935 CrossRef CAS PubMed.
- R. Hayes, S. Imberti, G. G. Warr and R. Atkin, Phys. Chem. Chem. Phys., 2011, 13, 13544–13551 RSC.
- D. Wakeham, R. Hayes, G. G. Warr and R. Atkin, J. Phys. Chem. B, 2009, 113, 5961–5966 CrossRef CAS PubMed.
- K. Voitchovsky, J. J. Kuna, S. A. Contera, E. Tosatti and F. Stellacci, Nat. Nanotechnol., 2010, 5, 401–405 CrossRef CAS PubMed.
- B. James and H. James, in Dekker Encyclopedia of Nanoscience and Nanotechnology, CRC Press, 2nd edn – Six Volume Set (Print Version), 2008, pp. 2211–2228, DOI: 10.1201/NOE0849396397.ch192 Search PubMed.
- R. García and A. San Paulo, Ultramicroscopy, 2000, 82, 79–83 CrossRef.
- F. Grieser and C. J. Drummond, J. Phys. Chem., 1988, 92, 5580–5593 CrossRef CAS.
- M. V. Fedorov, N. Georgi and A. A. Kornyshev, Electrochem. Commun., 2010, 12, 296–299 CrossRef CAS PubMed.
- M. A. Gebbie, M. Valtiner, X. Banquy, E. T. Fox, W. A. Henderson and J. N. Israelachvili, Proc. Natl. Acad. Sci. U. S. A., 2013, 110, 9674–9679 CrossRef CAS PubMed.
- R. M. Espinosa-Marzal, A. Arcifa, A. Rossi and N. D. Spencer, J. Phys. Chem. Lett., 2013, 5, 179–184 CrossRef.
- H. V. R. Annapureddy, H. K. Kashyap, P. M. De Biase and C. J. Margulis, J. Phys. Chem. B, 2010, 114, 16838–16846 CrossRef CAS PubMed.
- A. A. Freitas, K. Shimizu and J. N. Canongia Lopes, J. Chem. Eng. Data, 2014, 59, 3120–3129 CrossRef CAS.
- S. Perkin, Phys. Chem. Chem. Phys., 2012, 14, 5052–5062 RSC.
- S. Perkin, L. Crowhurst, H. Niedermeyer, T. Welton, A. M. Smith and N. N. Gosvami, Chem. Commun., 2011, 47, 6572–6574 RSC.
- J. M. Black, D. Walters, A. Labuda, G. Feng, P. C. Hillesheim, S. Dai, P. T. Cummings, S. V. Kalinin, R. Proksch and N. Balke, Nano Lett., 2013, 13, 5954–5960 CrossRef CAS PubMed.
- S. Perkin, T. Albrecht and J. Klein, Phys. Chem. Chem. Phys., 2010, 12, 1243–1247 RSC.
- R. Kawano, T. Katakabe, H. Shimosawa, M. Khaja Nazeeruddin, M. Gratzel, H. Matsui, T. Kitamura, N. Tanabe and M. Watanabe, Phys. Chem. Chem. Phys., 2010, 12, 1916–1921 RSC.
- T. Sato, G. Masuda and K. Takagi, Electrochim. Acta, 2004, 49, 3603–3611 CrossRef CAS PubMed.
- P. Eiden, Q. Liu, S. Zein El Abedin, F. Endres and I. Krossing, Chem.–Eur. J., 2009, 15, 3426–3434 CrossRef CAS PubMed.
- N. M. Rocher, E. I. Izgorodina, T. Rüther, M. Forsyth, D. R. MacFarlane, T. Rodopoulos, M. D. Horne and A. M. Bond, Chem.–Eur. J., 2009, 15, 3435–3447 CrossRef CAS PubMed.
- N. Borisenko, A. Ispas, E. Zschippang, Q. Liu, S. Zein El Abedin, A. Bund and F. Endres, Electrochim. Acta, 2009, 54, 1519–1528 CrossRef CAS PubMed.
- W. Zhao, M. Zhu, Y. Mo and M. Bai, Colloids Surf., A, 2009, 332, 78–83 CrossRef CAS PubMed.
- H. Li, F. Endres and R. Atkin, Phys. Chem. Chem. Phys., 2013, 15, 14624–14633 RSC.
- J. Sweeney, G. B. Webber, M. W. Rutland and R. Atkin, Phys. Chem. Chem. Phys., 2014, 16, 16651–16658 RSC.
- H. Judith, H. Florian, H. M. Martin and B. Roland, J. Phys.: Condens. Matter, 2014, 26, 284110 CrossRef PubMed.
- A. Triolo, O. Russina, H. J. Bleif and E. Di Cola, J. Phys. Chem. B, 2007, 111, 4641–4644 CrossRef CAS PubMed.
- M. Mezger, S. Schramm, H. Schröder, H. Reichert, M. Deutsch, E. J. De Souza, J. S. Okasinski, B. M. Ocko, V. Honkimäki and H. Dosch, J. Chem. Phys., 2009, 131, 094701 CrossRef PubMed.
- F. Endres, O. Hofft, N. Borisenko, L. H. Gasparotto, A. Prowald, R. Al-Salman, T. Carstens, R. Atkin, A. Bund and S. Z. El Abedin, Phys. Chem. Chem. Phys., 2010, 12, 1724–1732 RSC.
Footnote |
| † Electronic supplementary information (ESI) available: An additional force curve for DMEAF extending to wider separations, size histograms and the small angle X-ray scattering spectrum for DMEAF. See DOI: 10.1039/c4sc02727b |
| This journal is © The Royal Society of Chemistry 2015 |