DOI:
10.1039/C5RA22973A
(Paper)
RSC Adv., 2015,
5, 107533-107539
Deoxygenation of methyl palmitate over SiO2-supported nickel phosphide catalysts: effects of pressure and kinetic investigation†
Received
2nd November 2015
, Accepted 10th December 2015
First published on 14th December 2015
Abstract
In this paper, a series of Ni2P/SiO2 catalysts was synthesized using the thermal decomposition of hypophosphite precursors. The resulting catalysts were characterized using XRD, TEM, CO pulse adsorption, atomic adsorption spectroscopy and NH3-TPD, and the catalytic properties were investigated for deoxygenation of methyl palmitate at different pressures in a fixed-bed reactor. The results indicate that the catalysts at 1.0 MPa and 3.0 MPa have similar activity, and lower pressure is in favour of direct deoxygenation of methyl palmitate. Pseudo first order kinetics were employed to describe the reaction to understand the effect of pressure and temperature and active energy at different reaction pressures was calculated. According to the active energy, the scission of the C–O bond is more difficult than the C–C, and the HDO route was favored at higher reaction pressure and temperature.
1. Introduction
Recently, renewable energy has drawn increasing attention due to its reproducible and low carbon emission. Vegetable and animal oils are attracting intensive attention, because they are abundant and inexpensive feed stocks which have great potential to be converted into liquid energy.1 Deoxygenation of vegetable and animal oil is a promising method to obtain renewable fluid energy, because alkanes produced by the hydrotreating method have similar physical and chemical properties to petroleum oil.2,3 Many vegetable oils have been employed in deoxygenation. For example soybean oil,4 palm oil,5 castor oil6 and flax oil etc.
Served as a main product of transesterification of triglyceride-containing feed stocks and model compound of vegetable oil the FAME (fatty acid methyl esters) have been widely studied.7,8 Effect of reaction medium to conversion of methyl palmitate have been investigated. Aromatic compounds do not retard methyl palmitate transformation instead inhibit the conversion of intermediate oxygenates.9 Appropriate acid sites of support are necessary for conversion of methyl palmitate because of the synergistic effect between active sites and acid sites.10 Some kinetic investigations of deoxygenation of methyl esters have been performed in liquid phase and pseudo-first-order reaction is employed to fit the reaction model.9 Reaction pressure and temperature affect the selectivity of hydrodeoxygen of methyl palmitate. Selectivity of HDO process is inhibited at higher reaction temperature.11
The deoxygenation catalysts mainly include conventional metal sulfides (e.g. CoMo/Al2O3 and NiMo/Al2O3) and noble metals. Monometallic Ni and Co sulfides give higher proportional DCO products, however Mo based sulfides catalysts obtain almost exclusively HDO products. It is considered that adsorption of molecular is affected by metal sulfides and then reaction pathways are transformed.12
Noble metal catalysts can obtain high conversion and yield more HDO product compared to decarbonylation and decarboxylation product.13 The isomerization of hydrocarbon also happen when the noble metal is supported by zeolites.
Although metal sulfide catalysts have widely been studied, some disadvantages exist in them. The sulphiding agent is continuously added to feedstock to maintain activity of catalysts, which lead to undesired S-containing products. For noble metal catalyst, the price restricts the practical application. As a result, new types of catalysts need to be developed. Recently, metal phosphides have attracted increasingly attentions due to their higher catalytic performance compared with traditional transition metal and metal sulphides in hydrotreating process, especially, Ni2P performs the highest activity.14,15 TPR method and decomposition of hypophosphite precursor are two main methods used to prepare Ni2P catalyst.16 Numerous experiments have studied the deoxygenation of methyl esters on Ni2P catalyst prepared by TPR method. The TOF value is increasing with the crystallites and the selectivity of HDO and DCO paths are affected by Ni2P crystallites.17 The P/Ni ratio has a profound effect on performance of deoxygenation. Ni3P phase reduce the activity while Ni12P5 phase has no negative influence on catalyst performance.18 Thermal decomposition of hypophosphite is a simple method to prepare metal phosphide.19 The synthesis temperature is low, for this reason, smaller Ni2P particle can be obtained. The deoxygenation performance of Ni2P prepared by hypophosphite decomposition method is worthy to investigate for the different surface composition caused by unlikely preparing condition. Moreover, kinetic mechanisms of deoxygenation of methyl palmitate in the gas phase and the influence of H2 pressure and temperature to conversion and selectivity have been illustrated seldom.
In present work, catalytic properties and kinetic studies of Ni2P/SiO2 for deoxygenation of methyl palmitate were investigated in a fixed-bed reactor. For understanding kinetic mechanisms and the effect of reaction pressure, deoxygenation of methyl palmitate at different reaction pressures (from 0.1 MPa to 3 MPa) was studied on Ni2P/SiO2 catalyst prepared by decomposition of hypophosphite method. Finally, we got the reaction path, kinetic equation, reaction rate constant, and active energy for deoxygenation of methyl palmitate in a fixed-bed reactor.
2. Experimental methods
SiO2 was purchased from Tianjin Chemist Scientific Ltd., China. It had a specific surface area of 206 m2 g−1, a pore volume of 0.8 cm3 g−1, and a BJH average pore size of 15.96 nm. Other reagents were analytical pure grade and purchased from Tianjin Guangfu Fine Chemical Research Institute, China.
2.1. Preparation of catalyst
The 10 wt% Ni2P/SiO2 catalyst was prepared by thermal decomposition of nickel hypophosphite precursors. The precursors were maintained by wet incipient wetness impregnation, first nickel chloride hexahydrate and sodium hypophosphite were diluted in deionized water followed by stirring for 10 minutes, second this solution was poured into a certain quality support, SiO2, followed by drying at 80 °C for 12 h. The precursor was decomposed in a tubular furnace. At first, Ar was purged in to remove air in tubular furnace, then calcined at 300 °C for 1 h in a static Ar atmosphere, after which a flowing Ar atmosphere was applied and kept temperature 300 °C for another 1 h. At last the catalyst was cooled to ambient temperature and washed in deionized water for twice followed by drying at 120 °C for 3 h.
2.2. Characterization
Powder X-ray diffraction (XRD) was performed on a Bruker D8 focus diffractometer, with Cu Kα radiation at 40 kV and 40 mA. The transmission electron microscope (TEM) images were acquired using a Philips Tecnai G2 F-20 field emission gun TEM. The surface area was calculated using a multipoint Brunauer–Emmett–Teller (BET) model. The pore size distribution was obtained from the desorption isotherms using the Barret–Joyner–Halenda (BJH) model, and the total pore volume was estimated at a relative pressure of 0.99, assuming full surface saturation with nitrogen. The temperature-programmed desorption of ammonia (NH3-TPD) was carried out to evaluate the total acidity of the catalysts. The NH3-TPD of samples was performed with Micromeritics Chemisorb 2750 gas-adsorption equipment. The sample was loaded into a quartz reactor and pretreated in a He atmosphere at 600 °C for 3 h. After cooling in He the sample adsorbed of 10% NH3/He for 30 min. Subsequently, the sample was purged for 30 min in a He atmosphere. Then, the sample was heated in a He atmosphere at a heating rate of 10 °C min−1 up to 750 °C. The gas flow rate was 25 mL min−1. Quantification of acid sites were performed on Micromeritics ChemSorb 2750. Pulse of a certain amount of NH3 in He carrier (25 cm3 (NTP) min−1) was injected at 30 °C through a loop tube. CO chemisorptions of the catalysts were performed using Micromeritics ChemSorb 2750 gas adsorption equipment. The sample was loaded into a quartz reactor and pretreated in 10% H2/Ar at 450 °C for 3 h. After cooling in He, pulses of 10% CO/He in a He carrier (25 cm3 (NTP) min−1) were injected at 30 °C through a loop tube. Atomic adsorption spectroscopy (AAS) was performed using a TAS-990 instrument with an air–acetylene flame.
2.3. Catalytic activity test
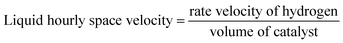
The deoxygenation catalytic activities were evaluated using 50 wt% methyl palmitate in decalin. The deoxygenation reaction was carried out in a fixed-bed reactor. The catalysts were pelleted, crushed and sieved with 20–40 mesh. For kinetic tests, 1 g of the catalyst was applied and diluted to 5 mL with SiO2. Internal and external diffusions were excluded by experimental method before kinetic tests. The testing conditions for the deoxygenation reaction were 3 MPa, H2/oil = 1000. For investigating kinetic parameters of the reaction, different liquid hourly space velocities were applied, and H2/oil was made a constant.20 Liquid hourly space velocity was calculated as eqn (1):| |
 | (1) |
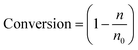
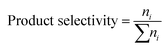
Liquid products were collected every hour after a stabilization period of 3 h. Both feed and products were analyzed with an Agilent 7890A/5975C GC-MS equipped with a flame ionization detector and an HP-5 column. The methyl palmitate conversion and selectivity were calculated following eqn (2) and (3). Where n and n0 denote the moles of methyl palmitate in the product and feed, respectively, and ni is the moles of product i
| |
 | (2) |
| |
 | (3) |
3. Results and discussion
3.1. Catalyst characterization
The catalyst Ni2P/SiO2 was prepared by thermal decomposition method of hypophosphite precursors which had studied by Guan, et al.16,19 The actual nickel loading was 9.5 wt%, which was determined by (AAS). The actual value of nickel loading was approximately equal to expected value. The catalyst was prepared by initial wet impregnation method which could guarantee that all of nickel can be loaded onto support. XRD pattern of catalyst were presented in Fig. 1a. There was no apparent peaks shown in the XRD pattern which indicates low crystallinity and small particle size. Fig. 1b and c showed the transmission electron images of Ni2P/SiO2 catalyst. According to Fig. 1c the crystalline size of Ni2P was less than 5 nm, which indicates a good dispersion on SiO2, as a result, there was no obvious diffraction peaks of Ni2P shown in the XRD pattern.19 A magnified high resolution TEM image yielded d values of 0.29 nm for the (1 1 0) crystallographic plane of Ni2P, which are in good agreement with the calculated value. Fig. 1c is SEM pattern of Ni2P/SiO2, in corresponding to the XRD pattern and TEM images discussed above, the distribution of Ni2P particle is uniform, moreover, no obvious sintering and aggregation was observed. According to Bui et al.21 who compared phosphite method with phosphate method, phosphite method possesses the milder preparation conditions, for this reason small particle size and uniform dispersion of Ni2P could be obtained. In addition, the thermal decomposition method of hypophosphite precursors have been employed for preparing metal phosphide extensively,22,23 Ni2P/SiO2 catalyst could be synthesised by this method successfully. NH3-TPD pattern of catalyst was shown in Fig. 1e. According to previous studies,24 peak maxima, Tm, from 20 °C to 200 °C correspond to weak acid sites, Tm from 200 °C to 400 °C to intermediate acid sites, and Tm higher than 400 °C to strong acid sites. The Ni2P/SiO2 exhibits two peaks, one sharp peak is from 30 °C to 250 °C, moreover, the amount of acid sites on Ni2P/SiO2 is 25.56 mmol g−1, which indicates that the catalyst has a lot of weak acid sites. This is because the phosphate generated by disproportional reaction of nickel phosphite. The other one is a broad peak from 470 °C to 750 °C, indicating the strong acid site exists on catalyst, which is generated by pyrophosphate. The texture of Ni2P/SiO2 was shown in Table 1. From the results, we can see that pore volume, diameter and BET area of used catalyst decreased compared to fresh catalyst. The adsorption and desorption isotherm is shown Fig. S1.† The CO uptake of fresh and used catalysts were similar shown in Table S1.† These indicates that no apparent carbon deposition was occurred. This also can be proved by the stability test discussed below.
 |
| | Fig. 1 XRD, TEM, SEM and NH3-TPD images of Ni2P/SiO2, (a) XRD image of Ni2P/SiO2, (b) magnified TEM image of Ni2P/SiO2, (c) TEM image of Ni2P/SiO2, (d) SEM image of Ni2P/SiO2, (e) NH3-TPD image of Ni2P/SiO2. | |
Table 1 Texture properties of Ni2P/SiO2
| Catalyst |
BET area (m2 g−1) |
Vp (cm3 g−1) |
dp (nm) |
| Fresh |
192.4 |
1.045 |
21.29 |
| Used |
185.3 |
0.7339 |
15.96 |
3.2. Effect of reaction pressure
Reaction pressure was an important parameter for hydrogenation, isomerization and cracking reactions. For this study 0.1 MPa, 1 MPa and 3 MPa were employed for investigating the effect of pressure. The decomposition of methyl palmitate involved two pathways.1 As shown in Fig. 2 hydrogenolysis and direct deoxygenation are two paths involved in deoxygenation of methyl palmitate. The effects of reaction pressure on two paths were different. According to Le Chatelier Principle, direct deoxygenation would be inhibited at higher pressure.25 The hydrogenolysis path would be enhanced as a result of increasing pressure of hydrogen.
 |
| | Fig. 2 Two pathways of decomposition of methyl palmitate. | |
Fig. 3 shows the effect of pressure on the catalytic performance. At 563 K and 583 K, increasing reaction pressure enhanced conversion of methyl palmitate, however, at 543 K, conversion reached maximum at 1 MPa and decreased from 1 MPa to 3 MPa. As discussed above, hydrogenolysis process would be favoured at higher reaction pressure, which could be illustrated in Fig. 4b. At 563 K and 583 K, the enhancing effect of pressure on hydrogenolysis path overwhelmed the inhibiting effect on direct deoxygenation path. At 543 K, the inhibiting effect of pressure surpassed the enhancing effect with reaction pressure raising. As we all know the reaction process was controlled by reaction kinetics and thermodynamics both. According to our work in this paper, we calculated the active energy of hydrogenolysis process which was higher than direct deoxygenation process. This indicates that hydrogenolysis process is sensitive to the reaction temperature. At lower reaction temperature, conversion of methyl palmitate increased not as drastic as the higher reaction temperature. For this reason, at 1 MPa maximum of conversion was obtained.
 |
| | Fig. 3 Conversion of methyl palmitate at different reaction pressure. | |
 |
| | Fig. 4 (a) Selectivity of HDO and DCO path at different reaction pressure and temperature, (b) selectivity of hydrogenolysis product at different reaction pressure and temperature, (c) DCO/HDO at different reaction pressure, (d) DCO/HDO at different reaction temperature. | |
As to selectivity, two main pathways occurred in stepwise deoxygenation of hexadecanal and palm acid are DCO and HDO. Main products of DCO and HDO are pentadecane and hexadecane respectively. While pentadecene and hexadecene were also generated by DCO and HDO path respectively, the molar ratio of (pentadecane + pentadecene) to (hexadecane + hexadecane) reflected favoured path at different reaction conditions. It is observed in Fig. 4a that selectivity of DCO path was decreasing and HDO path was increasing with increasing of pressure. The ratio DCO/HDO was decreasing with reaction pressure raising, which indicated reaction pressure would favoured HDO path. As shown in Fig. 5, reaction mechanisms could be mainly classified three types. Type 1: the number of moles were constant. Type 2: the number of moles decreased. Type 3: the number of moles increased. According to the Le Chatelier Principle, with pressure increasing, type 3 would be restrained and type 1 be promoted. It was observed that HDO path involved type 1 and type 2 reactions and DCO path contained type 3 reactions. Although type 1 reaction was involved in DCO path, the effect of this reaction could be negligible as a result of the reaction rate of olefin hydrogenation was rapid. The similar result was obtained by Guzman et al.5 and Yang et al.25
 |
| | Fig. 5 Three types reaction of deoxygenation involved in HDO and DCO route. | |
3.3. Kinetic investigations
Before kinetic tests, internal and external diffusions had been excluded by the experimental method. For internal diffusion, the effect of different particle size of the catalyst was investigated. In this experiment, particle size of the catalyst verified from 10–20 mesh to 40–80 mesh. Fig. 6a shows that the effect of average particle size of catalyst to conversion was negligible. This indicated that in this range of particle size of catalyst internal diffusion could be excluded. Fig. 6b shows the effect of flow velocity of hydrogen to conversion. In this experiment, liquid hourly space velocity was made constant. It is indicated that flow velocity of hydrogen has no effect to conversion of methyl palmitate. As a result, external diffusion could be excluded in this range of flow velocity of hydrogen. Moreover, stability of catalysts were evaluated, more than 8 h stability was obtained which is shown in Fig. 6c. As we all know carbon deposition occurs at lower temperature and conversion readily, in this study conversion of methyl palmitate was sustained in 8 hours at 543 K which indicated that carbon decomposition and catalyst deactivity did not happen. This also can be proved by comparison BET area between fresh catalyst and used catalyst.
 |
| | Fig. 6 The exclusion of internal diffusion, external diffusion and catalyst deactivity, (a) conversion at different average particle size, (b) conversion at different flow velocity of hydrogen, (c) conversion of time on stream. | |
As shown in Fig. 7, kinetic investigations were performed at different pressures. Experimental data was fitted as a pseudo first-order reaction equation shown as eqn (4),
| |
 | (4) |
τ and
X refer to contact time and conversion respectively. Fitting results were shown in
Fig. 7 and the value of
R2 in
Table 2 confirmed that assumption of first-order reaction was rational. As shown in
Fig. 7d, active energy of reactions were calculated as
eqn (5) and the result of fitting was shown in
Table 3.
| |
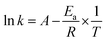 | (5) |
 |
| | Fig. 7 Conversion and fitting result at different reaction pressure, (a) conversion and fitting result at 0.1 MPa, (b) conversion and fitting result at 1 MPa, (c) conversion and fitting result at 3 MPa, (d) reaction rate constant and fitting result. | |
Table 2 Fitting result of kinetic at different reaction pressure and temperature
| Temperature (K) |
Pressure (MPa) |
k (min−1) |
R2 |
| 543 |
0.1 |
1.18 |
0.987 |
| 563 |
0.1 |
3.28 |
| 583 |
0.1 |
9.12 |
| 543 |
1 |
2.26 |
0.996 |
| 563 |
1 |
6.46 |
| 583 |
1 |
20.38 |
| 543 |
3 |
1.81 |
0.995 |
| 563 |
3 |
8.89 |
| 583 |
3 |
27.61 |
Table 3 The calculated activity energy Ea and fitting result
| Pressure (MPa) |
0.1 |
1.0 |
3.0 |
| Ea (kJ mol−1) |
134.60 |
145.05 |
179.91 |
| R2 |
0.999 |
0.996 |
0.988 |
The effect of reaction pressure on deoxygenation was discussed above. It was concluded that with reaction pressure increasing hydrogenolysis path was more and more favoured which can be proved by reaction rate constant shown in Table 2. Active energy is another kinetic parameter that is investigated in this work. On the basis of the Arrhenius equation, the apparent rate constants of the reaction are plotted on logarithmic scale vs. inverse temperature. It was observed that as reaction pressure increased, active energy raised from 134.60 kJ mol−1 to 179.91 kJ mol−1. Combined the effect of reaction pressure on hydrogenolysis selectivity and kinetic investigations, we could concluded that active energy of hydrogenolysis pathway was higher than direct deoxygenation pathway. This could be confirmed by the increasing of hydrogenolysis product selectivity with temperature raising shown in Fig. 4b. According to Arrhenius equation, pathways required higher active energy would be favoured with temperature increasing. As shown in Fig. 2, direct deoxygenation path involved the break of C–C bond. On the contrary, hydrogenolysis path involved the break of the C–O bond. This indicated that the active energy of C–C bond on Ni2P/SiO2 was lower than C–O bond.
3.4. Reaction mechanism
The reaction mechanism was shown in Fig. 8. Hexadecanal and palmitic acid were not detected at atmospheric pressure, for this reason methyl palmitate could be transformed into pentadecane by direct deoxygenation.1 As reaction pressure raising, palmitic acid and hexadecanal were shown in products, this could prove that methyl palmitate also go through a hydrogenolysis process at higher reaction pressure. In hydrogenolysis process, methanol or methane was removed.26 Palmitic acid could generate hexadecanal by hydrodeoxygenation.27 Hexadecanal could create hexadecane by hydrogenation and hydrodeoxygenation stepwise. In these steps hydrodeoxygenation and hydrogenation are involved. Palmitic acid and hexadecanal could also produce pentadecane and pentadecene respectively by DCO process. Pentadecene would be transformed into pentadecane by hydrogenation. According to Chen et al. decarboxylation did not take place. As a result, deoxygenation route went through only a decarbonylation process.28 For HDO route, the intermediate product go through hydrogenation reaction step by step. In these continuous reactions, although weak acid sites were testified by NH3-TPD, dehydration of hexadecanol was considered nonoccurence. The hexadecanol undergoes enolization and subsequent deoxygenation as a result of the strongly metallic hydrogenation/dehydrogenation properties of Ni2P.24 Main product and intermediate products shown in Fig. 8 all could be detected.
 |
| | Fig. 8 Reaction mechanism of deoxygenation of methyl palmitate. | |
4. Conclusions
A series of experiments were carried out to investigate effect of pressure and temperature on conversion of methyl palmitate and selectivity of HDO and DCO pathways. At atmospheric pressure, directly deoxygenation occurred and hydrogenolysis process did not happen. With reaction pressure raising, conversion of methyl palmitate increased as a result of initiation of hydrogenolysis route. Moreover, higher reaction pressure will enhance HDO route and inhibit DCO route.
Reaction rate constant and active energy at different reaction pressures was calculated. The increasing of reaction rate constant with reaction pressure raising indicates that conversion of methyl palmitate will be enhanced at higher reaction pressure which is correspond to experimental data.
Active energy at different reaction pressures was 134.60 kJ mol−1, 145.05 kJ mol−1 and 179.91 kJ mol−1 respectively. It was concluded that the active energy of hydrogenolysis route was higher than direct deoxygenation route. We speculate that the active energy of breaking the C–O bond is higher than the C–C bond. This also can be proved by the enhanced effect of temperature on HDO route, because the break of the C–O bond is also involved in HDO route.
Acknowledgements
This work was financially supported by the NSFC (21376123, U1403293), MOE (IRT-13R30 and 113016A), NSFT (15JCQNJC05500), and the Research Fund for 111 Project (B12015).
References
- R. W. Gosselink, S. A. W. Hollak, S. W. Chang, J. van Haveren, K. P. de Jong, J. H. Bitter and D. S. van Es, ChemSusChem, 2013, 6, 1576–1594 CrossRef CAS PubMed.
- G. W. Huber, P. O'Connor and A. Corma, Appl. Catal., A, 2007, 329, 120–129 CrossRef CAS.
- G. Knothe, Prog. Energy Combust. Sci., 2010, 36, 364–373 CrossRef CAS.
- B. Veriansyah, J. Y. Han, S. K. Kim, S.-A. Hong, Y. J. Kim, J. S. Lim, Y.-W. Shu, S.-G. Oh and J. Kim, Fuel, 2012, 94, 578–585 CrossRef CAS.
- A. Guzman, J. E. Torres, L. P. Prada and M. L. Nuñez, Catal. Today, 2010, 156, 38–43 CrossRef CAS.
- S. Liu, Q. Zhu, Q. Guan, L. He and W. Li, Bioresour. Technol., 2015, 183, 93–100 CrossRef CAS PubMed.
- E.-M. Ryymin, M. L. Honkela, T.-R. Viljava and A. O. I. Krause, Appl. Catal., A, 2010, 389, 114–121 CrossRef CAS.
- Y. X. Yang, C. Ochoa-Hernandez, V. A. D. O'Shea, J. M. Coronado and D. P. Serrano, ACS Catal., 2012, 2, 592–598 CrossRef CAS.
- I. V. Deliy, E. N. Vlasova, A. L. Nuzhdin, E. Y. Gerasimov and G. A. Bukhtiyarova, RSC Adv., 2014, 4, 2242–2250 RSC.
- H. L. Zuo, Q. Y. Liu, T. J. Wang, L. L. Ma, O. Zhang and Q. Zhang, Energy Fuels, 2012, 26, 3747–3755 CrossRef CAS.
- M. Krar, S. Kovacs, D. Kallo and J. Hancsok, Bioresour. Technol., 2010, 101, 9287–9293 CrossRef CAS PubMed.
- D. Kubicka and L. Kaluza, Appl. Catal., A, 2010, 372, 199–208 CrossRef CAS.
- Y. Bie, A. Gutierrez, T. R. Viljava, J. M. Kanervo and J. Lehtonen, Ind. Eng. Chem. Res., 2013, 52, 11544–11551 CrossRef CAS.
- S. T. Oyama, J. Catal., 2003, 216, 343–352 CrossRef CAS.
- K. Li, R. Wang and J. Chen, Energy Fuels, 2011, 25, 854–863 CrossRef CAS.
- Q. X. Guan and W. Li, J. Catal., 2010, 271, 413–415 CrossRef CAS.
- Y. Yang, J. Chen and H. Shi, Energy Fuels, 2013, 27, 3400–3409 CrossRef CAS.
- Y. Yang, C. Ochoa-Hernández, P. Pizarro, V. A. de la Peña O'Shea, J. M. Coronado and D. P. Serrano, Fuel, 2015, 144, 60–70 CrossRef CAS.
- Q. Guan, W. Li, M. Zhang and K. Tao, J. Catal., 2009, 263, 1–3 CrossRef CAS.
- A. Cho, H. Kim, A. Iino, A. Takagaki and S. Ted Oyama, J. Catal., 2014, 318, 151–161 CrossRef CAS.
- P. Bui, J. A. Cecilia, S. T. Oyama, A. Takagaki, A. Infantes-Molina, H. Y. Zhao, D. Li, E. Rodriguez-Castellon and A. J. Lopez, J. Catal., 2012, 294, 184–198 CrossRef CAS.
- W. Wang, K. Zhang, H. Liu, Z. Qiao, Y. Yang and K. Ren, Catal. Commun., 2013, 41, 41–46 CrossRef CAS.
- G. Shi and J. Shen, J. Mater. Chem., 2009, 19, 2295–2297 RSC.
- D. Li, P. Bui, H. Y. Zhao, S. T. Oyama, T. Dou and Z. H. Shen, J. Catal., 2012, 290, 1–12 CrossRef CAS.
- Y. Yang, Q. Wang, X. Zhang, L. Wang and G. Li, Fuel Process. Technol., 2013, 116, 165–174 CrossRef CAS.
- J. X. Chen, H. Shi, L. Li and K. L. Li, Appl. Catal., B, 2014, 144, 870–884 CrossRef CAS.
- B. Peng, X. Yuan, C. Zhao and J. A. Lercher, J. Am. Chem. Soc., 2012, 134, 9400–9405 CrossRef CAS PubMed.
- J. Chen, H. Shi, L. Li and K. Li, Appl. Catal., B, 2014, 144, 870–884 Search PubMed.
Footnote |
| † Electronic supplementary information (ESI) available. See DOI: 10.1039/c5ra22973a |
|
| This journal is © The Royal Society of Chemistry 2015 |
Click here to see how this site uses Cookies. View our privacy policy here. 


