Fibrous porous silica microspheres decorated with Mn3O4 for effective removal of methyl orange from aqueous solution

Yaxi Tian, Yan Liu, Zebin Sun, Haizhen Li, Guijia Cui and Shiqiang Yan*
College of Chemistry and Chemical Engineering, Lanzhou University, Lanzhou 730000, P. R. China. E-mail: yansq@lzu.edu.cn; Fax: +86 931 8912582; Tel: +86 931 8912582

Received 19th October 2015 , Accepted 21st November 2015

First published on 2nd December 2015


Abstract

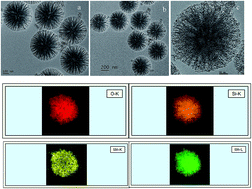
In this work, trimanganese tetraoxide (Mn3O4) functionalized fibrous porous silica microspheres (KCC-1) with well-dispersed and excellent adsorption capacities were successfully synthesized by a simple and mild method for the first time. Various conditions such as initial dye concentration, contact time, solution pH and temperature were investigated. Experimental results indicated that the content of Mn coated on KCC-1 was estimated to be around 14% (wt%) showing excellent adsorption capacity. The maximum adsorption capacity was determined to be qmax = 746 mg g−1 and the adsorption equilibrium could be reached within 120 min. The results showed that both Langmuir and Freundlich models fitted the experimental data very well. The overall rate process was influenced by intra-particle diffusion and external mass transfer. Moreover, the thermodynamic parameters indicated that the adsorption was spontaneous and exothermic.


1. Introduction

Nowadays, organic dyes are common pollutants in ground water owing to their wide application in textiles, dyeing, leather, paper and other industries.1–4 They may create an eco-toxic hazard and have the potential risk of bioaccumulation.5–7 And the dyes are difficult to degrade by light, heat, microbial attacks and oxidizing agents because of the synthetic origin and complex aromatic molecular structures.8,9 Considering these problems, many methods, such as chemical oxidation, membrane separation, electrochemical process and adsorption procedures, have been developed to remove dyes.10,11 However, adsorption is considered as an attractive method for the removal of organic dyes due to its low costs, high efficiency and easy operation.12–16

Porous silica materials have been topic of interest for researchers because of their nature advantage of large specific surface area, which can been chosen to be good supports.17,18 Polshettiwar et al. have successfully synthesized high-surface-area silica microspheres (KCC-1) with a fibrous morphology in 2010.19 Furthermore, Dong used silver nanoparticles immobilized an fibrous nano-silica for the reduction of 4-nitrophenol and 2-nitroaniline.20 Xie et al. prepared amidoxime-functionalized mesoporous silica microspheres to selectively remove lead ion.17 Although silica porous materials have been developed as adsorbent, they just combine silica porous materials themselves with some small organic molecules, which may be not suitable for the removal of organic dyes. Therefore, it remains a challenge to develop a low-cost and highly effective adsorbent for the removal of organic dyes.

Mn3O4, one of the most stable oxides of manganese, is found to an interesting multifunctional and exceptionally important material featuring environmental pollution free and nature abundance, which has been widely applied in the areas of catalysis,21,22 electrode materials23 as well as adsorption.22,24,25 However, using pure trimanganese tetraoxide as adsorption material is unfavorable due to economic factors as well as the poor physical and chemical characteristic of such material.26 So synthesis of supported metal oxides with high dispersion is of great importance. Ordered mesoporous materials with their high surface areas are particularly suitable. In order to overcome these problems, Mn3O4 coated on the ideal mesoporous support materials may overcome this defect. It is well-known that fibrous porous silica microspheres (KCC-1) can be chosen as the good support due to its high surface area. Therefore, we choose Mn3O4 to enhance the adsorption capacity of KCC-1. On the other hand, to the best of our knowledge, it has not been reported that Mn3O4 functionalized KCC-1(Mn3O4) is used as adsorbent for the removal of methyl orange (MO) from aqueous solution. Therefore, it appears to be an effective method to explore how to combine KCC-1 with Mn3O4 due to their excellent properties.

Inspired by the aforementioned, a series of Mn3O4/KCC-1 with well-dispersed Mn3O4 and excellent adsorption capacity were firstly prepared by a simple and mild method. The functional nanocomposites were characterized by using Fourier-transform infrared spectroscopy (FT-IR) analysis, X-ray diffraction (XRD), Brunauer, Emmett and Teller surface area (BET) analysis, UV-vis spectra, transmission electron microscopy (TEM) analysis, atomic absorption spectrophotometer. This work is a successful attempt to prepare metal oxide functionalized KCC-1 by a simple and mild method, which may be further used to develop other promising porous silica materials for application. The adsorption capacities of different materials such as KCC-1, Mn3O4 and Mn3O4/KCC-1, were investigated using methyl orange as a model. Moreover, the adsorption kinetics, rate-controlling mechanisms and thermodynamic parameters of the adsorbents were also comprehensively investigated to evaluate these adsorption behaviors.

2. Experimental section

2.1. Material

Tetraethyl orthosilicate (TEOS), cetylpyridinium bromide (CPB), pentanol, urea, cyclohexane, manganese acetate tetrahydrate (Mn(C2H3O2)2·4H2O), hydrazine hydrate (85%) and methyl orange (MO) were purchased from Lanzhou Aihua Chemical Company. Organic solvents used were of analytical grade and did not require further purification.

2.2. Synthesis of KCC-1

In this study, KCC-1 was successfully synthesized by a traditional hydrothermal method.20 First, TEOS (2.5 g) was dissolved in a solution of cyclohexane (30 mL) and pentanol (1.5 mL). Subsequently, a stirred solution of CPB (1 g) and urea (0.6 g) in water (30 mL) was added to the solution. The obtained mixture was continually stirred for 45 min at room temperature and then placed in a Teflon-sealed hydrothermal reactor and heated 120 °C for 5 h. The reaction mixture was isolated by centrifugation, washed with distilled water and acetone and dried in a drying oven. The as-synthesized material was then calcined at 550 °C for 5 h in air.

2.3. Preparation of Mn3O4/KCC-1

100 mg KCC-1 and 40 mL H2O were mixed together in a flask and ultrasonicated for 20 min, followed by the addition of manganese acetate (800 mg L−1). Then 10 mL hydrazine hydrate was slowly added to the solution. The resulting mixture was continually stirred for 24 h at room temperature. The resultant product was isolated by centrifugation, washed with distilled water and ethanol and dried in a drying oven. Through this method, the hybrids with different rations of Mn3O4 were synthesized and the initial amounts of manganese acetate were 20, 60 and 120 mL, respectively, when all other conditions kept the same. These samples were designated as M1, M2 and M3, respectively. The detailed preparation procedure is illustrated in Scheme 1.
image file: c5ra21783k-s1.tif
Scheme 1 Schematic presentation of the preparation procedure of Mn3O4/KCC-1.

2.4. Characterization of Mn3O4/KCC-1

The morphology of the samples was characterized by using a transmission electron microscope (TEM, TecnaiG2F30). Absorption spectra were performed on a Hitachi U-3900 UV-vis spectrophotometer. The functional groups of the samples were characterzied using a NEXUS 670 FT-IR spectrometer (Nicolet Instrument Corporation, USA) with KBr pellets containing the samples. The inorganic phases of the samples were characterized by using X-ray diffraction (XRD; XRD-600. Shimadzu, Japan). Specific surface areas were calculated by the Brunauer–Emmett–Teller (BET) method and pore sizes by the Barrett–Joyner–Halenda (BJH) methods using nitrogen adsorption at liquid nitrogen temperatures (Sorptomatic 1990, Thermo, USA). The content of Mn in prepared samples was measured on an atomic absorption spectrophotometer (AA06600, Hitachi).

2.5. Adsorption experiments

Analytical grade methyl orange was used to prepare a 1000 mg L−1 stock solution, which was further diluted to the required concentration before use.

To determine the adsorption capacities of different Mn3O4 loading materials, the MO solutions were treated with Mn3O4, KCC-1, M1, M2 and M3 separately. 5 mg sample of different adsorbents was added to each 25 mL MO with initial concentration of 50 mg L−1 to 300 mg L−1 (50 mg L−1 intervals). The final MO concentrations remaining in the solution were measured by a spectrophotometric method at 465 nm. The two phases were separated by filtration using a 0.45 μm microporous membrane filter. In the subsequent experiments, M3 was chosen as the adsorbent in the following experiments and was kept constant.

The effect of pH on MO adsorption was studied by varying the solution pH from 3.0 to 11.0, with the initial MO concentration of 100 mg L−1. The pH of the examples was adjusted by adding 1 M HCl or NaOH to each solution.

Adsorption kinetic samples were prepared by adding 1 g of Mn3O4/KCC-1 to 2000 mL solution. Samples were collected at predetermined time intervals using a membrane filter.

In the experiments on the effect of temperature, the temperature was held at three different temperatures (273, 298 and 323 K) with different concentrations. The amount of MO adsorption at equilibrium qe (mg g−1) was calculated using the following equation:27

 
image file: c5ra21783k-t1.tif(1)
where C0 and Ce (mg L−1) are the liquid phase concentrations of dye at initial and equilibrium, respectively, V (L) the volume of the solution and W (g) is the mass of adsorbent used.

3. Results and discussion

3.1. Characterization of the adsorbents

The morphology of KCC-1 (Fig. 1a and b) and M3 (Fig. 1c) were investigated by TEM as shown in Fig. 1. The as-prepared KCC-1 microspheres with fibrous were uniform and monodispersed (Fig. 1a and b). It can be clearly seen that the Mn3O4 nanocomposites are homogeneously dispersed on the surface of KCC-1. And the size of KCC-1 and M3 was around 450 nm. Besides, it was proved that Mn3O4 nanocomposites were homogeneously dispersed on the surface of KCC-1, as shown in M3 mapping.
image file: c5ra21783k-f1.tif
Fig. 1 Representative TEM images of KCC-1 (a and b) and M3 (c); mapping of M3 (c).

The physical properties of KCC-1, M1, M2 and M3 such as surface areas, total pore volume sand pore size, were summarized in Fig. S1. The nitrogen adsorption–desorption isotherm of KCC-1, M1, M2 and M3 is presented in Fig. 2. The specific surface area of KCC-1, M1, M2 and M3 were calculated to be 333.69 m2 g−1, 312.32 m2 g−1, 310.44 m2 g−1 and 223.49 m2 g−1, respectively. Compared with KCC-1, specific surface area for M1, M2 and M3 were gradually decreased with the increased amount of Mn3O4 loaded on KCC-1. Moreover, the pore volume of M3 (0.55 cm3 g−1) was evidently lower than KCC-1 (0.71 cm3 g−1). However, the pore size (9.81 nm) was evidently higher than KCC-1 (8.42 nm). This phenomenon may be caused by two reasons. On the one hand, the formation of Mn3O4 NPs blocked the pore entrances, which decreased the surface area and pore volume. On the other hand, the formation of Mn3O4 NPs should have a contribution to the increase of the pore size. The content of Mn3O4 coated on the surface of KCC-1 were characterized by elemental analysis. The data were shown in Table 1. As shown in Table 1, the content of Mn in the M1, M2 and M3 adsorbents were 4.75%, 10.57%, 14.56%, respectively.


image file: c5ra21783k-f2.tif
Fig. 2 The nitrogen adsorption–desorption isotherm of KCC-1, M1, M2 and M3.
Table 1 Data obtained from elemental analysis
Samples Content of Mn (%) Content of Mn3O4 (%)
M1 4.75 6.59
M2 10.57 14.67
M3 14.56 20.21


XRD patterns of KCC-1, M1, M2, and M3 were shown in Fig. 3. The broad peak from 20° to 30°corresponds corresponds to amorphous silica.28 The peak at 32° and 58°, which can be indexed to 103, 224 crystal planes of Mn3O4, respectively.29 The results also suggested KCC-1 was successfully modified using Mn3O4. As shown in Fig. 4, the successful modification of the KCC-1 using Mn3O4 was supported by FT-IR spectra of KCC-1, M1, M2 and M3. The spectrum of KCC-1 exhibits bands at 802 and 1095 cm−1, which are assigned to the typical Si–O–Si bands.28 Compared to the spectrum of KCC-1, the peaks at around 595 cm−1 are assigned to the octahedral Mn–O bonds, indicating that Mn3O4 was coated on the surface of KCC-1 successfully.25


image file: c5ra21783k-f3.tif
Fig. 3 XRD patterns of KCC-1, M1, M2, M3.

image file: c5ra21783k-f4.tif
Fig. 4 FT-IR spectra of KCC-1, M1, M2, M3.

3.2. Adsorption experiment studies

3.2.1. Adsorption capacities of different materials. Fig. 4 shows the adsorption capacities of different Mn3O4 loading materials (M1, M2 and M3). The KCC-1 and Mn3O4 were also studied for comparison. The amounts of Mn3O4 were estimated to be 6.59 wt%, 14.67 wt% and 20.21 wt% for M1, M2 and M3, respectively, which can be calculated from the content of Mn by atomic absorption spectrometry. The adsorption capacities follow an order of M3 > M2 > M1> Mn3O4 > KCC-1, as shown in Fig. 5. It can be clearly seen that M3 shows the best adsorption capacity among all materials, suggesting that Mn3O4 is a very important adsorption group during the adsorption process of MO onto Mn3O4/KCC-1.
image file: c5ra21783k-f5.tif
Fig. 5 Adsorption capacities of different materials with regard to MO adsorption (experimental conditions: adsorbents dosage: 0.2 g L−1, temperature: 298 K, contract time: 2 h).
3.2.2. Effect of solution initial pH. MO has two chemical structures, whose chromophores are anthraquinone or azo bond depending on the pH of the solution, as can be expressed as the following:30
image file: c5ra21783k-u1.tif

And the pH is one of the most important parameters controlling the adsorption process, presumably on account of its profound influence on the surface properties of the adsorbent and the degree of ionization/dissociation of the adsorbate molecule. As shown in Fig. 6, the adsorption capacity decreases from 309 mg g−1 to 67 mg g−1 with the increase in pH from 3.0 to 11.0. At lower pH, the surface of the Mn3O4/KCC-1 is positively charged due to hydronium ion (H+ and H3O+) in the solution, which is attracted to the anionic MO species, enhancing the ability of adsorption. On the contrary, the adsorption efficiency reduces under basic condition, due to the competition interaction between anionic dye and excess OH ions in the solution. Moreover, with the increase of the pH value, the adsorption capacities becomes lower, probably due to more coulombic repulsion between the negatively charged surface and the dye molecules, which is caused by increase of the number of negatively charged sites. This suggested that the electrostatic interaction played the predominant role in the adsorption between anionic dyes and Mn3O4/KCC-1.


image file: c5ra21783k-f6.tif
Fig. 6 Effect of solution pH on MO adsorbed onto Mn3O4/KCC-1 (experimental conditions: initial dye concentration: 100 mg L−1, adsorbents dosage: 0.2 g L−1, temperature: 293 K, contract time: 2 h).
3.2.3. Effect of contact time. Fig. 7 shows the effect of contact time on the adsorption of MO with different concentrations (100, 200 and 300 mg L−1). The results indicated the adsorption capacity enhanced with the increase of concentration and contact time. The initially rapid adsorption rate may be attributed to the availability of a large number of vacant active sites on the adsorbent surface. Then the adsorption was slow because the remaining vacant surface sites were difficult to be occupied due to the repulsive force between the MO molecules on the adsorbents.
image file: c5ra21783k-f7.tif
Fig. 7 Effect of contact time on the adsorption of MO by Mn3O4/KCC-1 (experimental conditions: initial dye concentration: 100 mg L−1, adsorbents dosage: 0.2 g L−1, temperature: 298 K, contract time: 2 h).
3.2.4. Effect of temperature. Temperature is a very important parameter for the adsorption process. As shown in Fig. 8, the adsorption capacity obviously decreased from 681 to 280 mg g−1 with the increase in temperature, which indicated that the adsorption of MO onto Mn3O4/KCC-1 was an exothermic process. The reasons for this phenomenon may be that the physical bonding between MO molecules and the active sites on the adsorbent surface weakened as temperature increased.
image file: c5ra21783k-f8.tif
Fig. 8 Effect of temperature on adsorption of MO by Mn3O4/KCC-1 (experimental conditions: adsorbents dosage: 0.2 g L−1, contract time: 2 h).
3.2.5. Adsorption kinetics. To better understand the characteristics of the adsorption process, three of most common kinetic models, i.e. pseudo-first-order (Fig. S2), pseudo-second-order (Fig. S3) and intra-particle diffusion model (Fig. 9), were exploited to analyze the experimental data. The calculated kinetics parameters for the removal of MO with Mn3O4/KCC-1 are listed in Table 2.
image file: c5ra21783k-f9.tif
Fig. 9 Intra-particle diffusion model for the adsorption of MO onto the Mn3O4/KCC-1.
Table 2 Kinetic models for the adsorption of MO onto M3 at 298 K
C0 (mg L−1) qe,exp Pseudo-first-order model
k1 qe r2
100 240 0.02218 198.1 0.8465
200 400 0.01303 312.4 0.9488
300 473 0.01757 376.1 0.9714

C0 (mg L−1) Pseudo-second-order model Intra-particle diffusion model
k2 × 10−5 qe r2 ki C r2
100 2.32 234.7 0.9938 18.3825 35.35 0.9588
200 0.659 418.4 0.9998 31.5763 22.3 0.9384
300 0.793 510.2 0.9976 37.0461 51.35 0.9770


The pseudo-first-order kinetic model can be expressed as the following:31

 
image file: c5ra21783k-t2.tif(2)
where qe and qt (mg g−1) are the adsorption amounts of the MO at equilibrium and time (min), respectively; k1 is the rate constant of pseudo-first-order kinetic model (min−1).

The pseudo-second-order kinetic model is expressed as following32

 
image file: c5ra21783k-t3.tif(3)
where k2 is the rate constant (g mg−1 min−1) of pseudo-second-order kinetic model for the adsorption process. k2 and qe can be estimated from the slope and intercept of the liner plot t/qt against t as shown in Fig. S3.

The experimentally observed adsorption rate is the overall rate of the whole process. Therefore, it is necessary to predict the rate-limiting step. The intra-particle mass transfer diffusion model proposed by Weber–Morris was used. The equation can be written as follows33

 
qt = kit1/2 + C (4)
where ki (mg g−1 min−1/2) was the intra-particle diffusion rate constant and C (mg g−1) was the intercept related to the thickness of the boundary thickness.

It could be clearly observed that the r2 values for the pseudo-second-order kinetic model (>0.993) are much higher than that of pseudo-first-order, suggesting that the data fitted pseudo-second-order better. Besides, the values of qe calculated from the pseudo-second-order kinetic model were close to the experimental results.

In this work, the kinetic adsorption data were simulated with the intra-particle diffusion model. Piecewise liner regression of the data indicated that qt vs. t1/2 plots had two distinct regions. There existed two steps in the overall adsorption process: (1) the initial sharp increase attributed to the diffusion of adsorbate through the solution to the adsorbent external surface. (2) The gradual adsorption stage indicated that there existed intra-particle diffusion. As shown in Fig. 9, the plot do not pass through the origin, this suggests that intra-particle is not the only rate controlling step, but also some other process may also involve controlling the rate of adsorption.

3.2.6. Adsorption isotherms. To describe the interaction behavior between adsorbate and adsorbent, it is important to study the equilibrium adsorption isotherm. Langmuir and Freundlich isotherms were applied to analysis the adsorption process in this study.

The Langmuir model assumes that monolayer adsorption occurs at the binding sites of a perfectly smooth homogenous surface. It is described by the following equation:34

 
image file: c5ra21783k-t4.tif(5)
where qe (mg g−1) is the amount of dye adsorbed per unit mass of the adsorbent at the equilibrium point, Ce (mg L−1) is the equilibrium concentration of MO, qm is the maximum adsorbate amount, and b (L mg−1) is the Langmuir constant related to adsorption affinity of the binding sites. The values of qm and b are calculated from the slope and intercept of the liner plot of Ce/qe versus Ce. Another equilibrium parameter, RL, related to Langmuir isotherm is also used to express the efficiency of the adsorption, which is defined as follows:31
 
image file: c5ra21783k-t5.tif(6)
where b (L mg−1) is the Langmuir constant and C0 is the initial MO concentration (mg L−1). The values of RL suggests the types of the isotherm can be irreversible (RL = 0), favorable (0 < RL < 1), linear (RL = 1) and unfavorable (RL > 1).

The Freundlich model is an empirical equation that describes heterogeneous surfaces and multilayer adsorption systems, which is generally given as follows:35

 
image file: c5ra21783k-t6.tif(7)
where qe and Ce have the same definitions as those in the Langmuir equation cited above and KF and n are the Freundlich constants related to the adsorption capacity and adsorption intensity, respectively. The values of KF and n are calculated from the slope and intercept of the liner plot of ln[thin space (1/6-em)]qe versus ln[thin space (1/6-em)]Ce.

The Langmuir and Freundlich isotherms are shown in Fig. S4 and S5, respectively. The values of qm, b, KF, n, and RL are shown in Table 3.

Table 3 Isotherm parameters for removal of MO by M3 at different temperatures
  Langmuir Freundlich
T (K) qm (mg g−1) b r2 RL n KF r2
273 746 0.0533 0.988 0.0589–0.273 2.61 99.5 0.986
298 653 0.0147 0.992 0.163–0.539 1.34 12.1 0.972
323 500 0.00571 0.996 0.369–0.778 1.66 10.38 0.998


As shown in Table 3, both Langmuir and Freundlich models closely fitted the experimental data with good correlation coefficients. And the maximum MO adsorption capacity decreased from 746 to 500 mg g−1 with the increase in temperature from 273 K to 323 K, indicating that the possibility that MO adsorption by M3 is an exothermic process. This phenomenon will be further discussed in Section 3.2.7.

3.2.7 Thermodynamic studies. The thermodynamic parameters including the standard free energy change (ΔG0), standard entropy change (ΔS0) and standard enthalpy change (ΔH0) were calculated to evaluate the effect of temperature on the adsorption process of MO onto M3.

For the sorption process, the constant K0 can be defined by the following equations:36

 
ΔG0 = −RT[thin space (1/6-em)]ln[thin space (1/6-em)]K0 (8)
 
ΔG0 = ΔH0TΔS0 (9)
where R is the gas constant (8.314 J mol−1 K−1), T is the sorption temperature in Kelvin. K0 is the thermodynamic equilibrium constant, which is defined as follows:37
 
image file: c5ra21783k-t7.tif(10)
where as is the activity of sorbed MO; ae is the activity of MO in solution at equilibrium; γs is the activity of coefficient of the adsorbed MO; γe is the activity coefficient of MO in solution at equilibrium. As the MO concentration in the solution decreases and approaches zero, the values of K0 can be obtained by plotting the image file: c5ra21783k-t8.tif versus qe and by extrapolating qe to zero, as shown in Fig. S6.

By rearranging the eqn (1) and (2), K0 may be obtained using the relationship as follows:38

 
image file: c5ra21783k-t9.tif(11)

ΔH0 and ΔS0 can be calculated from the slope image file: c5ra21783k-t10.tif and the intercept image file: c5ra21783k-t11.tif of the van't Hoff plot of ln[thin space (1/6-em)]K0 versus 1/T as shown in Fig. S7 and are listed in Table 4.

Table 4 Thermodynamic parameters for MO adsorption onto M3
T (K) ln[thin space (1/6-em)]K0 ΔG0 (kJ mol−1) ΔH0 (kJ mol−1) ΔS0 (kJ mol−1)
273 4.32 −9.77    
298 2.12 −5.25 −51.4 −152
323 0.81 −2.18    


The negative ΔG0 values at all temperature confirm that MO adsorption on M3 is spontaneous. Generally, the values of the ΔG0 are range from 0 to −20 kJ mol−1 for physical adsorption.37 In this study, the values of ΔG0 suggested that the adsorption process was a physical process. Besides, the absorption spectra of methyl orange in the presence of M3 proved that the adsorption process was a physical process again (Fig. S8). Moreover, the observed negative ΔH0 indicated that the adsorption behavior was exothermic, which was supported by the above-mentioned phenomenon in Fig. 8. The values of ΔS0 was negative, which corresponded to the decrease of randomness in solid–liquid interface during the adsorption process.

3.2.8 Comparison of adsorbent performance with literature data. Comparing to the adsorption capacity of MO onto many other adsorbents1,5,8,39–44 reported previously in Table 5, the qmax values for MO onto M3 are higher, indicating that Mn3O4/KCC-1 has potential for MO removal from aqueous solutions.
Table 5 Comparison of the adsorption capacities of MO onto various adsorbents
Adsorbates Adsorbents qmax (mg g−1) Ref.
MO Carbon nanotubes 53 39
ZnLa0.02Fe1.98O4/MWCNTs 81 40
Polypyrrole 166 41
NH2–MWCNTs 186 8
Calcined layered double hydroxides 200 42
MgNiAl–C 375 43
H-δ-MnO2 nanoparticles 427 1
MWCNTs/Fe3O4/PANI 446 5
MnO2/G-CNTs 476 44
Mn3O4/KCC-1 746 This work


4. Conclusions

In this study, we have successfully synthesized Mn3O4/KCC-1 with high specific surface area by a simple and mild method for the first time, which may be suitable for other metal oxides. The FT-IR and elemental analysis results of the samples confirmed that Mn3O4 have successfully coated on the surface of KCC-1.

To the best of our knowledge, this study is the first to use Mn3O4/KCC-1 as adsorbents for the removal of MO. And the adsorption process was systematically studied under different conditions. Results indicated that pseudo-second-order model was fitted better by analyzing the adsorption kinetics and intra-particle diffusion model showed that the overall process may be jointly controlled by intra-particle diffusion and external mass transfer. Moreover, the thermodynamic studies suggested that the adsorption is a spontaneous and exothermic process. The results obtained in the work indicated that Mn3O4 functionalized KCC-1 using a very simple and mild method should be a promising adsorbent for the removal of MO.

Notes and references

  1. Y. Liu, C. Luo, J. Sun, H. Li, Z. Sun and S. Yan, J. Mater. Chem. A., 2015, 3, 5674–5682 CAS.
  2. S. Asuha, X. G. Zhou and S. Zhao, J. Hazard. Mater., 2010, 181, 204–210 CrossRef CAS PubMed.
  3. B. Heibati, S. Rodriguez-Couto, N. G. Turan, O. Ozgonenel, A. B. Albadarin, M. Asif, I. Tyagi, S. Agarwal and V. K. Gupta, J. Ind. Eng. Chem., 2015, 31, 124–131 CrossRef CAS.
  4. V. K. Gupta, R. Kumar, A. Nayak, T. A. Saleh and M. A. Barakat, Adv. Colloid Interface Sci., 2013, 193–194, 24–34 CrossRef CAS.
  5. Y. Zhao, H. Chen, J. Li and C. Chen, J. Colloid Interface Sci., 2015, 450, 189–195 CrossRef CAS PubMed.
  6. W. Deligeer, Y. W. Gao and S. Asuha, Appl. Surf. Sci., 2011, 257, 3524–3528 CrossRef CAS.
  7. O. Moradi, V. K. Gupta, S. Agarwal, I. Tyagi, M. Asif, A. S. H. Makhlouf, H. Sadegh and R. Shahryari-ghoshekandi, J. Ind. Eng. Chem., 2015, 28, 294–301 CrossRef CAS.
  8. Y. Liu, G. Cui, C. Luo, L. Zhang, Y. Guo and S. Yan, RSC Adv., 2014, 4, 55162–55172 RSC.
  9. L. Zhang, H. Li, L. Yan, Z. Tian, B. Yang, Z. Sun and S. Yan, RSC Adv., 2014, 4, 48703–48711 RSC.
  10. V. K. Gupta, D. Pathania, N. C. Kothiyal and G. Sharma, J. Mol. Liq., 2014, 190, 139–145 CrossRef CAS.
  11. V. K. Gupta, D. Pathania, S. Agarwal and P. Singh, J. Hazard. Mater., 2012, 243, 179–186 CrossRef CAS PubMed.
  12. Z. Wang, Y. Ma, H. He, C. Pei and P. He, Appl. Surf. Sci., 2015, 332, 456–462 CrossRef CAS.
  13. H. Li, L. Zhang, Z. Sun, Y. Liu, B. Yang and S. Yan, RSC Adv., 2015, 5, 31787–31797 RSC.
  14. F. Nekouei, S. Nekouei, I. Tyagi and V. K. Gupta, J. Mol. Liq., 2015, 201, 124–133 CrossRef CAS.
  15. Sumanjit, Seema, R. K. Mahajan and V. K. Gupta, J. Ind. Eng. Chem., 2015, 21, 189–197 CrossRef CAS.
  16. V. K. Gupta, I. Ali and V. K. Saini, Water Res., 2007, 41, 3307–3316 CrossRef CAS PubMed.
  17. Y. Xie, J. Wang, M. Wang and X. Ge, J. Hazard. Mater., 2015, 297, 66–73 CrossRef CAS PubMed.
  18. Z. Sun, D. Guo, L. Zhang, H. Li, B. Yang and S. Yan, J. Mater. Chem. B, 2015, 3, 3201–3210 RSC.
  19. V. Polshettiwar, D. Cha, X. Zhang and J. M. Basset, Angew. Chem., Int. Ed., 2010, 49, 9652–9656 CrossRef CAS.
  20. Z. Dong, X. Le, X. Li, W. Zhang, C. Dong and J. Ma, Appl. Catal., B, 2014, 158–159, 129–135 CrossRef CAS.
  21. Y.-P. Xiao, W.-J. Jiang, S. Wan, X. Zhang, J.-S. Hu, Z.-D. Wei and L.-J. Wan, J. Mater. Chem. A, 2013, 1, 7463–7468 CAS.
  22. Y. Wang, L. Zhu, X. Yang, E. Shao, X. Deng, N. Liu and M. Wu, J. Mater. Chem. A, 2015, 3, 2934–2941 CAS.
  23. B. Wang, J. Park, C. Wang, H. Ahn and G. Wang, Electrochim. Acta, 2010, 55, 6812–6817 CrossRef CAS.
  24. E. Yavuz, S. Tokalioglu, H. Sahan and S. Patat, Food Chem., 2016, 194, 463–469 CrossRef CAS PubMed.
  25. B. Yang, Z. Tian, B. Wang, Z. Sun, L. Zhang, Y. Guo, H. Li and S. Yan, RSC Adv., 2015, 5, 20674–20683 RSC.
  26. C. Luo, R. Wei, D. Guo, S. Zhang and S. Yan, Chem. Eng. J., 2013, 225, 406–415 CrossRef CAS.
  27. R. Jiang, Y.-Q. Fu, H.-Y. Zhu, J. Yao and L. Xiao, J. Appl. Polym. Sci., 2012, 125, E540–E549 CrossRef CAS.
  28. X. Le, Z. Dong, X. Li, W. Zhang, M. Le and J. Ma, Catal. Commun., 2015, 59, 21–25 CrossRef CAS.
  29. F. Chen, Z. Zhong, K. Ramesh, L. Chen, E. Widjaja and Y.-F. Han, J. Phys. Chem. B, 2006, 110, 24450–24456 CrossRef PubMed.
  30. Y. Yao, H. Bing, X. Feifei and C. Xiaofeng, Chem. Eng. J., 2011, 170, 82–89 CrossRef CAS.
  31. W. Cheah, S. Hosseini, M. A. Khan, T. G. Chuah and T. S. Y. Choong, Chem. Eng. J., 2013, 215–216, 747–754 CrossRef CAS.
  32. B. Tanhaei, A. Ayati, M. Lahtinen and M. Sillanpää, Chem. Eng. J., 2015, 259, 1–10 CrossRef CAS.
  33. L. Ai, C. Zhang and L. Meng, J. Chem. Eng. Data, 2011, 56, 4217–4225 CrossRef CAS.
  34. J. Goscianska, M. Marciniak and R. Pietrzak, Chem. Eng. J., 2014, 247, 258–264 CrossRef CAS.
  35. S. Chen, J. Zhang, C. Zhang, Q. Yue, Y. Li and C. Li, Desalination, 2010, 252, 149–156 CrossRef CAS.
  36. M. Arshadi, F. Salimi Vahid, J. W. L. Salvacion and M. Soleymanzadeh, Appl. Surf. Sci., 2013, 280, 726–736 CrossRef CAS.
  37. I. I. Fasfous, E. S. Radwan and J. N. Dawoud, Appl. Surf. Sci., 2010, 256, 7246–7252 CrossRef CAS.
  38. Manasi, V. Rajesh and N. Rajesh, Chem. Eng. J., 2014, 248, 342–351 CrossRef CAS.
  39. Y. Yao, H. Bing, X. Feifei and C. Xiaofeng, Chem. Eng. J., 2011, 170, 82–89 CrossRef CAS.
  40. Y. Zhang and Z. Nan, Mater. Res. Bull., 2015, 66, 176–185 CrossRef CAS.
  41. Q. Xin, J. Fu, Z. Chen, S. Liu, Y. Yan, J. Zhang and Q. Xu, J. Environ. Chem. Eng., 2015, 3, 1637–1647 CrossRef CAS.
  42. Z. M. Ni, S. J. Xia, L. G. Wang, F. F. Xing and G. X. Pan, J. Colloid Interface Sci., 2007, 316, 284–291 CrossRef CAS PubMed.
  43. H. Zaghouane-Boudiaf, M. Boutahala and L. Arab, Chem. Eng. J., 2012, 187, 142–149 CrossRef CAS.
  44. Y. Liu, Y. Tian, C. Luo, G. Cui and S. Yan, New J. Chem., 2015, 39, 5484–5492 RSC.

Footnote

Electronic supplementary information (ESI) available. See DOI: 10.1039/c5ra21783k

This journal is © The Royal Society of Chemistry 2015
Click here to see how this site uses Cookies. View our privacy policy here.