A protocol of self-assembled monolayers of fluorescent block molecules for trace Zn(II) sensing: structures and mechanisms

Hongbo Xuab, Huanhuan Wanga, Shenghai Zhoua, Lili Xiaoab, Yun Yan*c and Qunhui Yuan*a
aLaboratory of Environmental Science and Technology, The Xinjiang Technical Institute of Physics and Chemistry, Key Laboratory of Functional Materials and Devices for Special Environments, Chinese Academy of Sciences, Urumqi 830011, China. E-mail: yuanqh@ms.xjb.ac.cn; Fax: +86-991-3838957; Tel: +86-991-3677875
bUniversity of Chinese Academy of Sciences, Beijing, 100049, China
cBeijing National Laboratory for Molecular Sciences (BNLMS), State Key Laboratory for Structural Chemistry of Unstable and Stable Species, College of Chemistry and Molecular Engineering, Peking University, Chengfu Road 202, Beijing 100871, China

Received 30th September 2015 , Accepted 1st December 2015

First published on 3rd December 2015


Abstract

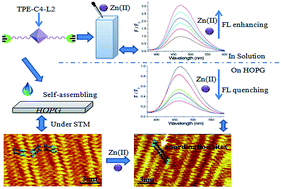
2D epitaxial nanostructures formed by functional molecules at interfaces/surfaces have attracted considerable research interest because of their promising applications in catalysis, photonics, electronic devices, and so on. In this study, we demonstrate for the first time that a monolayer of functional molecules may be used as a fluorescence indicator for heavy metal ions. Self-assembly of bisligand TPE-C4-L2 on highly oriented pyrolytic graphite was performed and the self-assembled monolayer (SAM) was used for trace amounts of Zn(II) sensing with an output signal of fluorescence. In contrast to the Zn(II)-induced fluorescence enhancement of the TPE-C4-L2 block molecule in solution, the self-assembled TPE-C4-L2 film showed quenched fluorescence after Zn(II) was introduced. Using a high-resolution scanning tunneling microscope, the SAM structures of TPE-C4-L2 and its zinc complex were determined. The correlation between their optical properties and structures at the molecular level was also revealed.

1. Introduction

Because top-down methodologies are approaching their theoretical limits, great efforts have been made in bottom-up fabrication of two-dimensional (2D) or three-dimensional (3D) self-assembled nanostructures in a controlled manner. The bottom-up fabrication provides diversity in terms of designing functional nano- architectures, which are believed to be highly relevant to the development of nanotechnology and nanodevices.1,2 In recent years, there has been increasing motivation for the design and fabrication of 2D self-assembled monolayers (SAMs) of functional molecules, owing to their sophisticated structures at the nanoscale.3 In particular, functional surfaces with tailored properties based on the structure and arrangement of block molecules may lead to potential applications of the SAMs in molecular electronics, chiral separation, sensing, thin film materials for lubrication, and so forth.4 Self-assembly is an efficient approach in this case, and has been commonly exploited for construction via non-covalent forces such as van der Waals interactions, hydrogen bonds, π–π stacking, electrostatic, dipole–dipole interactions, and metal–ligand coordination.5–7

The bridge between the properties and the microcosmic structure of the SAMs is the key for improving SAM performance.8 It has been demonstrated that the molecular-scale manipulations of SAM structures can generate SAMs with various properties and functions.9 For example, Fang et al. showed that modified graphene with self-assembled 1-octadecanethiol arrays could be successfully used for mercury detection at 10 ppm.10 Lahann et al. demonstrated that reversible conformational transitions of the molecules in a SAM on a gold substrate could be used as an electrical potential-controlled, hydrophilic–hydrophobic switchable surface.11 It is believed that a clear understanding and effective manipulation of SAM structures would be indispensable for the development of functional surfaces with diverse potential applications, as has been suggested by some of the leading groups in this research field.1,4–7,12–19 To understand the connection between the properties and the assembling structure of the SAMs at a molecular level, techniques such as sum frequency generation (SFG), quartz crystal microbalance (QCM), atomic force microscopy (AFM), and scanning tunneling microscopy (STM) could be relied on.1,10,11,20

Herein, we demonstrate a practical protocol of the self-assembled monolayer of a functional SAM derived from the organic tetraphenylethylene (TPE)-based bisligand TPE-C4-L2 (see Scheme 1 for the molecular structure) on the highly oriented pyrolytic graphite (HOPG) surface. With the aid of STM, we investigated the microcosmic structure and determined its fluorescence (FL) response to Zn(II). As a simple and sensitive approach for species detection, FL sensing of heavy metal ions has been intensively studied, because of their severe risk to human health and the environment.21,22 The design and synthesis of fluorescent molecules is commonly based on the high affinity between organic ligands and metal ions.23,24 Because the sensing occurs in solution, it may not be ideal for detection because of the recycling of sensing probes and secondary pollution of the environment.21 As a consequence, incorporation of sensing molecules onto solid substrates, such as mesoporous silica, electron spun nanofibers, and even filtration paper, has been investigated as an alternative to solution-based sensing.25–27


image file: c5ra20198e-s1.tif
Scheme 1 Chemical and optimized structure of TPE-C4-L2 (K is omitted in the optimized structure).

Inspired by several real-space observations of the in situ coordination of surface-confined ligand arrays and metal ions under electrochemical or ambient conditions,28–32 in which the directional coordination bonds or the subtle balance between molecule–molecule and molecule–substrate interactions after coordination determine the SAM structures. In this work, we firstly demonstrate that the FL response of a TPE-C4-L2 SAM on HOPG can be used to determine the existence of zinc ions in aqueous solution based on the coordination between zinc and the fluorescent building blocks in the SAM. The surface-confined monolayer of TPE-C4-L2 on HOPG exhibited distinct FL quenching upon the addition of Zn(II), after being stabilized with a small amount of “seed” Zn(II). This FL quenching was opposite to the Zn(II)-induced FL enhancement of the TPE-C4-L2 molecules in aqueous solution. Using STM, the SAM structures of TPE-C4-L2 and its complex were revealed, which was used to understand this unusual FL response. This work helps to build the bridge between the macroscopic properties and the microcosmic structures of functional surfaces.

2. Experimental

2.1 Materials

The same batch of TPE-C4-L2 molecules was used as that in our previous report.33 Zn(NO3)2·6H2O (99.5%, spectroscopic grade) and methanol (99.9%, HPLC grade) were purchased from Acros and used without further purification.

2.2 Sample preparation

TPE-C4-L2 or TPE-C4-L2/Zn(NO3)2 (1[thin space (1/6-em)]:[thin space (1/6-em)]1 mixture) was dissolved in methanol to form the sample solution with concentration <0.1 mM. The assembly of TPE-C4-L2 or the TPE-C4-L2/Zn(II) mixture (1[thin space (1/6-em)]:[thin space (1/6-em)]1) was prepared by depositing one drop (7 μL) of sample solution onto a freshly cleaved, highly oriented pyrolytic graphite surface (HOPG, ZYB grade, Bruker). For the in situ coordination, a drop of Zn(NO3)2·6H2O in methanol (0.1 mM) was applied to the same location of the initial drop after successful imaging of the TPE-C4-L2 monolayer at the air/HOPG interface. The HOPG with deposited solution containing molecules was dried in air for 1 h prior to the STM investigation.

2.3 STM investigation

The STM measurements were performed on a Nano IIId scanning probe microscope (Bruker, USA) under ambient conditions. STM images were recorded in constant current mode with a high-resolution scanner. Mechanically cut Pt/Ir (90/10) tips were used as STM probes. All of the STM images are presented without further processing, except for necessary image flattening.

2.4 Fluorescence (FL) sensing of Zn(II)

(1) FL measurement in water solution. TPE-C4-L2 was dissolved in methanol and diluted with DI water to obtain an aqueous solution of 5 μM. Then, the obtained TPE-C4-L2 solution was placed in a quartz cell for FL measurement, with the excitation wavelength set at 310 nm and a slit width of 5 nm. The FL changes were detected upon the addition of Zn(II)/methanol solution (1 μM). The resulting mixture was thoroughly stirred and allowed to stand for 3 min before each measurement.

(2) FL measurement on HOPG surface and glass slide. The TPE-C4-L2 SAM for the FL measurement was prepared by drop-casting 15 μL of a 0.1 mM TPE-C4-L2/methanol solution onto a freshly cleaved HOPG surface because of the bigger HOPG used in this case. The SAM was dried for 10 min and then used for FL measurements. The FL changes were recorded upon the sequential addition of 15 μL Zn(II)/methanol solution (1 μM) every 10 min, with the excitation wavelength set at 310 nm and a slit width of 10 nm. The FL measurements with similar TPE-C4-L2 molecular densities and identical FL setups but on glass slides have also been employed for comparison.

All FL measurements were carried out on an F-7000 luminescence spectrometer at room temperature (ca. 22 °C). A commercial set of accessories for powdered or filmy samples was used for the FL measurement of the SAM on HOPG and glass slide. Briefly, the SAM/HOPG or SAM/glass slide was attached to a metal disc and held in a sample holder for the measurement. The incident light exposed to the samples was at an angle of 45° and the fluorescent signal was detected at an angle of 90° from the incident light.

3. Results and discussion

3.1 Fluorescent behaviours of TPE-C4-L2 in the solution and on HOPG

The detailed synthesis of the bisligand TPE-C4-L2 has been reported elsewhere.33 Scheme 1 shows the chemical structure of TPE-C4-L2, in which the TPE group would act as the reporter for its aggregation-induced emission (AIE) in solution, while the L groups at both ends would act as the acceptors for metal ions owing to coordination. The molecular dimensions of TPE-C4-L2 were estimated by geometry optimization with the MM+ molecular mechanics method (Hyperchem 8 software package). Fig. 1A shows the FL intensity changes of TPE-C4-L2 upon the addition of aqueous Zn(II). A general trend of enhanced response with increasing Zn(II) concentration was observed. This enhanced light emission may result from the formation of the TPE-C4-L2–Zn(II) complex (see in Scheme 2), where the restriction of molecular rotation is the key factor for the AIE phenomenon, as suggested by Tang et al.34
image file: c5ra20198e-f1.tif
Fig. 1 Normalized FL spectra (excitation at 310 nm) of (A) TPE-C4-L2 (5 μM) in aqueous solution and (B) TPE-C4-L2 (0.1 mM, 15 μL) on the HOPG surface before and after the addition of different amounts of Zn(II). The upward and downward arrows indicate the increase of Zn(II) from 0 to 5 μM and 0–0.075 nmol, respectively. Different from the concentration unit of μM, here nmol refers to the amount of zinc ions at the surface instead of the concentration. F0 and F are the normalized FL intensities in the absence and presence of Zn(II), respectively.

image file: c5ra20198e-s2.tif
Scheme 2 Schematic description of the TPE-C4-L2/Zn(II) complex.

The adsorption of bisligands on HOPG was investigated with the aid of STM. The assembly of TPE-C4-L2 for FL experiments and STM observations was prepared with similar molecular densities, which could be achieved by adjusting the volumes of the deposited solutions considering the different areas of the HOPG used. Due to the coffee-ring effect caused by the evaporation of the solvent, the local molecular densities at the near-edge regions on the HOPG surface are generally relatively higher. Therefore, in the FL measurements, the stimulating light was directed only to the centered part of the adlayer/HOPG. The FL performance of the TPE-C4-L2 adlayer on HOPG was investigated in the presence of different concentrations of zinc ions introduced by dropping Zn(NO3)2·6H2O in methanol solution. Unexpectedly, a drastic decrease of normalized FL intensity was observed with increasing amount of Zn(II) from 0 to 0.075 nmol, as shown in Fig. 1B. Control experiments with the addition of pure methanol on the SAM were also performed. It was found that the FL intensity of the SAM was very unstable in the presence of pure methanol, presumably because of resolving of the TPE-C4-L2 SAM into methanol. However, the FL intensity of the SAM after the addition of methanol with zinc at very low concentration (0.015 nmol) was stable in the subsequent presence of pure methanol (see Fig. 2). This indicated that a small amount of zinc caused a change of the SAM structure and made it relatively stable in a methanol environment. For this reason, the FL intensity of the stabilized SAM was used to help understand the effect of zinc on the TPE-C4-L2 SAM. As shown in Fig. 2, the FL intensity decreased with the continuous addition of zinc solution, while the FL intensity was unchanged with the addition of methanol, which proves that zinc interacts with the stabilized SAM structure and quenches the FL.


image file: c5ra20198e-f2.tif
Fig. 2 The change of the FL intensity (excitation at 310 nm, detection at 465 nm) from a stabilized TPE-C4-L2 SAM on HOPG with the addition of Zn(II) or pure methanol. The data points were normalized to the first point. Each addition of Zn(II) was with a drop (15 μL) of 1 μM Zn(II) methanol solution. Each addition of methanol was with a drop (15 μL) of pure methanol (x axial:number of the added drop).

3.2 STM investigation of the TPE-C4-L2 SAM on HOPG

To understand this unusual FL response, STM images of the TPE-C4-L2 SAM on HOPG were analyzed, with the TPE-C4-L2/HOPG samples bearing similar molecular densities as that of the FL experiments shown in Fig. 1B. For the STM observation, some randomly picked areas at the center position were chosen for the investigation, which are located inside the faculous region for FL investigations. Fig. 3A shows a typical large-scale STM image of the TPE-C4-L2 adlayer at the air/HOPG interface. Upon adsorption, the bisligands could usually formed well-ordered domains extending over 100 nm2 with few defects (not shown here). Blank areas aside the well-ordered domains with no adsorption features were also observed, whereas no packing features of the multi-layered adsorptions were found in all the repeated experiments, indicating that the surface coverage of the TPE-C4-L2 adlayer is close to or less than one monolayer. The molecular adlayer included two types of alternately arranged rows with different contrasts (marked as Column I and II in Fig. 3A). The high-resolution image in Fig. 3B shows that ordered molecular rows formed fishbone structures with a crossing angle of 120 ± 2°, in which adjacent molecules staggered half of the intermolecular spacing to form a tail-to-tail arrangement because of lateral repulsion. Several molecular structures are superimposed on the image for clarity.
image file: c5ra20198e-f3.tif
Fig. 3 (A) Typical large-scale STM image of a monolayer of TPE-C4-L2 (I = 370 pA, E = 595 mV). The large white and black arrows marked by ‘Column I’ and ‘Column II’ indicate the alternately arranged molecular rows with different contrasts. (B) High-resolution STM image of the assembled structure (I = 412 pA, E = 600 mV). (C) A tentative model of the TPE-C4-L2 arrays.

It is well known that the contrast of a STM image is dominated by topographic and electronic coupling factors.1,4–7 For this bisligand, the bright protrusion with a size of ca. 0.9 ± 0.1 nm (defined as D1) in Fig. 3B corresponds to the conjugated TPE moiety, considering its higher electron density than the 1,4-dimethoxybutyl chains. According to previous findings, aromatic moieties adopt tilted packing arrangements if limited space is available.29 The formation of bright Column I can be ascribed to π–π stacking between the tilted TPE cores of adjacent molecules since the intermolecular spacing was bigger than the thickness of π–π stacking in 3D crystals (0.4 nm) while smaller than the optimized size of TPE core (0.94 nm).35 Next to the bright columns, parallel 1,4-dimethoxybutyl chains with lower contrast were observed. The length of the chain, defined as D2 (0.9 ± 0.1 nm) in Fig. 3B, was in good agreement with the optimized sizes. Close inspection of Fig. 3B indicated that there is a visible dark trough inside bright Column I. This dark trough with a width of 0.5 ± 0.1 nm (defined as M1 in Fig. 3B) can be assigned to another side chain (C4-L group) of the bisligand molecule. The smaller distance of M1 than the optimized length of the C4-L group indicated that this part of the molecule was directed toward the gas phase. Similar upward orientations of partial side chains of molecules containing conjugated moieties have also been observed and discussed in the literature.29,36 Therefore, in the proposed model in Fig. 3C, only one C4-L group is shown. In this model, TPE-C4-L2 molecules obliquely adsorb on HOPG with the TPE cores adopting a π–π stacking mode, with one side chain in a tail-to-tail fashion and the other in a directed-up orientation (not shown in Fig. 3C). The unit cell is outlined in Fig. 3C with dimensions a = 0.7 ± 0.1 nm, b = 4.7 ± 0.1 nm, and θ = 90 ± 2°.

Based on these unit cell parameters and the amount of the deposited molecules, the coverage of the TPE-C4-L2 should be several monolayers. However, due to the coffee-ring effect caused by the solvent evaporation, no multi-layered adsorption features were observed. The observed blank areas aside the well-ordered molecular domains also confirms the TPE-C4-L2 coverage closed to or less than one monolayer within the regions for FL and STM observations, that were carried out at the center position of the HOPG substrate.

To investigate the change in the molecular structure of the TPE-C4-L2 monolayer induced by Zn(II), a drop of 0.1 mM Zn(II)/methanol solution (7 μL, 0.7 nmol) was added after successful imaging of the TPE-C4-L2 monolayer. As shown in Fig. 4A and B, a new packing structure with some irregular defects formed, and is clearly different from the original bright-and-dark stripes in Fig. 3. This submolecular resolved image ensured identification of the C4-L side chains as well as the Zn(II)-coordination sites (indicated by white arrows). In contrast to the TPE-C4-L2 adlayer in Fig. 3, the sites corresponding to pyridine-2,6-dicarboxylate groups (L ends in Scheme 1) became brighter upon the addition of Zn(II). Compared with Fig. 3B, the 1,4-dimethoxybutyl chain in Fig. 4B twisted to promote metal complexation with a straight metal–ligand chain structure. Similar surface-induced molecular distortion has been reported by Barth et al.37 From the STM image, the distances between two successive bright protrusions along the molecular axis were D3 = 2.1 ± 0.1 nm and D4 = 1.6 ± 0.1 nm. The increased distance between adjacent columns (defined as M2, 1.0 ± 0.1 nm) and the reduced free space between neighboring bright columns must originate from the required molecular rotation during the formation of the complexes. These features clearly demonstrated that structural changes of the TPE-C4-L2 adlayer occurred during in situ metal coordination. It was also noticed that only one side chain of the bisligand was involved in complexation while the other one remained uncomplexed and pointed away from the HOPG surface, similar to the bare TPE-C4-L2 adlayer. As previously reported, Zn(II) adopts 6-coordination with pyridine-2,6-dicarboxylate groups.33


image file: c5ra20198e-f4.tif
Fig. 4 (A) Large scale STM image of the SAM structure of TPE-C4-L2 molecule after the in situ addition of Zn(II), I = 275 pA, E = 779 mV. The white circles highlighted the less ordered area upon Zn(II) addition. (B) High-resolution STM image of the assembled structure of TPE-C4-L2 after the in situ addition of Zn(II) (I = 419 pA, E = 631 mV). The white arrows indicate the complexation sites. (C) A tentative model for the observed structure in (B).

Therefore, 6-coordinated complexation is proposed based on the obtained information from the high-resolution image in Fig. 4B. The Zn(II) centers could not be clearly recognized in the STM image because of a possible electronic effect, as has been pointed out by Barth et al.37 A tentative adsorption model with coordination sites was deduced, as shown in Fig. 4C, with a unit cell of a = 0.7 ± 0.1 nm, b = 11.8 ± 0.1 nm, and θ = 55 ± 2°. It is shown that the STM images in this study are not as clear as those obtained from planar structures, e.g. porphyrins and phthalocyanines.38,39 This should originate from the relatively complicated three-dimensional structures of the metal–organic complexes. Such effect has also been shown in some leading research groups with their reported STM studies on the metal–ligand complexes, especially for the cases of in situ coordinations.40–44

3.3 Further discussion on the mechanism of the unexpected fluorescence response

Using the detailed STM images, the unusual FL response of the TPE-C4-L2 adlayer to Zn(II) can be interpreted by the following assumptions. Firstly, the strong FL of the bisligand SAM can be ascribed to the propeller-like, nonplanar conformation of TPE cores. The stacking force between the conjugated fluorophores in the highly ordered 2D self-assembly at the air/HOPG interface may restrict the molecular rotations, as shown in the STM observation (Fig. 3).45 Secondly, the strong FL of the 2D SAM can be considered as an analogue of AIE emission in the solution phase.34 However, after the addition of Zn(II), the local ordering of the 2D SAM reduced because of the necessary rotation of the 1,4-dimethoxybutyl chain for in situ coordination, which caused quenched FL of the SAM, as shown in Fig. 4A and B. This coordination resulted in a reduced local ordering of the preformed well-ordered stacking of the TPE cores, which leads to the lower degree of restricted intermolecular rotation.46 These may be the reasons, the addition of Zn(II) results in the quenched emissions of fluorescence. The observed structural difference between the coordination of zinc ion with TPE-C4-L2 in solution and at the HOPG interface could be ascribed to the surface confinement. Upon adsorption on HOPG, the conformational freedom of the TPE-C4-L2 molecule would be dramatically decreased due to the existence of intermolecular and molecule–substrate interactions.

The FL experiments with similar TPE-C4-L2 molecular densities but on glass slides have also been employed for comparison. The FL response upon zinc titration also shows a decrease of approximately 30%. However, the step-by-step FL quenching upon zinc titration was changed to fluctuations at about 20% to 30%, which makes its potential application in zinc ion sensing much less promising. This difference should be resulted from the different assembling structures of the TPE-C4-L2 on HOPG and glass slide. As has been discussed above, the highly ordered intermolecular packing between the aromatic TPE fluorophores in the highly ordered 2D SAM and the degraded local ordering of the 2D SAM played key roles for the unusual FL quenching of the TPE-C4-L2 adlayer induced by Zn(II). As for the TPE-C4-L2/glass, due to the inordinance of the underlying glass slide, the highly ordered 2D SAM structure could not be formed. Therefore, it is understandable why the Zn response is also relatively weak and with more fluctuation.

To further confirm the reduced local ordering of the TPE-C4-L2 SAM and the surface-induced molecular distortion upon Zn addition, the SAM of the pre-organized Zn-complexes was also investigated. Fig. 5 shows that all of pre-organized complexes adsorbed equivalently along the lamella axis, indicating the complex adopted a fully extended lying-on arrangement with zinc ions located in between the two adjacent L ends for the formation of linear complexation, as with the coordination mode shown in our earlier report and Scheme 2.33 It can be noticed that the structure of the in situ experiment with the addition of Zn to the TPE-C4-L2 monolayer was different from the SAM formed from a solution of complexes. The complexation mechanism upon in situ Zn addition in this study may involve desorption and conformational adjustment of the already adsorbed molecules, similar as that reported by de Feyter et al.29,30 Also, although the desorbed TPE-C4-L2 ligands tend to twist to accommodate the added Zn ions, they could not form the same metal complexes as that formed in the solution because of the surface confinement from the underlying HOPG.


image file: c5ra20198e-f5.tif
Fig. 5 (A) High-resolution STM image of the SAM structure of TPE-C4-L2/Zn(II) complex, I = 728 pA, E = 399 mV. (B) A tentative model for the observed Fig. 5A. Unit cell dimensions: a = 0.9 ± 0.1 nm, b = 3.9 ± 0.1 nm, and θ = 65 ± 2°.

EDTA was also used as a potential chelating agent to check whether the effect of Zn(II) on the TPE-C4-L2/HOPG is reversible or not. In this experiment, the TPE-C4-L2/HOPG after the addition of 0.03 nmol Zn(II) was firstly dipped into an aqueous solution containing excessive amount of EDTA, then taken out for FL measurement. The extra adsorbed water was carefully removed by applying a napkin at a corner of HOPG. It shows that the FL is not recovered upon the addition of EDTA, implying that the effect of Zn(II) on the HOPG-TPE is irreversible.

Control experiments with other metal ions such as Cu(II), Ni(II), Mg(II) and Co(II) were also carried out following the same procedure used in Zn(II) test with TPE-C4-L2/HOPG, considering their comparable properties for coordination. It was shown in Fig. 6 that the fluorescence of the adlayer responses to Cu(II), Ni(II), Mg(II) and Co(II) with much less sensitivity. However, the mechanism of the different change in the fluorescence of TPE-C4-L2 molecules caused by these metallic ions needs further investigations.


image file: c5ra20198e-f6.tif
Fig. 6 Histogram of the normalized FL of TPE-C4-L2 on HOPG (0.1 mM, 15 μL) in the presence of 0.03 nmol metal ions. F0 and F are the FL intensities from the stabilized TPE-C4-L2 SAMs before and after the addition of one drop metal/methanol solutions (1 μM).

4. Conclusions

In conclusion, a graphite-based SAM of conjugated TPE-C4-L2 molecules was fabricated and used as a protocol for sensing trace amounts of Zn(II). The quenched FL response of this SAM to Zn(II) was opposite to the FL enhancement of TPE-C4-L2 molecules in aqueous solution when Zn(II) was introduced. This unusual FL response was interpreted by using STM observations of the SAMs at the air/HOPG interface before and after the addition of Zn(II) as well as the comparison of FL responses of the TPE-C4-L2/HOPG and TPE-C4-L2/glass slide towards Zn(II). According to the STM observations, π–π interactions between the conjugated TPE cores, van der Waals interactions between the 1,4-dimethoxybutyl chains, and metal–ligand coordination were the main factors that caused the change of the SAM structures and thus the change of the FL response of this molecule.

Acknowledgements

This work was supported by the National Natural Science Foundation of China (21203244 and 21473247), the ‘Hundred Talents Program’ and ‘Western Light Program’ of the Chinese Academy of Sciences (XBBS201317), and the ‘Young Creative Sci-Tech Talents Cultivation Project of Xinjiang Uyghur Autonomous Region (2013711012)’ as well as the ‘Xinjiang International Science and Technology Cooperation Project (20146003)’.

Notes and references

  1. J. V. Barth, G. Costantini and K. Kern, Nature, 2005, 437, 671–679 CrossRef CAS PubMed.
  2. W. Lu and C. M. Lieber, Nat. Mater., 2007, 6, 841–850 CrossRef CAS.
  3. S. A. Claridge, W. S. Liao, J. C. Thomas, Y. X. Zhao, H. H. Cao, S. Cheunkar, A. C. Serino, A. M. Andrews and P. S. Weiss, Chem. Soc. Rev., 2013, 42, 2725–2745 RSC.
  4. K. S. Mali, J. Adisoejoso, E. Ghijsens, I. de Cat and S. de Feyter, Acc. Chem. Res., 2012, 45, 1309–1320 CrossRef CAS.
  5. M. Kim, J. N. Hohman, Y. Cao, K. N. Houk, H. Ma, A. K. Y. Jen and P. S. Weiss, Science, 2011, 331, 1312–1315 CrossRef CAS.
  6. J. Liu, T. Chen, X. Deng, D. Wang, J. Pei and L. J. Wan, J. Am. Chem. Soc., 2011, 133, 21010–21015 CrossRef CAS.
  7. S. Yoshimoto, Y. Honda, O. Ito and K. Itaya, J. Am. Chem. Soc., 2008, 130, 1085–1092 CrossRef CAS.
  8. M. Celestin, S. Krishnan, S. Bhansali, E. Stefanakos and D. Y. Goswami, Nano Res., 2014, 7, 589–625 CrossRef CAS.
  9. J. C. Love, L. A. Estroff, J. K. Kriebel, R. G. Nuzzo and G. M. Whitesides, Chem. Rev., 2015, 105, 1103–1169 CrossRef.
  10. T. Zhang, Z. G. Cheng, Y. B. Wang, Z. J. Li, C. X. Wang, Y. B. Li and Y. Fang, Nano Lett., 2010, 10, 4738–4741 CrossRef CAS.
  11. J. Lahann, Science, 2003, 300, 903–903 Search PubMed.
  12. Q. H. Yuan, C. J. Yan, H. J. Yan, L. J. Wan, B. H. Northrop, H. Jude and P. J. Stang, J. Am. Chem. Soc., 2008, 130, 8878–8887 CrossRef CAS PubMed.
  13. H. Walch, J. Dienstmaier, G. Eder, R. Gutzler, S. Schlogl, T. Sirtl, K. Das, M. Schmittel and M. Lackinger, J. Am. Chem. Soc., 2011, 133, 7909–7915 CrossRef CAS PubMed.
  14. S. Mohnani and D. Bonifazi, Coord. Chem. Rev., 2010, 254, 2342–2362 CrossRef CAS.
  15. X. M. Zhang, Q. D. Zeng and C. Wang, Chem.–Asian. J., 2013, 8, 2330–2340 CrossRef PubMed.
  16. M. Ruben, J. Rojo, F. J. Romero-Salguero, L. H. Uppadine and J. M. Lehn, Angew. Chem., Int. Ed., 2004, 43, 3644–3662 CrossRef CAS PubMed.
  17. M. Kunitake, T. Hattori, S. Miyano and K. Itaya, Langmuir, 2005, 21, 9206–9210 CrossRef CAS.
  18. K. Mullen and J. P. Rabe, Acc. Chem. Res., 2008, 41, 511–520 CrossRef PubMed.
  19. N. Lin, S. Stepanow, M. Ruben, J. V. Barth, P. Broekmann, K. H. Dotz and C.A. Schalley, Top. Curr. Chem., 2009, 287, 1–44 CrossRef CAS PubMed.
  20. F. Zaera, Chem. Rev., 2012, 112, 2920–2986 CrossRef CAS PubMed.
  21. T. Q. Duong and J. S. Kim, Chem. Rev., 2010, 110, 6280–6301 CrossRef PubMed.
  22. I. H. Hwang, K. I. Hong, K. S. Jeong and W. D. Jang, RSC Adv., 2015, 5, 1097–1102 RSC.
  23. D. W. Domaille, E. L. Que and C. J. Chang, Nat. Chem. Biol., 2008, 4, 168–175 CrossRef CAS PubMed.
  24. K. Kaur, R. Saini, A. Kumar, V. Luxami, N. Kaur, P. Singh and S. Kumar, Coord. Chem. Rev., 2012, 256, 1992–2028 CrossRef CAS.
  25. W. Wang, X. L. Wang, Q. B. Yang, X. L. Fei, M. D. Sun and Y. Song, Chem. Commun., 2013, 49, 4833–4835 RSC.
  26. C. Yuan, K. Zhang, Z. P. Zhang and S. H. Wang, Anal. Chem., 2012, 84, 9792–9801 CrossRef CAS PubMed.
  27. R. Metivier, I. Leray, B. Lebeau and B. Valeur, J. Mater. Chem., 2005, 15, 2965–2973 RSC.
  28. X. M. Zhang, Y. T. Shen, S. Wang, Y. Y. Guo, K. Deng, C. Wang and Q. D. Zeng, Sci. Rep., 2012, 2, 742 Search PubMed.
  29. S. de Feyter, M. M. S. Abdel-Mottaleb, N. Schuurmans, B. J. V. Verkuijl, J. H. van Esch, B. L. Feringa and F. C. de Schryver, Chem.–Asian. J., 2004, 10, 1124–1132 CAS.
  30. M. M. S. Abdel-Mottaleb, N. Schuurmans, S. de Feyter, J. van Esch, B. L. Feringa and F. C. de Schryver, Chem. Commun., 2002, 1894–1895 RSC.
  31. Q. H. Yuan and L. J. Wan, Chem.–Asian. J., 2006, 12, 2808–2814 CAS.
  32. S. Yoshimoto, Y. Ono, K. Nishiyama and I. Taniguchi, Phys. Chem. Chem. Phys., 2010, 12, 14442–14444 RSC.
  33. L. M. Xu, L. X. Jiang, M. Drechsler, Y. Sun, Z. R. Liu, J. B. Huang, B. Z. Tang, Z. B. Li, M. A. C. Stuart and Y. Yan, J. Am. Chem. Soc., 2014, 136, 1942–1947 CrossRef CAS PubMed.
  34. Y. N. Hong, J. W. Y. Lam and B. Z. Tang, Chem. Soc. Rev., 2011, 40, 5361–5388 RSC.
  35. M. Mas-Torrent, P. Hadley, S. T. Bromley, N. Crivillers, J. Veciana and C. Rovira, Appl. Phys. Lett., 2005, 86, 012110 CrossRef.
  36. Y. Yang, X. R. Miao, G. Liu, L. Xu, T. T. Wu and W. L. Deng, Appl. Surf. Sci., 2012, 263, 73–78 CrossRef CAS.
  37. D. Heim, D. Ecija, K. Seutert, W. Auwarter, C. Aurisicchio, C. Fabbro, D. Bonifazi and J. V. Barth, J. Am. Chem. Soc., 2010, 132, 6783–6790 CrossRef CAS PubMed.
  38. Y. M. Wang, H. B. Xu, H. H. Wang, S. Z. Li, W. Gan and Q. H. Yuan, RSC Adv., 2014, 4, 20256–20261 RSC.
  39. Y. T. Shen, K. Deng, M. Li, X. M. Zhang, G. Zhou, K. Muellen, Q. D. Zeng and C. Wang, CrystEngComm, 2013, 15, 5526–5531 RSC.
  40. A. Semenov, J. P. Spatz, M. Moller, J. M. Lehn, B. Sell, D. Schubert, C. H. Weidl and U. S. Schubert, Angew. Chem., Int. Ed., 1999, 38, 2547–2550 CrossRef CAS.
  41. D. J. Diaz, S. Bernhard, G. D. Storrier and H. D. Abruna, J. Phys. Chem. C, 2001, 105, 8746–8754 CrossRef CAS.
  42. S. Bernhard, K. Takada, D. J. Diaz, H. D. Abruna and H. Murner, J. Am. Chem. Soc., 2001, 123, 10265–10271 CrossRef CAS.
  43. A. Shchyrba, N. Manh-Thuong, C. Waeckerlin, S. Martens, S. Nowakowska, T. Ivas, J. Roose, T. Nijs, S. Boz, M. Schaer, M. Stohr, C. A. Pignedoli, C. Thilgen, F. Diederich, D. Passerone and T. A. Jung, J. Am. Chem. Soc., 2013, 135, 15270–15273 CrossRef CAS PubMed.
  44. Z. Shi and N. Lin, ChemPhysChem, 2010, 11, 97–100 CrossRef CAS PubMed.
  45. T. Jadhav, B. Dhokale, Y. Patil and R. Misra, RSC Adv., 2015, 5, 68187–68191 RSC.
  46. X. Du, R. Q. Fan, X. M. Wang, L. S. Qiang, P. Wang, S. Gao, H. Zhang, Y. L. Yang and Y. L. Wang, Cryst. Growth Des., 2015, 15, 2402–2412 CAS.

This journal is © The Royal Society of Chemistry 2015
Click here to see how this site uses Cookies. View our privacy policy here.