The pore network and the adsorption characteristics of mesoporous silica aerogel: adsorption kinetics on a timescale of seconds

József Kalmár*a, Mónika Kérib, Zsolt Erdeic, István Bányaib, István Lázárc, Gábor Lentec and István Fábiánc
aMTA-DE Homogeneous Catalysis and Reaction Mechanisms Research Group, Egyetem tér 1, H-4032, Hungary. E-mail: kalmar.jozsef@science.unideb.hu
bDepartment of Colloid and Environmental Chemistry, University of Debrecen, Egyetem tér 1, H-4032, Hungary
cDepartment of Inorganic and Analytical Chemistry, University of Debrecen, Egyetem tér 1, H-4032, Hungary

Received 14th October 2015 , Accepted 9th December 2015

First published on 11th December 2015


Abstract

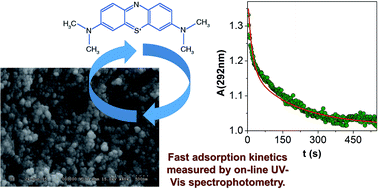
Mesoporous silica aerogel particles of ca. 5 μm in diameter can be conveniently produced by grinding in an aqueous phosphate buffer at pH 7. The pores in the suspended aerogel particles are spherical and their diameter is 18–20 nm, as measured by NMR cryoporometry. NMR diffusiometry revealed that diffusion of water is hindered inside the pores of the aerogel. In spite of steric hindrance, bulk water and pore water exchange rapidly on the millisecond timescale in the suspension, indicating a highly interconnected pore network. The adsorption of methylene blue (MB), as a model compound, was studied on the silica aerogel particles. The process was followed by on-line UV-Vis spectrophotometry after injecting the dye into the aerogel suspension. Biphasic kinetics were observed with the first process complete in ca. 80 s and the second in ca. 600 s. A detailed kinetic model was developed for the interpretation of the results. It postulates a relatively fast adsorption process with Langmuir-type kinetics, and the aggregation of aerogel particles covered by the dye on a longer timescale. The aggregates are involved in a reversible sedimentation process which actually removes MB from the suspension.

Introduction

In recent years, functionalized mesoporous silica aerogels have gained significance in various applications.1–5 This has generated an increasing demand for a thorough description of the kinetics and thermodynamics of the adsorption processes on these advanced materials. The distinctive pore structure of the aerogel facilitates the adsorption of cationic molecules.6–8 Adsorption of small molecules on mesoporous silica aerogel is fast, thus only limited kinetic and mechanistic information is available regarding these processes in the literature.9–11 In contrast, there are numerous reports on adsorption processes applied in the removal of environmental pollutants from wastewater, heterogeneous catalysis etc.12–16

The evaluation of the experimental data on adsorption kinetics is often simplified, because the adsorption usually cannot be followed with sufficiently high time resolution, i.e. there are not enough data points in the time resolved experiments for a sophisticated evaluation. The main reason for the low time resolution is that the kinetic data are collected by off-line analysis in most cases. Measuring a data point by sampling and analyzing the system off-line takes at least 1 to 5 min, while a fast adsorption process is usually complete in a few minutes. To overcome this problem and follow fast adsorption processes with high time resolution, specialized on-line analytical techniques such as quartz microbalance measurements,17,18 laser optical spectrometry19,20 and flow-cell spectrophotometry21,22 can be implemented.

The main objective of this study is the understanding of the intimate nature of the adsorption properties of mesoporous hydrophilic silica aerogel particles suspended in water. We characterize the pore size distribution and the structure of the pore network of the aerogel by two porometry methods and by NMR diffusiometry. The common cationic dye methylene blue (MB) was selected to be the model compound for fast adsorption kinetic studies, solely, because it is still widely applied in adsorption and catalytic studies.23,24 We developed a novel, on-line UV-Vis spectrophotometric method to follow the adsorption kinetics with 1 s time resolution. It will be shown that in spite of common perceptions, sophisticated spectrophotometry is suitable to provide reliable and reproducible kinetic data in a heterogeneous system. Thus, the same methodology may be suitable for monitoring fast adsorption processes in other systems.

Finally, we postulate an advanced kinetic model based on Langmuir-type kinetics25–29 for the interpretation of the kinetic and spectroscopic results.

Experimental

Chemicals and solutions

Methanol (reagent grade), absolute ethanol (reagent grade), acetone (reagent grade), 25 wt% ammonia solutions (reagent grade), tetramethyl orthosilicate (TMOS) (Purum p.a.), acetylacetone (ReagentPlus) and methylene blue (Purum p.a.) were obtained from Sigma-Aldrich (USA). These reagents were used without further purification. Ion exchanged and Milli-Q Synthesis A10 ultra-filtered (EMD Millipore, Billerica, MA, USA) water was used to prepare all solutions. The resistivity of this water was never smaller than 18.2 MΩ, and its organic content was less than 10 ppb. This water is referred to as DI water in the rest of this paper. pH was measured by a Metrohm 6.0234.110 combination glass electrode attached to a Metrohm 721 NET Titrino titrating unit. The electrode was calibrated by two buffers according to IUPAC recommendations and the reading was converted into −log[H+].30 The ionic strength was adjusted and kept at a fixed value in all experiments by using NaH2PO4–Na2HPO4 25–25 mM buffer (I = 0.10 M).

Aerogel preparation

Silica aerogel was synthesized by the classical sol–gel process.8,31 First, two solutions (“A” and “B”) were prepared. Solution “A” was made from tetramethyl orthosilicate (TMOS, 3.00 mL) dissolved in methanol (7.00 mL). Solution “B” contained methanol (15.0 mL), distilled water (3.00 mL) and aqueous ammonia solution (1.00 mL of 6.2 M). Solutions “A” and “B” were mixed under stirring, then poured into a PTFE-lined plastic mold and sealed. An alcogel formed in 24 h, which was transferred into a perforated frame and aged in a mixture of methanol (250 mL) and ammonia solution (25 wt%, 20 mL) for one day. After 24 h, the sample was soaked in 300 mL of methanol twice to wash out ammonia, then in 300 mL volumes of acetone-methanol mixtures, in which the acetone content was increased in 25% (v/v) steps. Finally, the sample was stored in 2000 mL of dry and freshly distilled acetone. Acetone was extracted from the gel by liquid carbon dioxide in a supercritical dryer and the gel was dried under supercritical conditions32 (constant 80 °C, max. pressure 140 bar). The maximum pressure was maintained for 3 h to allow equilibration of the gel structure, then released through a needle valve at a rate of 2 bar per min in a custom-made supercritical dryer presented in our earlier study.33 Finally, the pristine aerogel was heated at 500 °C for 8 h in a furnace under aerobic conditions to get the final calcined form. This calcined silica aerogel was used for all experiments, and referred to simply as “aerogel” in the rest of this paper.

Aerogel characterization

Scanning electron microscopic (SEM) images were recorded on a Hitachi S-4300 instrument (Hitachi Ltd., Tokyo, Japan). A monolithic aerogel sample of ca. 4 mm was embedded in Wood's metal to decrease the possibility of accumulation of electric charge on the highly insulating aerogel. All fresh fracture surfaces were covered by a sputtered gold conductive layer. Typically, 10–30 kV accelerating voltage was used for taking SEM images.

Nitrogen gas porosimetry measurements were performed on a Quantachrome Nova 2200e surface area and porosity analyzer (Quantachrome Instruments, Boynton Beach, FL, USA) after the samples were outgassed under vacuum at 300 °C for 3 h.

IR spectra were recorded on a Jasco FT/IR 4100 spectrometer (JASCO Applied Sciences, Halifax, Canada). The aerogel was milled and pelleted into KBr for recording transmission IR spectra.

Aerogel particles suspended in phosphate buffer were monitored by using an inverted microscope (Axio Observer A1, Zeiss) equipped with a high speed CCD camera.

Particle size distribution in aerogel suspensions were measured by a Malvern Mastersizer 2000 (Malvern Instruments Ltd., Malvern, UK) laser diffraction particle size analyzer. Data were collected with two lasers of different wavelengths for 12–12 s in a flow-through cell under continuous circulation. The angular scattering intensity data were evaluated by the instrument controlling software using the Mie theory of light scattering. The particle size is reported as a volume equivalent sphere diameter. The representative refraction index of 1.006 of the aerogel was used for the calculations.

NMR measurements

For NMR measurements, the aerogel was suspended in DI water by the use of a Potter-Elvehjem tissue grinder, and centrifuged at 8000 × g. The resulting slurry contained 2.3 times more bulk water than pore water (as discussed later in relation to the NMR cryoporometry experiment). This slurry was introduced into a Teflon NMR tube, and used for NMR diffusiometry and cryoporometry experiments. 1H-NMR spin echo and diffusion ordered spectroscopic (DOSY) experiments were performed with a Bruker Avance II 400 NMR spectrometer using standard pulse programs provided with the spectrometer. MestreNova 8.1 software was used for FID post processing.
NMR diffusiometry. Standard protocols were implemented.34 A stimulated spin echo pulse sequence was employed using bipolar gradient pulses to decrease eddy currents (BIPLED) at 298 ± 0.2 K. Typical parameters for diffusion experiments were: diffusion time (Δ) from 16 to 150 ms and length of gradient pulse (δ) from 1.6 to 4 ms. The diffusion data were evaluated according to the well-known expression given in eqn (1):
 
I = I0[thin space (1/6-em)]exp{−Dobsγ2(Δδ/3)δ2G2} (1)

The pulsed gradient strength (G) was increased with 64 square-equidistant steps from 0 to approximately 50 Gauss cm−1. The coefficient Dobsγ2 was calculated for each experiment by fitting the exponential curve of eqn (1) to the measured echo intensity (I) as a function of G2, and using the known parameters. The real diffusion coefficient (D) was calculated after calibration, which was based on measuring the diffusion of D2O in water by this method.

NMR cryoporometry. The theory and applications of NMR cryoporometry were discussed and analyzed in detail by Strange et. al., Petrov and Furó.35–37 The physico-chemical background of the method is given by the modified Gibbs–Thomson equations, which describe the melting and freezing point depressions of liquids in confined spaces.
 
image file: c5ra21353c-t1.tif(2a)
 
image file: c5ra21353c-t2.tif(2b)

In eqn (2a), ΔTm is the melting point depression expressed as a difference between the phase transition temperature of the bulk (T0) and the confined liquid (Tm). Kc is the cryoporometric constant, nm is the geometric factor describing melting and rp stands for the average pore radius. In eqn (2b), the symbols denote the corresponding parameters for freezing. The values of ΔTm and ΔTf, and nm and nf are different, because melting and freezing of liquids in confined spaces show a hysteresis in general. In NMR cryoporometry, the amount of liquid water is quantified at different temperatures during melting-freezing cycles.36 The water signal intensity is plotted as a function of temperature and the melting and freezing points of the confined liquid are determined from the inflection of the two hysteresis curves.

The aerogel slurry was cooled to −15 °C in a Teflon NMR tube. The probe head was also cooled to this temperature using a built-in regulator for stabilizing and regulating the temperature with air flow through a Bruker BSCU-05 cooling unit. The temperature was calibrated using glycol and methanol.38 After temperature equilibration, the 1H NMR spectrum of the sample was recorded by a spin echo sequence. The typical echo time was 1.5 ms, the length of the 90° pulse was 10.2 μs. The sample was melted by elevating the temperature to 4 °C in 0.2 °C steps by using an automated program. From 4 °C, the sample was cooled to −14 °C in 0.2 °C steps and freezing was monitored. In most freezing experiments, the sample was not completely melted before freezing cycle in order to avoid overcooling. Data evaluation is detailed in the Discussion.

Adsorption experiments

For the kinetic experiments the aerogel was suspended in a pH 7 phosphate buffer up to the maximum concentration of 340 μg mL−1 by the use of a Potter-Elvehjem tissue grinder and intensive sonication. The most convenient way to follow the kinetics of the adsorption of MB on aerogel particles was by simply injecting an aqueous MB solution into an aerogel suspension under continuous stirring and following the spectral change on-line by a UV-Vis spectrophotometer. As it was reported earlier, the drawback of this method is that some time is required for complete homogenization of the system after the injection.39 The general protocol for adsorption measurements was the following. A cuvette containing 1.5–2.0 mL aerogel suspension was placed into the cell holder of the spectrophotometer, thermostated to 25 °C and stirred by a Teflon coated 2 × 8 mm magnetic rod at 1000 rpm. Spectrophotometric detection was started, and a few seconds later, 10–500 μL buffered MB solution was promptly injected into the cuvette by a pipette. Absorbance change was followed in the 200–400 nm wavelength range for at least 900 s with a minimum time resolution of 1 s. The moment of injection can clearly be identified in the recorded kinetic traces. The time needed for complete homogenization following the injection was determined to be 8 s.

The UV-Vis spectra were recorded in a custom built spectrophotometer equipped with an AvaSpec-ULS-2048LTRC CCD detector manufactured by Avantes (Apeldoorn, The Netherlands). The specifications of the instrument are detailed elsewhere.40 The detector was typically operated with 15 ms integration time and 20–50 subsequent spectra were averaged for smoothing. In these experiments, steady absorbance decay was detected, which was attributed to the depletion of the dye from solution due to adsorption on aerogel.

Data treatment

The experimental data were fitted to the appropriate expressions using Levenberg–Marquardt least squares procedures with the Micromath Scientist 2.0 software (Micromath Scientific Software, St. Louis, MO, USA). Simultaneous non-linear fitting of multiple kinetic curves recorded under different initial conditions (global kinetic analysis) was performed with the program package ZiTa41,42 using the GEAR algorithm.43

Results and discussion

Characterization of the aerogel

The calcined aerogel monolith is transparent with only a hint of opalescence due to Raleigh light scattering. The SEM image of a freshly fractured surface is shown in Fig. 1. The aerogel is built up from spherical particles of ca. 50 nm in diameter, which is a characteristic structural feature of silica aerogels.8,31 The porosity of the dry aerogel was measured by the N2 adsorption technique. The adsorption and desorption isotherms together with the pore size distribution calculated by the non-linear DFT method are shown in the ESI. Pores of 15–17 nm in diameter dominate the structure. Their distribution in the logarithmic scale is unimodal.
image file: c5ra21353c-f1.tif
Fig. 1 SEM micrograph of a fresh fracture surface of the calcined silica aerogel.

The transmission IR spectrum of the aerogel is shown in Fig. S1 in the ESI. An interesting feature of the spectrum is the presence of a peak at 960 cm−1. This IR peak can be assigned to Si–OH stretching,44 and its clear presence indicates that a relatively large amount of terminal Si–OH bonds formed during synthesis, making the aerogel highly hydrophilic.

Properties of the aerogel suspension

Particle size and aggregation. The microscopic image of the fresh suspension is shown in Fig. S2A in the ESI. As shown, uniform, homogeneous particles of ca. 5 μm in diameter can be generated by this method. However, the suspension tends to age and the fine particles aggregate to ca. 100 μm multi-particle blocks (Fig. S2B in the ESI). The aggregation is complete in about 2 h, regardless whether the suspension is stirred or not. Afterwards, the aged suspension is stable. The size distribution of the aerogel particles during the course of aging is shown in Fig. 2. Fig. 2A was generated by counting the particles of different sizes in the micrographs. Fig. 2B shows the results of dynamic light scattering particle size determination. The final, stable suspension was used for all the experiments described in this paper, unless explicitly stated otherwise.
image file: c5ra21353c-f2.tif
Fig. 2 Aging of the aerogel suspension. (A – left) The size distribution of aerogel particles (<10 μm) and aggregated blocks (>10 μm) measured by conventional microscopy. Each colored column represents the weight percent contribution of a given fraction. (B) Size distribution by the volume of aerogel particles in a fresh and in an aged suspension measured by dynamic light scattering (DLS).
Porosity. The pore size distribution of the aerogel suspension was studied by NMR cryoporometry following the methodology of Petrov and Furó,36 as described in the Experimental. Fig. 3A shows the water signal intensity as a function of temperature obtained in one melting-freezing cycle. The intensities at the plateau (3.07 × 10⁻⁴ arb. unit) and after complete melting (10.24 × 10⁻⁴ arb. unit) are proportional to the amount of confined water and the total amount of water, respectively. Thus, the relative amount of bulk water to confined water is about 2.3 in the aerogel slurry. The inflexion points on the experimental curves occur at T0 = 273.2 K, Tm = 267.4 K and Tf = 264.2 K. The ΔTm[thin space (1/6-em)]:[thin space (1/6-em)]ΔTf ratio found in this study is almost exactly 2[thin space (1/6-em)]:[thin space (1/6-em)]3, confirming that the shape of the pores are predominantly spherical in the aerogel. According to theoretical considerations, nm = 2 and nf = 3 when the pores are spherical.36 The cryoporometric constant for water is 30 K nm.45 The pore size distribution of the aerogel was reconstructed both from the melting and the freezing curves by using eqn (2a) and (2b) (nm = 2, nf = 3), respectively. The individually calculated points were fitted to the log-normal distribution as shown in Fig. 3B. Pores of 18–20 nm in diameter dominate in the suspended aerogel particles. This result is in excellent agreement with the pore size distribution determined by N2 adsorption experiments for the dry aerogel, confirming that the average pore size of the aerogel does not change when it is suspended in water.
image file: c5ra21353c-f3.tif
Fig. 3 (A – left) Melting (red) and freezing (blue) curves of the aerogel suspension measured by NMR cryoporometry. The position of the inflection points and the height of the plateaus are indicated in the plot. (B) Log-normal size distribution of the pores in the aerogel particles. Reconstructed from (A) assuming spherical pores (red: from the melting curve, blue: from the freezing curve).
Water self-diffusion in the pores. The interconnectivity of the pore network of the suspended aerogel was studied by NMR diffusiometry. The intensity decay in a diffusion experiment is clearly single exponential at every diffusion time (vide infra). This observation is strengthened by the inverse Laplace transformation of the data, as shown in the ESI (Fig. S3). The single exponential decay means that the exchange between the confined and bulk water is fast on the diffusion timescale, thus only the weighted average of the two diffusion coefficients can be determined. In comparison, there are cases when the two diffusion domains, confined and bulk, can be observed separately, e.g. in the case of silica xerogels, when the exchange process is slow enough.46 The rate of exchange increases with the increasing permeability of pores. Thus, our experimental results predict high permeability of pore walls in the aerogel suspension. Fitting eqn (1) to the single exponential decay yields D = (1.9 ± 0.1) × 10−5 cm2 s−1 for the self-diffusion coefficient of water in the aerogel suspension. When the exchange of bulk and pore water is fast, the experimental diffusion coefficient, D, is the weighted average of the diffusion coefficients in the two domains (eqn (3)).47
 
D = xbulkDbulk + xporeDpore (3)
where xi is the molar fraction of water and Di is the diffusion coefficient of water in a given diffusion domain. The self-diffusion coefficient of water in bulk was measured independently: Dbulk = 2.4 × 10⁻⁵ cm2 s−1. The relative amounts of bulk and pore water are known from the NMR cryoporometric measurements, thus Dpore = 9.4 × 10⁻⁶ cm2 s−1 from eqn (3). The following arguments lend further support to the results presented here. On the basis of the Einstein equation, the average time needed for a water molecule to move from one end to the other of a 5 μm aerogel particle through the pores is estimated to be 4.4 ms with Dpore = 9.4 × 10⁻⁶ cm2 s−1 taking into account three dimensional motion. The shortest observation time in our diffusion experiments was 16 ms. It follows that one water molecule could travel in, through and out of an aerogel particle at least 4 times within this time frame, i.e. a thorough exchange could indeed occur between bulk and pore water. The value of Dpore obtained here agrees reasonably well with 5 × 10⁻⁶ cm2 s−1, which was measured in silica xerogels with ca. 5 nm wide, highly interconnected pores.46 The similarity of these diffusion coefficients strongly suggests analogies between the two systems and implies that the pores inside the mesoporous aerogel particles are also highly interconnected. A further observation in the suspended aerogel is that the measured diffusion coefficient (D) is independent of the diffusion time, which was varied by changing Δ from 16 ms to 150 ms, while δ was kept constant (4 ms). This observation can be interpreted by considering that the majority of the water molecules experience the hindrance of the wall of the 18–20 nm wide pores even under the shortest diffusion time. Consequently, the diffusion within the pore is somewhat slower than in the bulk. However, fast exchange between the two domains still remains feasible and averages the diffusion coefficients. In other words, the diffusion coefficient in the pore is always in the “hindered regime” and independent of the diffusion time.46,48

Kinetics of the adsorption of MB on aerogel particles

Kinetic experiments were performed at pH 6.9 in 50 mM phosphate buffer (I = 0.10 M) following the general protocol described in the Experimental. In the first set of experiments, the initial concentration of the aerogel was kept constant in the suspension (340 μg mL−1), while the initial concentration of MB (cMB) was varied between 2.5 and 36 μM. In the second set of experiments the concentration of the aerogel was varied between 17 and 340 μg mL−1 at constant cMB = 24 μM. When MB solution is injected into an aerogel suspension, about 8 s is required for complete dispersion of the dye.39 After this initial period, a steady decrease in absorbance was detected with biphasic kinetic characteristics. The first step is complete in ca. 80 s and the second step takes about 600 s. Representative kinetic curves are shown in Fig. 4. During the adsorption experiments the aerogel particles became visibly colored and aggregated to large (0.5–1.0 mm) blocks, which partly settled from the suspension even under continuous stirring.
image file: c5ra21353c-f4.tif
Fig. 4 Kinetic curves detected after injecting MB solutions into aged aerogel suspensions. The initial concentration of the aerogel was constant (340 μg mL−1), and the initial concentrations of MB were 2.5, 7.4, 9.9, 14.8, 22.0, 29.1 and 36.1 μM. Kinetic curves are shown from 8 s after injection. Green dots are experimental data points. Continuous red lines are the results of global data fitting to the kinetic model given in Scheme 1. c(NaH2PO4 + Na2HPO4) = 50 mM; pH = 6.93; 25 °C; 1000 rpm stirring.
Adsorption isotherm. The aerogel was centrifuged after each kinetic experiment and the remaining amount of dissolved MB was quantified by spectrophotometry. These data were treated as individual batch adsorption measurements, and the adsorption isotherm was constructed accordingly (Fig. 5). The total absorbance change measured during each kinetic experiment is also shown in Fig. 5. As expected, the amount of adsorbed MB calculated from the absorbance of the centrifuged solution is the same as given by the total absorbance change during a kinetic experiment. The experimental isotherm was fitted with the Langmuir model. The detailed mathematical transformations used during the deduction of the following equations are shown in the ESI.
 
MB + S [left over right harpoons] SMB (4)
 
image file: c5ra21353c-t3.tif(5)
 
image file: c5ra21353c-t4.tif(6)
where MB is dissolved methylene blue, S represents an unoccupied adsorption site on the aerogel and SMB is the adsorbed dye occupying an adsorption site. Kads is the Langmuir equilibrium constant. The total concentration of MB is cMB. The total concentration of the aerogel is cgel in g L−1 units. The number of adsorption sites on the aerogel particles is s in mol g−1 units. Thus, s represents the adsorptive capacity of the aerogel. Square brackets denote equilibrium concentrations. θS and θSMB represent the surface coverage of free and occupied sites, respectively. The absorbance change due to the depletion of dissolved MB is ΔA. The molar absorbance of MB at 292 nm is ε = 3.62 × 10⁴ M−1 cm−1 and the optical path length of the cuvette is l = 1.000 cm. The experimental isotherm of Fig. 5 was fitted with eqn (6) by using the know parameters. The fit is excellent, and the following parameters were estimated: Kads = (1.8 ± 0.2) × 105 M−1, s = 48 ± 5 μmol g−1.

image file: c5ra21353c-f5.tif
Fig. 5 The experimental isotherm of the adsorption of MB on aerogel particles. The y axis displays the absorbance change accompanying the depletion of the dye from solution due to adsorption. Brown dots: measured by the batch method. Green dots: determined from the kinetic experiments (cf. Fig. 4). Brown line: best fit by eqn (6). c(gel) = 340 μg mL−1; c(NaH2PO4 + Na2HPO4) = 50 mM; pH = 6.93; 25 °C; 1000 rpm stirring.
The validity of Beer's law. The measured absorbance of the suspension containing MB is the superposition of two components: the absorbance of dissolved MB and the apparent absorbance of the aerogel particles due to light scattering. The additivity of the absorbances of heterogeneous and homogeneous components has been tested in several systems earlier. To some extent, the results confirm that the absorbances of the components are additive in a limited concentration range.21,22,49 In Fig. 6A, we present the spectrum of a well stirred aerogel suspension, the spectrum recorded immediately after the addition of MB to this suspension, the difference spectrum of these two and, finally, the spectrum of a pure MB solution of the same concentration. The difference spectrum and the spectrum of the pure MB solution are practically identical confirming that the apparent absorbance arising from the light scattering of the suspension and the absorbance of dissolved MB is additive in the studied wavelength range. The apparent absorbance of a series of aerogel suspensions are shown in Fig. 6B. The absorbance vs. cgel plot is linear with zero intercept. Fig. S4 shows the absorbance of MB measured immediately after adding the dye to an aerogel suspension. At this instance, practically no MB is absorbed and the concentration of free MB is cMB. Furthermore, the aerogel is not yet altered by adsorption. The absorbance vs. cMB plot in Fig. S4 is linear and the intercept gives the absorbance of the original suspension. In conclusion, Fig. 6A and B and S4 undoubtedly demonstrate that the heterogeneous system of the aerogel and MB obeys Beer's law without any deviation within the experimental errors in the applied concentration and wavelength range. Accordingly, any absorbance change observed in this system is solely due to chemical and physical processes associated with specific interactions.
image file: c5ra21353c-f6.tif
Fig. 6 (A): (a) The spectrum of a well stirred aerogel suspension (331 μg mL−1), (b) the spectrum recorded immediately after the addition of MB to this suspension, (c) the difference spectrum of these two, (d) the spectrum of the pure MB solution (10.2 μM). (B) Absorbance versus concentration plot of the aerogel suspension. The absorbance is due to the light scattering of the suspension. c(NaH2PO4 + Na2HPO4) = 50 mM; pH = 6.91; 25 °C; 1000 rpm stirring.

The excellent linearity seen in Fig. 6 and S4 is probably due to the unique positioning of the collimator lenses in the Avantes fiber-optic spectrophotometer.40 In accordance with Beer's law, the absorbance at the instance of mixing MB and the aerogel is given by:

 
A0 = A0MB + A0gel = {εMBcMB + εgelcgel}l (7)
where A0, A0MB and A0gel are the absorbances of the mixture, dissolved MB and the suspended aerogel. The initial (total) concentrations of MB and the aerogel is cMB and cgel, respectively. The optical pathlength is l, and εMB and εgel are the molar absorbance of MB and the apparent molar absorbance of the aerogel, respectively.

Kinetic model. The concentration of dissolved MB decreases in time after MB is added to the aerogel suspension due to adsorption. This adsorption process removes the absorbing species from the light path and the absorbance decreases. The apparent absorbance of the aerogel caused by light scattering also decreases because a portion of the particles covered by MB aggregate into large blocks (0.5–1 mm). Some of the aggregates temporally settle down in the stirred suspension, i.e. disappear from the light path. The aggregation of the aerogel particles is accelerated by MB, because the cationic dye masks the negative surface charge of the particles upon adsorption, thus, reducing the Coulomb distraction between them.

First, the initial rate (v0) was determined as a function of initial MB (cMB) and aerogel (cgel) concentrations (Fig. S5A and S5B in the ESI). The initial rate is proportional to the initial concentrations of both components in the well-stirred system. The non-zero intercept in the v0 vs. cgel curve is due to the adsorption of MB on the surface of the quartz cuvette, as it was confirmed in adsorption experiments in the absence of the aerogel.39 The results confirm that the initial adsorption process is first order with respect to both the dye and the adsorbent. These findings also indicate that the simplest kinetic model, i.e. the Langmuir model,25,28,29 can be applied to describe the reversible adsorption of MB on aerogel particles in the whole concentration range.

In order to adequately interpret the observed biphasic kinetics (cf. Fig. 4), the adsorption facilitated aggregation of aerogel particles also needs to be taken into account during the evaluation of the data. The evidence for the aggregation of aerogel particles following the adsorption of MB is the steady decrease of absorbance at wavelengths where MB does not absorb (e.g. at 800 nm), as seen in Fig. S6A. For the sake of simplicity, the aggregation is assumed to be an equilibrium process which is second order with respect to particles covered by MB.

The kinetic model incorporating both the adsorption and the aggregation steps is given in Scheme 1, together with the rate laws describing the system. Four species are defined in Scheme 1 which are in equilibrium with each other: MB, aerogel with empty active sites (S), aerogel with occupied active sites (SMB) and aggregate. The sites of the aggregate are also occupied. The contribution of these species to the measured absorbance signal at time t can be given by modifying eqn (7):

 
At = AtMB + AtS + AtSMB + Ataggr (8a)


image file: c5ra21353c-s1.tif
Scheme 1 Kinetic model detailing the adsorption of methylene blue (MB) on aerogel particles. A free adsorption site on the aerogel is symbolized by S, and an occupied site by SMB. The first process (R1 and R2) is the reversible adsorption of the dye, and the second process (R3 and R4) is the reversible aggregation of those aerogel particles which are covered by MB. The time-dependent concentrations of dissolved MB, free and covered aerogel particles and aggregates are [MB], [S], [SMB] and [aggr], respectively. The initial (total) concentrations of MB and the aerogel are cMB and cgel, respectively. Time-dependent surface coverage is θ. The adsorptive capacity of the aerogel is s = 48 μmol g−1.

By substituting the time-dependent concentrations of these species defined in Scheme 1:

 
At = {εMB[MB] + εgel[S] + ε*gel[SMB] + εaggr[aggr]}l (8b)
where At is the measured absorbance, and ε denotes the molar absorbance of each species. Integrating the ordinary differential equation system of Scheme 1 gives At as a function of reaction time. By using this method, the kinetic curves in Fig. 4 were fitted simultaneously by minimizing the difference between the measured and calculated absorbance values. The non-linear global fitting was performed by the software ZiTa. This software solves the input differential equation system numerically using the GEAR algorithm, and iteratively finds the optimum values of the rate constants and molar absorbances as parameters of a Levenberg–Marquardt least-squares. The independently measured molar absorbances of MB and the aerogel were included with fixed values in the calculations. The fit of the kinetic traces is reasonably good at every cMB, as shown in Fig. 4. The estimated rate constants are given in Scheme 1.

The estimated value of ε*gel is the same within the experimental error as the independently determined εgel. This result implies that the adsorbed MB does not contribute to the measured absorbance. The key issue is why the adsorbed MB does not change the apparent absorbance of the aerogel particles? A possible interpretation can be given, if we consider that the pores in the aerogel particles are fully interconnected and assume that MB is adsorbed mainly inside the pores. Consequently, most of the adsorbed MB is not exposed directly to incoming photons. Photons colliding with aerogel particles are scattered or absorbed by the particles (or by adsorbed MB on the surface). However, in terms of conventional absorbance measurement it is irrelevant which of the two processes lower the number of photons reaching the detector. The only important factor is the overall effective scattering/absorbing property of the particles in the light path. Because the adsorption of MB alone is not expected to change significantly the surface area, the morphology or the density of the particles, S and SMB exhibit very similar overall scattering/absorbing properties.

The estimated value of εaggr is zero within the error limits, meaning that the contribution of the aggregates to the absorbance is practically zero. This is not unexpected because the effect of light scattering (considered as virtual absorbance here) decreases with increasing particle size. In addition, the aggregates are removed from the light path via sedimentation. Since the suspension is continuously stirred, the deposition of the aggregates is also assumed to be a semi-equilibrium process. Thus, in the reverse direction deposited aggregates are moved to the light path and disintegrate. Direct experimental data are not available for the description of the deposition equilibrium, but the contribution of this process to the kinetics is integrated into the R3 and R4 steps in the model of Scheme 1.

The adequate fit lends strong support to the kinetic scheme postulated here. It is worth noting, that another model to describe biphasic kinetics could be constructed by assuming that MB adsorbs to aerogel particles on multiple different sites,50 e.g. first on the surface and later in the pores. This multi-step adsorption of MB, however, can be ruled out because NMR diffusiometry showed that small molecules can enter and exit the pores of the aerogel uninhibited on a few milliseconds timescale. Thus, adsorption must be uniform throughout a particle during the observed adsorption process (80 s).

Results obtained with fresh suspension. The adsorption experiments were performed with fresh aerogel suspension as well. As discussed before, the fresh suspension contains homogeneous aerogel particles with 5–10 μm diameter, while the aged suspension contains mainly larger (20–100 μm) blocks aggregated from the fine particles (Fig. 2, S2A and S2B). All kinetic experiments detailed above were repeated with aerogel suspensions prepared immediately before each measurement. Representative kinetic traces are shown in Fig. 7. The absorbance decrease due to the aggregation of aerogel particles following the adsorption of MB is shown in Fig. S6B. The methodology of data evaluation was exactly the same as detailed before. The adsorptive capacity of the fresh suspension was found to be s = 274 ± 46 μmol g−1, ca. 5 times the capacity of the aged suspension. The bigger capacity is consistent with the fact that aerogel particles do not yet form larger blocks (cf. Fig. 2), and thus the effective specific surface of the aerogel is higher. The kinetic model of Scheme 1 fits the measured kinetic curves (cf. Fig. 7) very well, the estimated rate constants are: kfresh1 = (9.3 ± 0.4) × 101 M−1 s−1, kfresh2 = (1.18 ± 0.06) × 10−2 s−1, kfresh3 = (1.38 ± 0.07) × 102 M−1 s−1, kfresh4 = 0 s−1. Interestingly, the rate constant of R1 is lower in the freshly prepared solution. An obvious explanation cannot be given for this observation. Perhaps it is due to a slower effective mass transfer towards smaller particles drifting faster in a well stirred heterogeneous system. It is also interesting to note that the MB facilitated aggregation of the aerogel particles in the fresh suspension is practically irreversible, because the fitted rate constant for the disaggregation (R4 in Scheme 1) is zero within experimental error. This observation is in agreement with the model because aggregation is relatively fast in the fresh suspension and the reverse step does not have a significant contribution to the overall process. This is not surprising, as it was established before that the small aerogel particles tend to aggregate even in the absence of agents masking their surfaces charge (cf. Fig. 2).
image file: c5ra21353c-f7.tif
Fig. 7 Kinetic curves detected after injecting MB solutions into fresh aerogel suspensions. The initial concentration of the aerogel was constant (341 μg mL−1), and the initial concentrations of MB were 9.9, 14.8, 22.0, 29.1, 36.1 and 45.3 μM. Kinetic curves are shown from 8 s after injection. Green dots are experimental data points. Continuous red lines are the results of global data fitting to the kinetic model given in Scheme 1. c(NaH2PO4 + Na2HPO4) = 50 mM; pH = 6.96; 25 °C; 1000 rpm stirring.

Conclusions

In this paper, we show the possibility to follow the kinetics of fast adsorption processes occurring in suspensions on-line, with high time resolution by using conventional UV-Vis spectrophotometry. The kinetics of the adsorption of methylene blue (MB) on silica aerogel particles was investigated to demonstrate the basic concept of such studies. The aerogel was characterized by porosimetry, scanning electron microscopy, NMR cryoporometry and NMR diffusiometry. The pore size distribution was determined. In the kinetic experiments, the suspension of aerogel particles was stirred in a standard cuvette placed in a fiber-optic photometer, and MB was promptly injected into it. The depletion of the dissolved dye could be followed conveniently with a 1 s time resolution by on-line photometry using a fast CCD detector. Biphasic kinetics was observed, the two phases of the overall process were complete in about 80 s and 600 s. The time resolution of the applied method made possible to collect sufficient amount of experimental data for a sophisticated kinetic analysis. An appropriate kinetic model was postulated and the corresponding rate constants were determined. It was confirmed that the fast adsorption process follows Langmuir-type kinetics. On the longer timescale, the aggregation of the aerogel particles covered by MB take place. The mechanistic conclusions obtained from the kinetic studies are consistent with the characteristic features of the aerogel reported in this study.

Acknowledgements

We are grateful to Lajos Daróczy (University of Debrecen) for the electron microscopy measurements, Andrea Nagy (University of Debrecen) for the microscopy measurements, Attila Kiss and Anita Kónya-Ábrahám (University of Debrecen) for the IR measurements and Attila Sztrik (University of Debrecen) for the laser diffraction measurements. The authors thank the Hungarian Science Foundation (OTKA: NK-105156) and the University of Debrecen (RH/751/2015) for financial support.

References

  1. B. C. Dunn, P. Cole, D. Covington, M. C. Webster, R. J. Pugmire, R. D. Ernst, E. M. Eyring, N. Shah and G. P. Huffman, Appl. Catal., A, 2005, 278, 233–238 CrossRef CAS.
  2. J. L. Gurav, I. K. Jung, H. H. Park, E. S. Kang and D. Y. Nadargi, Silica aerogel: synthesis and applications, J. Nanomater., 2010, 2010, 409310 Search PubMed.
  3. O. Orcaire, P. Buisson and A. C. Pierre, J. Mol. Catal. B: Enzym., 2006, 42, 106–113 CrossRef CAS.
  4. J. M. Rosenholm and M. Linden, J. Controlled Release, 2008, 128, 157–164 CrossRef CAS PubMed.
  5. C. T. Wang and C. L. Wu, Thin Solid Films, 2006, 496, 658–664 CrossRef CAS.
  6. A. S. Dorcheh and M. H. Abbasi, J. Mater. Process. Technol., 2008, 199, 10–26 CrossRef.
  7. I. Lázár, J. Kalmár, A. Peter, A. Szilágyi, E. Győri, T. Ditrói and I. Fábián, Appl. Surf. Sci., 2015, 356, 521–531 CrossRef.
  8. H. J. Liu, W. Sha, A. T. Cooper and M. H. Fan, Colloids Surf., A, 2009, 347, 38–44 CrossRef CAS.
  9. Y. Zhang, B. Cangul, Y. Garrabos and C. Erkey, J. Supercrit. Fluids, 2008, 44, 71–77 CrossRef CAS.
  10. L. Abramian and H. El-Rassy, Chem. Eng. J., 2009, 150, 403–410 CrossRef CAS.
  11. N. Saad, M. Al-Mawla, E. Moubarak, M. Al-Ghoul and H. El-Rassy, RSC Adv., 2015, 5, 6111–6122 RSC.
  12. N. K. Hamadi, X. D. Chen, M. M. Farid and M. G. Q. Lu, Chem. Eng. J., 2001, 84, 95–105 CrossRef CAS.
  13. I. K. Konstantinou and T. A. Albanis, Appl. Catal., B, 2004, 49, 1–14 CrossRef CAS.
  14. P. S. Kumar, S. Ramalingam, C. Senthamarai, M. Niranjanaa, P. Vijayalakshmi and S. Sivanesan, Desalination, 2010, 261, 52–60 CrossRef.
  15. M. Rafatullah, O. Sulaiman, R. Hashim and A. Ahmad, J. Hazard. Mater., 2010, 177, 70–80 CrossRef CAS PubMed.
  16. C. H. Wu and J. M. Chern, Ind. Eng. Chem. Res., 2006, 45, 6450–6457 CrossRef CAS.
  17. J. T. Hu, D. L. Yang, Q. Kang and D. Z. Shen, Sens. Actuators, B, 2003, 96, 390–398 CrossRef CAS.
  18. C. Tamerler, E. E. Oren, M. Duman, E. Venkatasubramanian and M. Sarikaya, Langmuir, 2006, 22, 7712–7718 CrossRef CAS PubMed.
  19. F. Lacour, R. Torresi, C. Gabrielli and A. Caprani, J. Electrochem. Soc., 1992, 139, 1619–1622 CrossRef CAS.
  20. A. L. Mifflin, K. A. Gerth and F. M. Geiger, J. Phys. Chem. A, 2003, 107, 9620–9627 CrossRef CAS.
  21. H. Liu, J. Y. Zhu and X. S. Chai, Langmuir, 2011, 27, 272–278 CrossRef CAS.
  22. Q. Q. Wang, J. Y. Zhu, C. G. Hunt and H. Y. Zhan, Biotechnol. Bioeng., 2012, 109, 1965–1975 CrossRef CAS PubMed.
  23. M. Pudukudy, Z. Yaakob, R. Rajendran and T. Kandaramath, React. Kinet., Mech. Catal., 2014, 112, 527–542 CrossRef CAS.
  24. Y. M. H. Zhou, W. J. H. Hu, J. G. Yu and F. P. Jiao, React. Kinet., Mech. Catal., 2015, 115, 581–596 CrossRef CAS.
  25. S. Azizian and H. Bashiri, Langmuir, 2008, 24, 11669–11676 CrossRef CAS PubMed.
  26. Y. Liu and L. Shen, Langmuir, 2008, 24, 11625–11630 CrossRef CAS PubMed.
  27. W. Rudzinski and T. Panczyk, Adsorption, 2002, 8, 23–34 CrossRef CAS.
  28. M. Wahlgren, T. Arnebrant and I. Lundstrom, J. Colloid Interface Sci., 1995, 175, 506–514 CrossRef CAS.
  29. M. Wahlgren and U. Elofsson, J. Colloid Interface Sci., 1997, 188, 121–129 CrossRef CAS.
  30. A. K. Covington, R. G. Bates and R. A. Durst, Pure Appl. Chem., 1985, 57, 531–542 Search PubMed.
  31. G. J. Soler-Illia, C. Sanchez, B. Lebeau and J. Patarin, Chem. Rev., 2002, 102, 4093–4138 CrossRef PubMed.
  32. S. Smitha, P. Shajesh, P. R. Aravind, S. R. Kumar, P. K. Pillai and K. G. K. Warrier, Microporous Mesoporous Mater., 2006, 91, 286–292 CrossRef CAS.
  33. I. Lazar, H. F. Bereczki, S. Mano, L. Daroczi, G. Deak, I. Fabian and Z. Csernatony, Polym. Compos., 2015, 36, 348–358 CrossRef CAS.
  34. Y. Cohen, L. Avram and L. Frish, Angew. Chem., Int. Ed., 2005, 44, 520–554 Search PubMed.
  35. J. Mitchell, J. B. W. Webber and J. H. Strange, Phys. Rep., 2008, 461, 1–36 CrossRef CAS.
  36. O. V. Petrov and I. Furó, Prog. Nucl. Magn. Reson. Spectrosc., 2009, 54, 97–122 CrossRef CAS.
  37. J. H. Strange, M. Rahman and E. G. Smith, Phys. Rev. Lett., 1993, 71, 3589–3591 CrossRef CAS PubMed.
  38. C. Ammann, P. Meier and A. E. Merbach, J. Magn. Reson., 1982, 46, 319–321 CAS.
  39. J. Kalmár, G. Lente and I. Fábián, Dyes Pigm., 2015 Search PubMed , unpublished work.
  40. T. Ditrói, J. Kalmár, G. Lente and I. Fábián, Photochem. Photobiol. Sci., 2015 Search PubMed , unpublished work.
  41. G. Peintler, ZiTa: A comprehensive program package for fitting parameters of chemical reaction mechanisms, Version 4.1, Institute of Chemistry JATE, Szeged, Hungary, 1997, The first use of this program was described in ref. 39.
  42. G. Peintler, I. Nagypal and I. R. Epstein, J. Phys. Chem., 1990, 94, 2954–2958 CrossRef CAS.
  43. A. C. Hindmarsh, GEAR: Ordinary Differential Equation SolVer, ReV. 2, Lawrence Livermore Laboratory, 1972 Search PubMed.
  44. E. Astorino, J. B. Peri, R. J. Willey and G. Busca, J. Catal., 1995, 157, 482–500 CrossRef CAS.
  45. I. Banyai, M. Keri, Z. Nagy, M. Berka and L. P. Balogh, Soft Matter, 2013, 9, 1645–1655 RSC.
  46. S. R. Veith, E. Hughes, G. Vuataz and S. E. Pratsinis, J. Colloid Interface Sci., 2004, 274, 216–228 CrossRef CAS PubMed.
  47. M. Keri, C. Peng, X. Shi and I. Banyai, J. Phys. Chem. B, 2015, 119, 3312–3319 CrossRef CAS PubMed.
  48. C. H. Cho, Y. S. Hong, K. Kang, V. I. Volkov, V. Skirda, C. Y. Lee and C. H. Lee, Magn. Reson. Imaging, 2003, 21, 1009–1017 CrossRef CAS PubMed.
  49. K. Razi Naqvi, Biomed. Opt. Express, 2014, 5, 1290–1295 CrossRef CAS PubMed.
  50. S. Azizian, J. Colloid Interface Sci., 2006, 302, 76–81 CrossRef CAS PubMed.

Footnote

Electronic supplementary information (ESI) available: Porometry, IR and NMR data. Micrographs. Detailed kinetic information in the form of additional figures. See DOI: 10.1039/c5ra21353c

This journal is © The Royal Society of Chemistry 2015
Click here to see how this site uses Cookies. View our privacy policy here.