
n-Butyraldehyde self-condensation catalyzed by Ce-modified γ-Al2O3†
Chao Xiong,
Ning Liang,
Hualiang An,
Xinqiang Zhao* and
Yanji Wang
School of Chemical Engineering and Technology, Hebei University of Technology, GuangRong Dao 8, Hongqiao District, Tianjin 300130, P. R. China. E-mail: zhaoxq@hebut.edu.cn
First published on 27th November 2015
Abstract
Self-condensation of n-butyraldehyde is an important process for the industrial production of 2-ethylhexanol. The catalytic performance of some solid acids such as γ-Al2O3 and molecular sieves for the self-condensation of n-butyraldehyde was investigated and the results showed that γ-Al2O3 was the best one. Then the effect of preparation conditions on the catalytic performance of γ-Al2O3 and the effect of reaction conditions on the self-condensation of n-butyraldehyde were discussed. In order to improve the catalytic performance, γ-Al2O3 was modified by different substances and Ce–Al2O3 was found to show the best catalytic performance; the conversion of n-butyraldehyde and the yield of 2-ethyl-2-hexenal could reach 93.8% and 88.6%, respectively. Moreover, the Ce–Al2O3 catalyst had excellent reusability. The XPS analysis of Ce3d demonstrated that the valence state of cerium affected the catalytic performance of Ce–Al2O3 to some extent but not predominantly. Instead the acid–base property of Ce–Al2O3 played a dominant role in the catalytic performance. The reaction components formed over the Ce–Al2O3 catalyst were identified by GC-MS and then some side-reactions were speculated and a reaction network for n-butyraldehyde self-condensation catalyzed by Ce–Al2O3 was proposed. Subsequently, the research on the intrinsic kinetics of n-butyraldehyde self-condensation catalyzed by Ce–Al2O3 showed that both the forward and backward reactions are second order and the corresponding activation energy is separately 79.60 kJ mol−1 and 74.30 kJ mol−1, which is higher than that of the reaction catalyzed by an aqueous base or acid.
1. Introduction
As an important chemical, 2-ethylhexanol is mainly used for the production of diethylhexyl phthalate (generally known as dioctyl phthalate, DOP) which serves as a plasticizer for PVC. In addition, 2-ethylhexanol is also used to produce adhesives, surfactants, antioxidants, cosmetics as well as additives for diesel and lubricating oil.1 The industrial manufacture of 2-ethylhexanol mainly relies on carbonyl synthesis technology and aldehyde condensation technology. Whichever technology is adopted, self-condensation of n-butyraldehyde is an essential step. At present, an aqueous caustic alkali catalyst is used for the self-condensation of n-butyraldehyde in industry and some drawbacks exist inherently. When the liquid alkali concentration is lower, the condensation reaction proceeds insufficiently and the conversion of n-butyraldehyde is lower. When the liquid alkali concentration is much higher, the condensation reaction will take place drastically and the formation of byproducts may lead to a low selectivity of 2-ethyl-2-hexenal. Besides, liquid alkali can corrode reaction apparatus and a lot of liquid acid will be required for handling the spent liquid alkali catalyst. In order to solve the problems resulted from the liquid alkali catalyst, solid base catalysts have drawn much attention for their high activity and ease of separation. The reported solid base catalysts used for the self-condensation of n-butyraldehyde include inorganic2–4 and organic5,6 solid bases. However, the solid base catalysts show poor hydrothermal stability and reusability in spite of their high activity, hindering their industrial applications.The self-condensation of n-butyraldehyde is a typical aldol condensation reaction. Aldol condensation reaction can be catalyzed by a basic or an acidic catalyst from the viewpoint of reaction mechanism. The literatures about the self-condensation of n-butyraldehyde catalyzed by a solid acid are very few,7–9 but there are a lot of reports about solid acid-catalyzed other aldol condensation reactions.10–13 Swift et al.7 prepared some kinds of supported SnO2 catalysts to catalyze the self-condensation of n-butyraldehyde and found that acid–base property of a support had a great effect on the catalytic activity: the activity of SnO2 supported on an acidic or a basic support was very low while that of neutral silica-supported SnO2 was much higher. Under the suitable reaction conditions, the conversion of n-butyraldehyde and the selectivity of 2-ethyl-2-hexenal could separately reach 75% and 98% over SnO2/SiO2 catalyst. Musko et al.8 studied the catalytic performance of H4SiW12O40/MCM-41 in the self-condensation of n-butyraldehyde in supercritical carbon dioxide and obtained a 27% of n-butyraldehyde conversion and 100% of 2-ethyl-2-hexenal selectivity under the suitable conditions. Compared with the work of Musko et al.,8 Chen et al.9 in our group selected H4SiW12O40/SiO2 to catalyze the self-condensation of n-butyraldehyde and obtained a better result. Under the suitable conditions, the conversion of n-butyraldehyde and selectivity of 2-ethyl-2-hexenal could attain 90.4% and 89.2%, respectively. However, the reusability of H4SiW12O40/SiO2 was poor due to the loss of silicotungstic acid. Kikhtyanin et al.10 evaluated the catalytic performance of a series of molecular sieve catalysts for the aldol condensation of furfural with acetone and found that HBEA(25) showed the best catalytic performance. Under the suitable conditions, the conversion of furfural and the yield of 4-(2-furyl)-3-buten-2-on could reach 50% and 36%, respectively. Lahyani et al.11 selected acidic resins Amberlyst-15 and Amberlite-200C to catalyze the cross aldol condensation of benzaldehyde with acetophenone. The conversion of benzaldehyde and the yield of chalcone could separately reach 100% and 98% at a reaction temperature = 100 °C and a reaction time = 1 h. However, the yield of chalcone dropped to 72.4% over Amberlyst-15 catalyst and to 77.5% over Amberlyst-200C catalyst after reused for four times. It was evident that the reusability of the two acidic resins was poor. Li et al.12 prepared Zr–Fe–Cs/SBA-15 by a wetness impregnation to catalyze the aldol condensation of formaldehyde with methyl propionate on a fixed bed reactor and got a 26% of formaldehyde conversion and a 96% of methyl methacrylate selectivity under the suitable conditions. Rekoske et al.13 utilized anatase TiO2 to catalyze the self-condensation of acetaldehyde and obtained a 26% of conversion and a 96% of crotonaldehyde selectivity at a reaction pressure = 0.202 MPa, a reaction temperature = 150 °C and a contact time = 1 min. However, the TiO2 catalyst exhibited a rapid deactivation within the first 10 min. In conclusion, HBEA(25), anatase TiO2 and Zr–Fe–Cs/SBA-15 showed poor catalytic activity while Amberlyst-15 and Amberlite-200C exhibited a poor reusability. So a catalyst with both high activity and good reusability is expected for aldol condensation reaction.
In this work, we prepared a Ce-modified γ-Al2O3 catalyst which showed good catalytic activity and excellent reusability for the self-condensation of n-butyraldehyde. Based on the analysis of the reaction system, a reaction network was proposed and the intrinsic kinetics equation was established.
2. Experimental section
2.1. Preparation of catalysts
γ-Al2O3 catalyst was prepared by calcinating pseudo-boehmite on a muffle furnace under air atmosphere. The temperature was controlled as follows: increased from room temperature to 500 °C at a heating-rate of 10 °C min−1 and then kept for 4 h.Modified γ-Al2O3 catalysts were prepared by an incipient impregnation of γ-Al2O3 with an aqueous solution of modifier precursor including potassium nitrate, magnesium nitrate, barium nitrate, zinc nitrate, ammonium fluoride, cerium nitrate and boracic acid. The loading of the modifier (in a state of oxide except for fluorine) is 5% (wt). Taking Ce–Al2O3 as an example, the preparation procedure is described as follows. 8 g γ-Al2O3 was impregnated with 9.6 mL of 0.24 M aqueous solution of Ce(NO3)3 first and then aged at room temperature for 24 h, dried at 110 °C for 8 h and calcinated at 550 °C for 4 h. The preparation of γ-Al2O3 modified by other substances was similar to Ce–Al2O3.
2.2. Materials characterization
The textural properties of the catalysts were measured using an ASAP 2020 specific surface area and porosity analyzer made in Micromeritics Company in America. Prior to the test, 0.2 g of the sample was degassed at 150 °C for 4 h in vacuum to remove the impurities adsorbed on the sample surface. Then N2 adsorption–desorption test was performed at −195.8 °C. The specific surface area was calculated by the Brunauer–Emmett–Teller (BET) method while the pore volume and pore diameter were calculated by the Barrett–Joyner–Halenda (BJH) method.The basicity and acidity of a catalyst were measured by a temperature programmed desorption using CO2 or NH3 as a probe molecule (CO2-TPD, NH3-TPD) performed on an AutoChem II 2920 chemical adsorption instrument made in Micromeritics Company in America. Taking the test of CO2-TPD as example, a typical procedure is described as follows. 0.1 g of the sample was placed in a quartz sample tube under nitrogen atmosphere with a flow of 25 mL min−1 and then the temperature was increased as follows in order to remove the impurities adsorbed on the sample surface: increased from room temperature to 500 °C at a heating-rate of 10 °C min−1 and then kept for 1 h. Next the temperature was decreased to 110 °C. Subsequently the sample was saturated with CO2 with a flow of 25 mL min−1 for 30 min. Then the sample was purged by helium with a flow of 50 mL min−1 for about 1 h to remove the CO2 absorbed physically. After that, the temperature was increased to 700 °C at a heating-rate of 10 °C min−1. The test of NH3-TPD is similar to CO2-TPD.
The X-ray diffraction (XRD) analysis was performed on a Rigaku D/max-2500 X-ray diffractometer using Cu Kα radiation and a graphite monochromator at 40 kV and 100 mA. The scan range covered from 10° to 90° at a rate of 4° min−1.
X-ray photoelectron spectroscopy (XPS) spectra were recorded with a Physical Electronics Kratos Axis Ultra DLD using monochromatic Al Kα X-rays (1486.6 eV) operated at 150 W and 15 kV. All the spectra with a scan range of 0–1200 eV were obtained with a pass energy of 80 eV and step increment of 1 eV while the narrow-spectra were obtained with a pass energy of 40 eV and 100 mV. The binding energy of C1s (284.6 eV) was used as calibration standard. The obtained XPS peaks were fitted with Peak 4.1 software.
2.3. n-Butyraldehyde self-condensation reaction
The self-condensation of n-butyraldehyde was conducted in a 100 mL stainless steel autoclave. A typical procedure is described as follows: 40 mL (about 30 g) n-butyraldehyde and 4.5 g catalyst were added into the autoclave and then the air inside was replaced with nitrogen. The reaction was conducted at 180 °C for 8 h with a stirring agitation of 400 rpm. After the completion of reaction, the mixture was cooled to room temperature. The catalyst was separated by vacuum filter and the liquid was quantitatively analyzed by a gas chromatograph.2.4. Product analysis
A qualitative analysis of the reaction products was conducted on a GC-MS (Thermo Finnigan TRACE DSQ). EI ionization source was used in the mass spectrometry with anion source temperature of 200 °C. The mass spectrum was recorded in the range of 40–500 amu. The temperature of both the vaporizing chamber and the transmission line was controlled at 250 °C. A BPX5 capillary column was used for separation of the components and the column temperature was controlled according to the following program: an initial temperature of 40 °C and then heated to 250 °C in a ramp of 10 °C min−1 and held for 5 min.A quantitative analysis of the reaction products was carried out using a SP-2100 gas chromatograph (Beijing Beifen-Ruili Analytical Instrument (Group) Co., Ltd). The product mixture was separated in a KB-1 capillary column whose temperature was controlled according to the following program: an initial temperature of 80 °C and held for 3 min, heated to 160 °C in a ramp of 10 °C min−1 and held for 10 min. Nitrogen was used as a carrier gas and its flow rate was 30 mL min−1. The components were analyzed in a flame ionization detector (FID).
3. Results and discussion
3.1. Screening of catalysts
The catalytic performance of some solid acids such as γ-Al2O3, Hβ, HY and HZSM-5 with different molar ratios of Si/Al for the self-condensation of n-butyraldehyde was separately investigated and the results are listed in Table 1. It can be seen that the conversion of n-butyraldehyde decreased in the following order: γ-Al2O3 > Hβ > HZSM-5(360) > HZSM-5(150) > HZSM-5(38) > HY > HZSM-5(25) > none, and the selectivity of 2-ethyl-2-hexenal lessened as follows: γ-Al2O3 > Hβ > HY > HZSM-5(360) > HZSM-5(150) > none > HZSM-5(38) > HZSM-5(25). It is obvious that γ-Al2O3 showed the best catalytic performance; the conversion of n-butyraldehyde and the selectivity of 2-ethyl-2-hexenal reached 83.5% and 84.9%, respectively. Among the three kinds of molecular sieves, HZSM-5 showed the worst catalytic activity. With the increase of the molar ratio of Si/Al, the catalytic activity of HZSM-5 increased gradually, suggesting that strong acidity is unfavorable to the self-condensation of n-butyraldehyde. Shen et al.3 studied the vapor phase self-condensation of n-butyraldehyde and found that an ideal catalyst should be neither a strong acid nor a strong base. Furthermore, the catalytic performance of Hβ was higher than HY, in accordance with the result of Komatsu et al.14 A lower activity of HY may be due to its micropore which hindered the diffusion of the reaction substances.| Catalyst | XBA/% | Y2E2H/% | S2E2H/% |
|---|---|---|---|
| a Reaction conditions: a weight percentage of catalyst = 10%, T = 180 °C, t = 6 h. BA: n-butyraldehyde; 2E2H: 2-ethyl-2-hexenal; X: conversion; Y: yield; S: selectivity. | |||
| None | 41.3 | 12.6 | 30.5 |
| γ-Al2O3 | 83.5 | 70.8 | 84.9 |
| Hβ | 77.3 | 51.6 | 66.8 |
| HY | 52.9 | 29.2 | 55.3 |
| HZSM-5(360) | 62.6 | 28.1 | 45.0 |
| HZSM-5(150) | 57.8 | 21.9 | 37.8 |
| HZSM-5(38) | 53.3 | 14.9 | 28.0 |
| HZSM-5(25) | 49.3 | 9.6 | 19.6 |
The acidity of γ-Al2O3, Hβ, HY and HZSM-5(25) was separately measured and the profiles of NH3-TPD and the measurement data are separately shown in Fig. S1† and Table 2. It can be seen that the acid amount of the four solid acids decreased in the following order: HY > HZSM-5 > Hβ > γ-Al2O3 while the acid strength declined as follows: HZSM-5 > HY > Hβ > γ-Al2O3. The sequence of the acid amount and the acid strength of the three molecular sieves was in consistence with the result determined by Castano et al.15 Combined with the catalytic performance, it was inferred that the stronger the acidity, the lower the yield of 2-ethyl-2-hexenal. A stronger acidity will give rise to the trimerization of n-butyraldehyde, reducing the selectivity of 2-ethyl-2-hexenal. A weaker acidity of γ-Al2O3 is responsible for its better catalytic performance. Besides, with the increase of the molar ratio of Si/Al, the acid strength of HZSM-5 decreased, and the selectivity and the yield of 2-ethyl-2-hexenal increased because of restraining the occurrence of side-reactions. Therefore, the weak acid sites could contribute to the self-condensation of n-butyraldehyde. Ungureanu et al.16 obtained a similar conclusion using UL-ZSM-5 to catalyze the aldol condensation of formaldehyde with acetaldehyde. Thereby, γ-Al2O3 was chosen as the catalyst to do a further research in this work.
| Catalyst | NH3 desorption peak at lower temperature | NH3 desorption peak at higher temperature | Total acid amount/μmol g−1 | ||
|---|---|---|---|---|---|
| Peak top temperature/°C | Weak acid amount/μmol g−1 | Peak top temperature/°C | Strong acid amount/μmol g−1 | ||
| γ-Al2O3 | 176.1 | 386.6 | — | — | 386.6 |
| Hβ | 179.2 | 359.4 | 273.4 | 348.1 | 707.8 |
| HY | 192.0 | 838.8 | 334.1 | 1226.5 | 2065.3 |
| HZSM-5(25) | 195.5 | 680.7 | 398.2 | 757.6 | 1438.3 |
3.2. Preparation and catalytic performance of γ-Al2O3
γ-Al2O3 catalyst was prepared by calcinating pseudo-boehmite as described in Experimental section. The effect of calcination temperature and calcination time on the textural structure and catalytic performance γ-Al2O3 was investigated and the details are enclosed in the ESI.† As a result, the suitable preparation conditions of γ-Al2O3 were as follows: pseudo-boehmite was calcinated at 500 °C for 4 h. The catalytic performance of γ-Al2O3 prepared at above conditions was evaluated at different reaction conditions. The effect of reaction parameters on the catalytic performance is enclosed in the ESI.† The results showed that γ-Al2O3 dosage, reaction temperature, and reaction time exerted different influence on the catalytic performance of γ-Al2O3. The suitable reaction conditions for n-butyraldehyde self-condensation over γ-Al2O3 catalyst were obtained as follows: a weight percentage of γ-Al2O3 catalyst = 15%, a reaction temperature = 180 °C, and a reaction time = 8 h. The yield of 2-ethyl-2-hexenal was 76.6% at a n-butyraldehyde conversion of 87% under the above reaction conditions.3.3. Modification of γ-Al2O3
As mentioned above, the yield of 2-ethyl-2-hexenal was merely 76.6% under the suitable reaction conditions, lower than the data obtained from the industrial aqueous caustic alkali, indicating that the catalytic performance of γ-Al2O3 was not satisfactory. Thereby, a modification of γ-Al2O3 is needed in order to improve its catalytic performance.The catalytic performances of γ-Al2O3 modified by different substances are listed in Table 3. The loading of the modifier (based on oxide except for F) accounted for 5% (wt) of γ-Al2O3. It was obvious that modifier had an important influence on the catalytic performance of γ-Al2O3. The catalytic performance of γ-Al2O3 modified by nonmetal B and F was the worst; the selectivity of 2-ethyl-2-hexenal decreased. Especially for B–Al2O3, the selectivity and yield of 2-ethyl-2-hexenal were merely 82.5% and 67.1%. In contrast, the γ-Al2O3 modified by metallic oxide showed good catalytic performance. The selectivity of 2-ethyl-2-hexenal reached the highest, 90.0%, over Mg–Al2O3 catalyst. Moreover, Ce–Al2O3 exhibited the best catalytic performance and the yield of 2-ethyl-2-hexenal was the highest, up to 83.1%. So Ce was determined to be the suitable modifier.
| Catalyst | XBA/% | Y2E2H/% | S2E2H/% |
|---|---|---|---|
| a Reaction conditions: a weight percentage of catalyst = 15%, T = 180 °C, t = 8 h. BA: n-butyraldehyde; 2E2H: 2-ethyl-2-hexenal; X: conversion; Y: yield; S: selectivity. | |||
| γ-Al2O3 | 87.5 | 76.6 | 87.5 |
| B–Al2O3 | 81.3 | 67.1 | 82.5 |
| F–Al2O3 | 88.0 | 73.9 | 83.9 |
| Zn–Al2O3 | 86.3 | 75.6 | 87.6 |
| Ba–Al2O3 | 84.9 | 74.4 | 87.5 |
| Mg–Al2O3 | 86.7 | 78.1 | 90.0 |
| K–Al2O3 | 87.6 | 78.7 | 89.8 |
| Ce–Al2O3 | 93.8 | 83.1 | 88.6 |
Acid and base properties of the modified γ-Al2O3 catalysts were measured and the profiles of NH3-TPD and CO2-TPD are separately shown in Fig. S6–S11† while the measurement data are summarized in Table 4. After modified by nonmetal B and F, the total base amount of γ-Al2O3 dropped distinctly and the base strength also decreased and the weak base sites of γ-Al2O3 disappeared. The total acid amount rose for the γ-Al2O3 modified by B but decreased for the γ-Al2O3 modified by F. Furthermore, a new strong acid site appeared and the acid strength was enhanced after modified by F. Jian et al.17 studied the role of F in the γ-Al2O3 catalyst and obtained a similar conclusion. They considered that the lone pair electrons of F was in coordination with the acid sites on the surface of γ-Al2O3 and the acid sites of γ-Al2O3 were covered partly, causing the reduction of the acid amount. Meanwhile, the higher electro-negativity of F had a great inductive effect and could make the strength of acid site nearby stronger. When modified by transition metal Zn, the total acid amount of γ-Al2O3 rose but the total base amount and base strength changed a little. Through the modification of alkaline earth metal Ba, the total acid amount of γ-Al2O3 dropped severely but the total base amount declined slightly. After modified by alkali metal K, alkaline earth Mg and rare-earth metal Ce, all the desorption peaks of CO2 at higher temperature disappeared but the total base amount increased drastically. In addition, the total acid amount of γ-Al2O3 modified by Mg and Ce increased to some extent but decreased when modified by K. Shen et al.3 found that the silica-supported MgO and SrO catalysts had a dramatically increased NH3 uptake because of the formation of extra acid sites. It was also observed in Table 4 that the influence of different substances on the base amount of γ-Al2O3 was much greater than that on its acid amount. The base amount declined in the following order: Mg–Al2O3 > K–Al2O3 > Ce–Al2O3 > Zn–Al2O3 > γ-Al2O3 > Ba–Al2O3 > F–Al2O3 ≈ B–Al2O3. Combined with the catalytic performance, we can see that the base amount played a major role in the improvement of the selectivity of 2-ethyl-2-hexenal. With respect to B–Al2O3 and F–Al2O3 with lower base amount, the selectivity of 2-ethyl-2-hexenal was higher over Mg–Al2O3, K–Al2O3 and Ce–Al2O3 catalysts with higher base amount. As a consequence, it was inferred that the base amount of the modified γ-Al2O3 is the key factor influencing the selectivity of 2-ethyl-2-hexenal; the bigger the base amount, the higher the selectivity of 2-ethyl-2-hexenal. Climent et al.18 compared the selectivity of MgO and NaCsX zeolite in the aldol condensation of heptanal with benzaldehyde and found that base strength certainly had an important influence on the selectivity. In this study, it is found that weak base amount played a crucial role in the selectivity. Not only does Ce–Al2O3 have relatively higher base amount, but also its 4f electronic structure is beneficial to the polarization of a carbonyl group,19 promoting the formation of enol structure which is good for the enhancement of the conversion of n-butyraldehyde. In addition, the excellent catalytic performance of Ce–Al2O3 is possibly attributed to its suitable and matched acid–base properties on the surface.
| Catalyst | Acid property | Base property | |||||
|---|---|---|---|---|---|---|---|
| NH3 desorption peak/°C | Total acid amount/μmol g−1 | CO2 desorption peak at lower temperature | CO2 desorption peak at higher temperature | Total base amount/μmol g−1 | |||
| Peak top temperature/°C | Weak base amount/μmol g−1 | Peak top temperature/°C | Strong base amount/μmol g−1 | ||||
| γ-Al2O3 | 176.1 | 386.6 | 163.3 | 29.1 | 378.0 | 179.1 | 178.2 |
| B–Al2O3 | 181.6 | 500.4 | — | — | 331.1 | 113.7 | 113.7 |
| F–Al2O3 | 181.0 | 306.6 | — | — | 317.7 | 116.1 | 116.1 |
| 468.9 | |||||||
| Zn–Al2O3 | 191.4 | 463.0 | 167.6 | 19.3 | 336.6 | 162.7 | 182.0 |
| Ba–Al2O3 | 186.8 | 254.8 | 172.3 | 18.7 | 281.9 | 142.8 | 161.5 |
| Mg–Al2O3 | 189.3 | 484.0 | 171.6 | 756.1 | — | — | 756.1 |
| K–Al2O3 | 187.0 | 100.8 | 167.3 | 641.3 | — | — | 641.3 |
| Ce–Al2O3 | 191.9 | 404.8 | 172.7 | 540.3 | — | — | 540.3 |
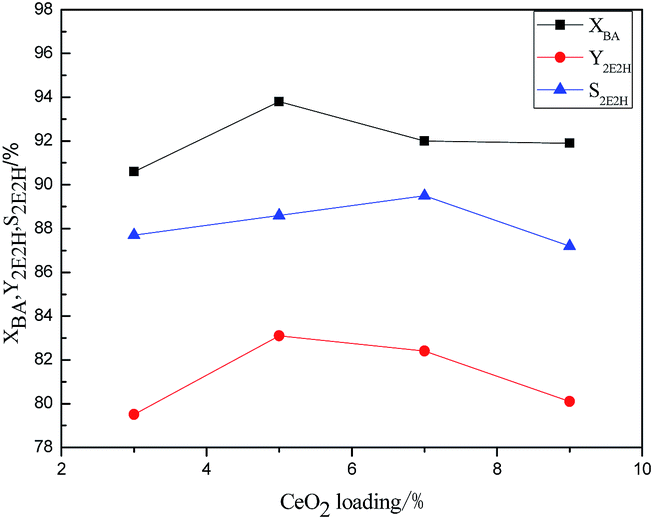 | ||
| Fig. 1 Effect of CeO2 loading on the catalytic performance of γ-Al2O3 catalyst. Reaction conditions: a weight percentage of catalyst = 15%, T = 180 °C, t = 8 h. X: conversion; Y: yield; S: selectivity; BA: n-butyraldehyde; 2E2H: 2-ethyl-2-hexenal. | ||
The peak areas (A) of Ce4+ and Ce3+ species are used to estimate their relative contents (C) in the Ce–Al2O3 using the following equations and the results in the fresh Ce–Al2O3, the recovered Ce–Al2O3 without calcination and the recovered Ce–Al2O3 after calcination are separately listed in Tables 5–7.
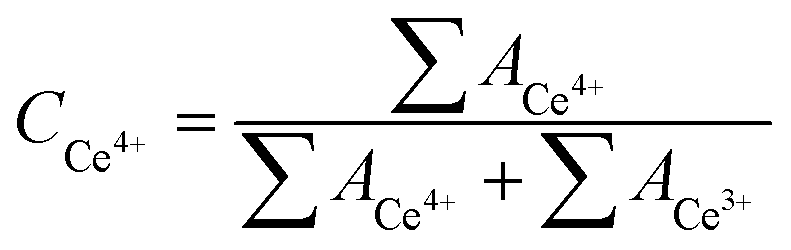
It is known from the calculation result that the percentage of Ce4+ species was 94% in the fresh Ce–Al2O3, and dropped to 10% in the recovered Ce–Al2O3 without calcination and increased back to 42% in the recovered Ce–Al2O3 after calcination. It can be seen from Table 8 that the conversion of n-butyraldehyde decreased to some extent while the selectivity of 2-ethyl-2-hexenal decreased greatly for the recovered Ce–Al2O3 without calcination as compared with the fresh Ce–Al2O3. Thus, it is certain that the Ce4+ species are the active sites in Ce–Al2O3. On the other hand, the percentage of Ce4+ species in the recovered Ce–Al2O3 after calcination is less than half of that in the fresh Ce–Al2O3 but the catalytic activity of the recovered Ce–Al2O3 after calcination is almost the same as the fresh one. Therefore, it is inferred that the valence state of Ce affects the catalytic performance of Ce–Al2O3 to some extent but it does not play a key role in the catalytic performance. As mentioned above, the acid and base property of γ-Al2O3 catalyst exerts a great effect on the catalytic performance and furthermore the base amount is the key factor influencing the selectivity of 2-ethyl-2-hexenal. Therefore, it is speculated that the acid and base property of Ce–Al2O3 play a dominant role in its catalytic performance.
| Catalyst | XBA/% | Y2E2H/% | S2E2H/% |
|---|---|---|---|
| a Reaction conditions: a weight percentage of catalyst = 15%, T = 180 °C, t = 8 h. BA: n-butyraldehyde; 2E2H: 2-ethyl-2-hexenal; X: conversion; Y: yield; S: selectivity. | |||
| Fresh Ce–Al2O3 | 93.7 | 80.3 | 85.7 |
| Recovered Ce–Al2O3 without calcination | 90.3 | 71.1 | 78.8 |
| Recovered Ce–Al2O3 after calcination | 93.3 | 83.0 | 88.9 |
| γ-Al2O3 | 86.6 | 72.9 | 84.2 |
Acid and base properties of the fresh and the recovered Ce–Al2O3 catalysts were measured and the profiles of CO2-TPD and NH3-TPD are separately shown in Fig. S15 and S16† while the measurement data are summarized in Table S2.† As compared with the fresh Ce–Al2O3, the total acid amount decreased to some extent and what is more, a new strong acid site appeared while the total base amount increased greatly but the base strength increased a little in the recovered Ce–Al2O3 without calcination. After calcinated at 550 °C for 4 h, both the base amount and strength decreased and furthermore the base strength restored to that of the fresh Ce–Al2O3. The new strong acid site disappeared and both the weak acid amount and strength increased and furthermore the weak acid strength restored to that of the fresh Ce–Al2O3. In a word, the acid and base properties of the recovered Ce–Al2O3 after calcination restored almost to those of the fresh Ce–Al2O3.
γ-Al2O3 can be hydrated with the byproduct water to form boehmite phase in the aldol condensation of n-butyraldehyde.32 Since the acid amount of γ-Al2O3 is more than boehmite,33 it is speculated that the increase of the base amount and the decrease of the acid amount in the recovered Ce–Al2O3 without calcination is related to the formation of boehmite. Boehmite can decompose to γ-Al2O3 after calcination,34 so the base amount decreased and acid amount increased in the recovered Ce–Al2O3 after calcination. Combined with the result of Tables S2† and 8, it is inferred that the strong acid site does harm to the self-condensation of n-butyraldehyde, causing the side-reactions to reduce the selectivity of 2-ethyl-2-hexenal. Zeidan et al.35 selected the acid–base bifunctionalized mesoporous SBA-15 to catalyze the aldol condensation of 4-nitrobenzaldehyde with acetone and found that the catalytic activity of bifunctionalized materials increased gradually with the decrease of the acidity.
It can be seen from Table 8 that the conversion of n-butyraldehyde changed little while the selectivity of 2-ethyl-2-hexenal decreased greatly over the recovered Ce–Al2O3 without calcination as compared with the fresh Ce–Al2O3. Despite the fact that the total base amount increased for the recovered Ce–Al2O3 without calcination, the appearance of the strong acid site reduced its catalytic activity, so its selectivity of 2-ethyl-2-hexenal decreased. After calcinated at 550 °C for 4 h, the total base site amount decreased and was slightly more than that of the fresh Ce–Al2O3 while the strong acid site disappeared, so the catalytic performance was restored for the recovered Ce–Al2O3 after calcination. In conclusion, matchable acid and base properties are the key factor to achieve a good catalytic performance of Ce–Al2O3.
| Run | XBA/% | Y2E2H/% | S2E2H/% |
|---|---|---|---|
| a Reaction conditions: a weight percentage of catalyst = 15%, T = 180 °C, t = 8 h. BA: n-butyraldehyde; 2E2H: 2-ethyl-2-hexenal; X: conversion; Y: yield; S: selectivity. | |||
| 1 | 93.8 | 83.1 | 88.6 |
| 2 | 93.3 | 83.0 | 88.9 |
| 3 | 92.4 | 82.5 | 89.2 |
| 4 | 91.3 | 82.5 | 90.4 |
| 5 | 91.0 | 82.5 | 90.7 |
3.4. Analysis of reaction system
The reaction liquid obtained from the self-condensation of n-butyraldehyde catalyzed by Ce–Al2O3 was analyzed by GC-MS and results listed in Table S3† show that several by-products were found such as butyl butyrate, 4-heptanone, 3-heptylene, 2-ethyl-3-hydroxyhexyl butyrate and so on. Based on the analysis results of GC-MS, some side-reactions (1)–(4) were speculated as Scheme 1.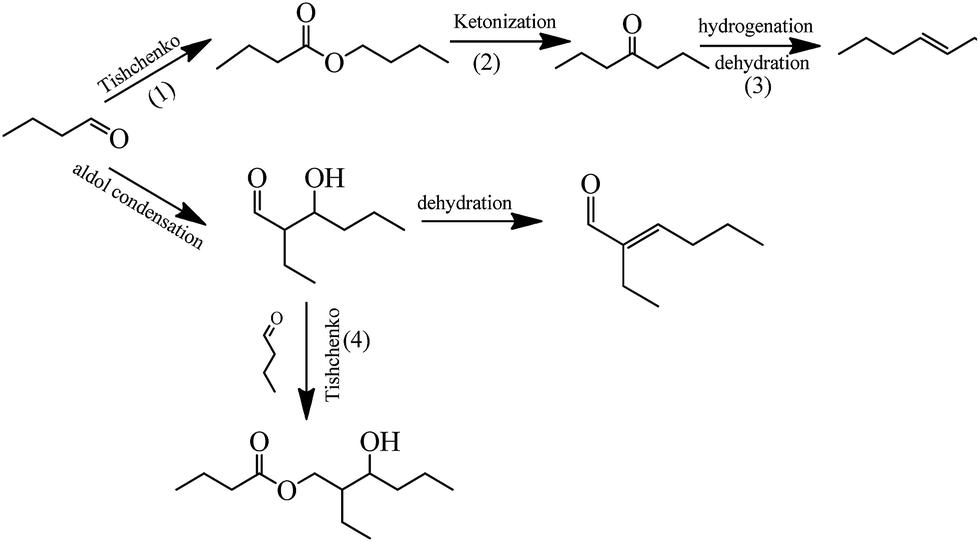 | ||
| Scheme 1 Reaction network of n-butyraldehyde self-condensation catalyzed by Ce–Al2O3. | ||
Tsuji et al.36 thought that Al2O3 can catalyze the Tishchenko reaction of n-butyraldehyde to produce butyl butyrate, so the reaction (1) was speculated. Shen et al.3 probed into the vapor phase self-condensation of n-butyraldehyde catalyzed by alkaline earth metal oxide and discovered that the reaction system contained C7 alkene byproduct. At present, there is a dispute on the formation of C7 alkene. Idriss et al.37 considered that C7 alkene came from the reductive coupling reaction of n-butyraldehyde. Luo et al.38 believed that the reductive coupling reaction was prone to occurrence on the surface of a reductant and there was a great possibility that C7 alkene was originated from these side-reactions such as dehydroxylation and decarbonylation. Shen et al.3 deemed that C7 alkene may be derived from the hydrogenation/dehydration of heptanone generated from the ketonization of butyl butyrate. Glinski et al.39 studied the ketonization of ethyl heptanoate catalyzed by Ce or Zr loaded Al2O3 and found the formation of 13 ketone, ethylene, carbon dioxide and water. On the basis of above discussion, the reaction (2) was inferred. Namely the ketonization of butyl butyrate generated carbon dioxide, water, 1-butene and heptanone followed by a hydrogenation/dehydration to produce C7 alkene. The hydrogen used for the hydrogenation was derived from the decomposition of n-butyraldehyde.37 The formation of 2-ethyl-2-hexenal comprises two reaction steps: the condensation of n-butyraldehyde to 2-ethyl-3-hydroxyhexanal and the dehydration of the intermediate to 2-ethyl-2-hexenal. Part of 2-ethyl-3-hydroxyhexanal could react with n-butyraldehyde to produce 2-ethyl-3-hydroxyhexyl butyrate by the Tishchenko reaction, described as reaction (4), in accordance with the result obtained by Zhu et al.40 and Tsuji et al.36 Zhu et al.40 used rare earth compound to catalyze aldol condensation-Tishchenko reaction of n-butyraldehyde and found that 2-ethyl-3-hydroxyhexyl butyrate was formed. Tsuji et al.36 concluded that Al2O3 could catalyze the Tishchenko reaction of n-butyraldehyde to produce 2-ethyl-3-hydroxyhexyl butyrate and furthermore n-butyraldehyde preferred to react with 2-ethyl-3-hydroxyhexanal by the cross-Tishchenko reaction, compared with the self-Tishchenko reaction of n-butyraldehyde.
Based on the results of product analysis and discussion above, a possible reaction network for self-condensation of n-butyraldehyde catalyzed by Ce–Al2O3 was proposed as shown in Scheme 1. A majority of n-butyraldehyde undertakes aldol condensation to 2-ethyl-3-hydroxyhexanal followed by a dehydration reaction to 2-ethyl-2-hexenal. Simultaneously, a minority of n-butyraldehyde will be converted to butyl butyrate by the Tishchenko reaction and then butyl butyrate can transform to heptanone from the ketonization followed by a hydrogenation/dehydration to C7 alkene. In addition, a small quantity of 2-ethyl-3-hydroxyhexanal can react with one molecule of n-butyraldehyde by the Tishchenko reaction to produce 2-ethyl-3-hydroxyhexyl butyrate.
3.5. Kinetic study
In order to get an intensive investigation of the n-butyraldehyde self-condensation reaction catalyzed by Ce–Al2O3, its intrinsic reaction kinetics was established. The influence of internal and external diffusion was eliminated prior to the kinetic experiments.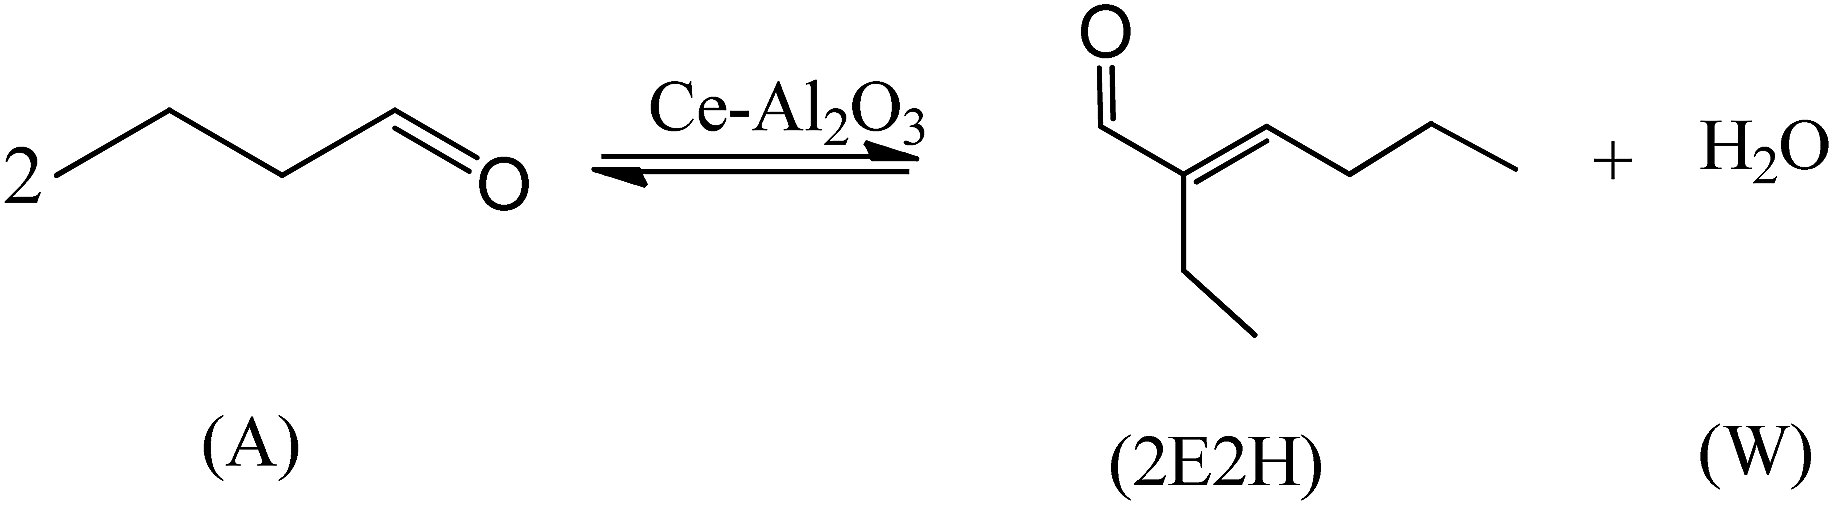
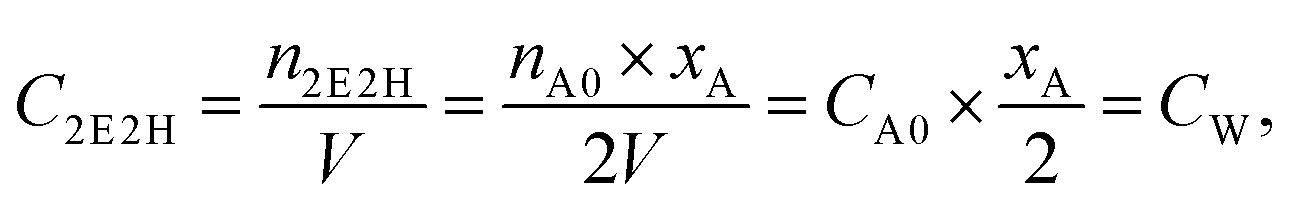
The rate of a chemical reaction (rA) is the function of the concentration of reaction components (CA, C2E2H, CW) and reaction temperature (T). CA, C2E2H and CW can be expressed by means of the conversion of n-butyraldehyde (xA). The reaction rate equation can be described as follows:
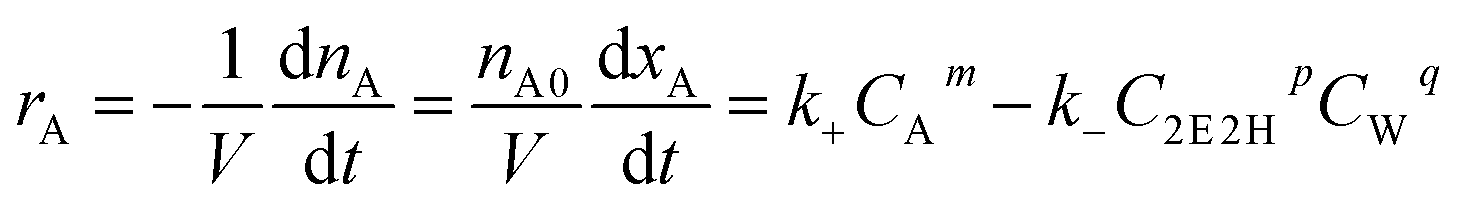 | (1) |
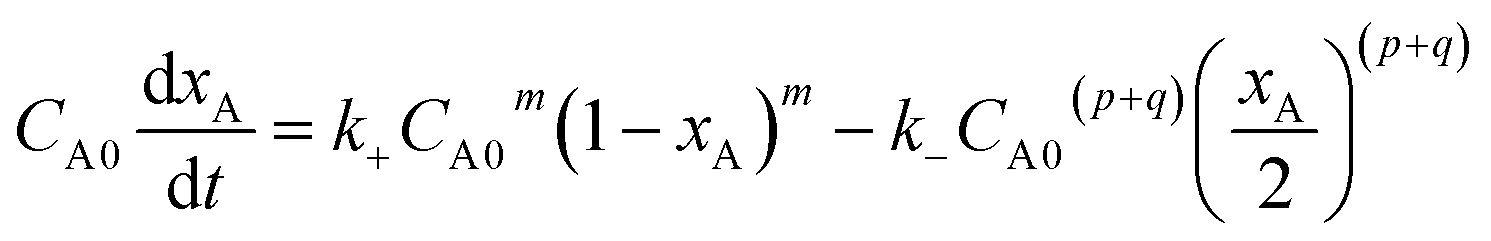
eqn (1) can be converted to eqn (2):
 | (2) |
Suppose p + q = n, eqn (2) can be changed as follows:
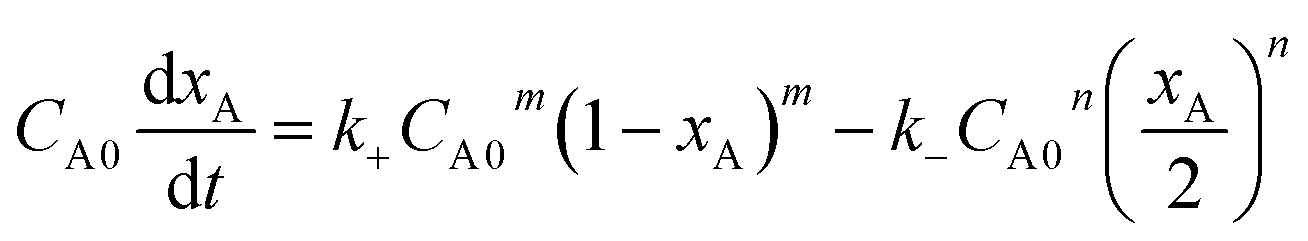 | (3) |
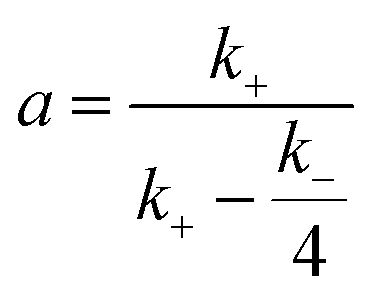
When the Arrhenius equation 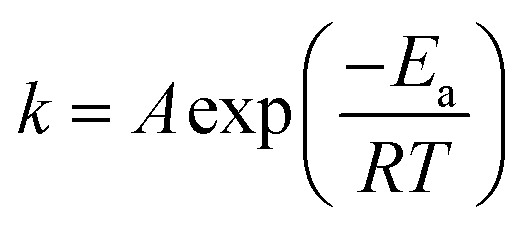 is put into eqn (3), the differential equation to be fitted can be shown as follows:
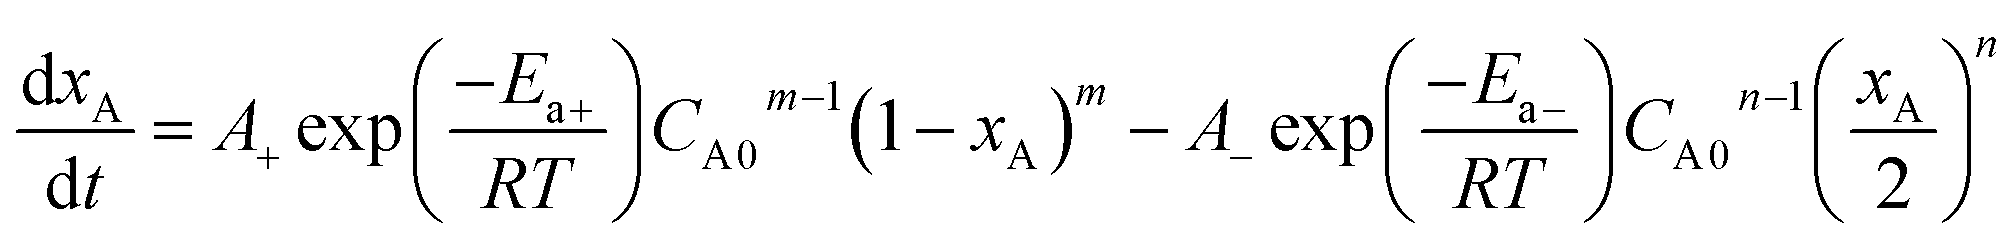 | (4) |
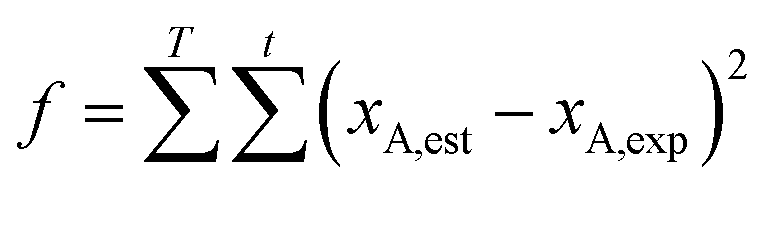
The kinetic equation is an initial-value problem of a first-order ordinary differential equation. When the initial values of the parameters A+, A−, Ea+, Ea−, m and n are given, the conversion of n-butyraldehyde at t = 3600 s can be obtained by integrating the set of the first-order ordinary differential equations using a fourth-order Runge–Kutta method in the time interval of [0, 3600]. Similarly, the conversion of n-butyraldehyde at t = i can be attained in the time interval of [0, i], which is the corresponding estimated values of the reaction kinetics model. The experimental data (the conversions of n-butyraldehyde) at t = i were obtained by GC analyses. Then the objective function for parameter estimation is expressed as follows:
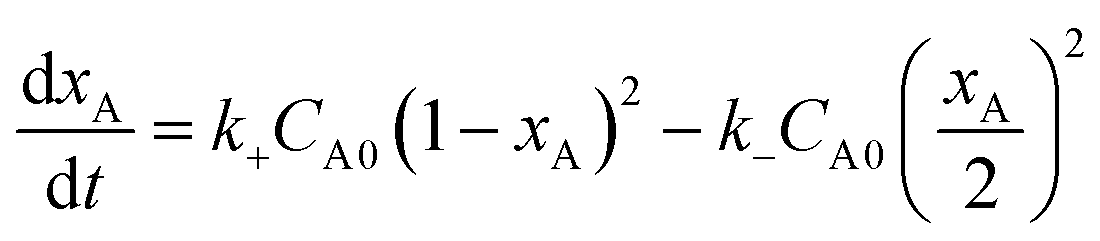
Zhang et al.41 studied the kinetic of n-butyraldehyde self-condensation catalyzed by a sulfonic acid functionalized ionic liquids and found that both the forward and backward reactions are second order. In this study, the forward and backward reactions are supposed to be second order first and then the assumption will be verified. As a result, the estimated kinetic parameters (activation energy and pre-exponential factor of the forward and reverse reactions) are listed as follows: A+ = 5.745 × 10⁵ m3 (kmol−1 s−1); Ea+ = 79.60 kJ mol−1; A− = 2.146 × 10⁴ m3 (kmol−1 s−1); Ea− = 74.30 kJ mol−1.
Then the above equation can be integrated to
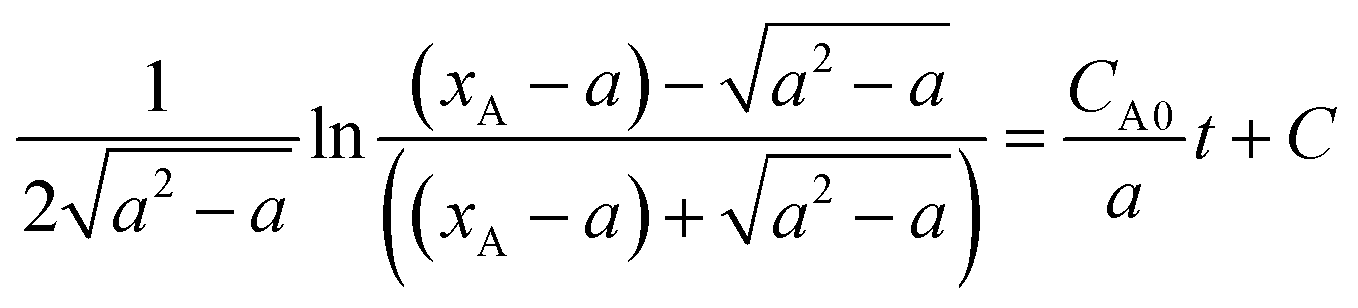
 , C is the integration constant.
Suppose 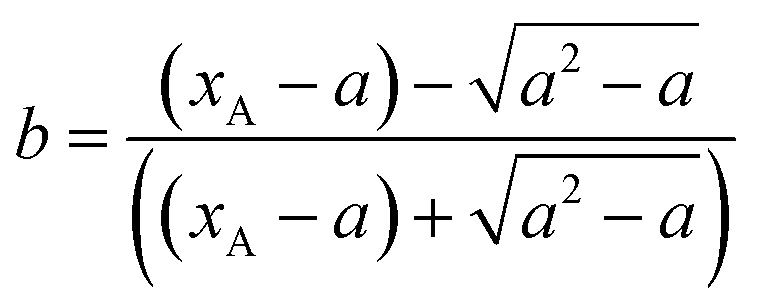 then
then 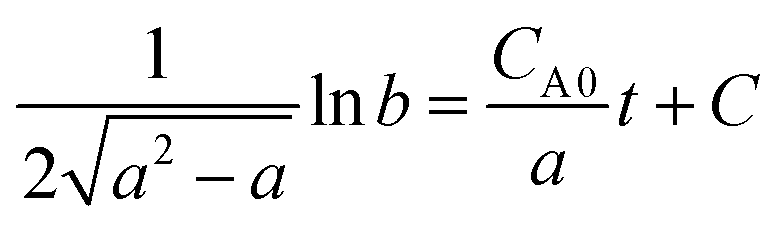
Substituting the conversion of n-butyraldehyde xA determined by GC to the above equation, it is found that the relation between ln![[thin space (1/6-em)]](https://www.rsc.org/images/entities/char_2009.gif) b and t is linear, indicating that the hypothesis for second-order reaction is correct.
b and t is linear, indicating that the hypothesis for second-order reaction is correct.
 | ||
| Fig. 2 Comparison between the experimental and the estimated conversion of n-butyraldehyde. X: conversion of n-butyraldehyde; est: estimated values, exp: experimental values. | ||
The results of variation analysis and the F-test on the kinetic model are listed in Table 10. As we know from the variation analysis theory, the larger the absolute value of the correlation index and test value of F, the better the regression effect. If the correlation index r is larger than 0.9 and F > 10Fα, the model is considered to be suitable to the α level. In this study,
| Experiment no. | Free variation no. | Regression squares sum | Residual squares sum | Correlation index | Variance | F0.05(3, 31) |
|---|---|---|---|---|---|---|
| 35 | 4 | 2.0591 | 0.0608 | 0.9856 | 2.0538 | 2.91 |
It can be seen that F is much bigger than F0.05(3, 31) and the correlation index r is larger than 0.9. Therefore, the kinetic model is significant to the level α = 0.05 and thus is able to describe the n-butyraldehyde self-condensation reaction process.
Compared with the kinetic parameters obtained from the conventional inorganic acid and base catalysts and the sulfonic acid functionalized ionic liquid, it is observed that the activation energy of the self-condensation of n-butyraldehyde catalyzed by Ce–Al2O3 is higher, indicating that the energy barrier of such a liquid–solid phase catalytic reaction is higher and an elevated reaction temperature will be required correspondingly. Pre-exponential factor reflects the collision frequency of the reactants in a reaction system. The pre-exponential factor of this aldol condensation catalyzed by Ce–Al2O3 is much less than those catalyzed by the conventional inorganic acid and base catalysts, but is equivalent to that catalyzed by the sulfonic acid functionalized ionic liquid. This is also because that the self-condensation of n-butyraldehyde catalyzed by Ce–Al2O3 is a liquid–solid heterogeneous catalytic reaction and the resistance of mass transfer is larger, resulting in a lower pre-exponential factor.
4. Conclusions
Among a series of solid acids, γ-Al2O3 showed a better catalytic performance for the self-condensation of n-butyraldehyde. The suitable preparation conditions were obtained as follows: pseudo-boehmite was calcinated at 500 °C for 4 h. Under the suitable reaction conditions of dosage of γ-Al2O3 catalyst = 15 wt%, reaction temperature = 180 °C and reaction time = 8 h, the conversion of n-butyraldehyde and the yield of 2-ethyl-2-hexenal attained 87.5% and 76.6% respectively. When γ-Al2O3 was modified by Ce, the increase of base amount improved the selective of 2-ethyl-2-hexenal and the yield of 2-ethyl-2-hexenal could reach 83.1%. Moreover, Ce–Al2O3 showed an excellent reusability. The XPS analyses of Ce3d demonstrated that the valence state of Ce affected the catalytic performance of Ce–Al2O3 to some extent while the acid and base properties of Ce–Al2O3 played a dominant role in its catalytic performance. Based on the analysis of the reaction system of the self-condensation of n-butyraldehyde catalyzed by Ce–Al2O3, some side-reactions such as the Tishchenko reaction, ketonization reaction and hydrogenation reaction were speculated and then a possible reaction network was proposed. The intrinsic kinetics for n-butyraldehyde self-condensation was established. Both the forward and backward reactions are second order and the corresponding activation energy is separately 79.60 kJ mol−1 and 74.30 kJ mol−1, higher than its homogeneous catalytic reaction system. The pre-exponential factor of the forward and backward reaction is separately 5.745 × 10⁵ m3 (kmol−1 s−1) and 2.146 × 10⁴ m3 (kmol−1 s−1), lower than the acid and base aqueous homogeneous catalytic reaction system but equivalent to the sulfonic acid functionalized ionic liquid system. The lower pre-exponential factors are due to the liquid–solid heterogeneous phase catalytic system. In conclusion, not only does Ce–Al2O3 show good catalytic performance, but also it can overcome the disadvantage of the corrosion of apparatus caused by an inorganic acid or base. Therefore, Ce–Al2O3 has a bright industrial prospect for the self-condensation of n-butyraldehyde.Acknowledgements
This work was financially supported by National Natural Science Foundation of China (Grant No. 21476058, 21236001) and Key Basic Research Project of Applied Basic Research Plan of Hebei Province (Grant No. 12965642D). The authors are gratefully appreciative of their contributions.Notes and references
- S. Liu, C. Xie, S. Yu, F. Liu and Z. Song, Ind. Eng. Chem. Res., 2010, 50, 2478–2481 CrossRef.
- G. J. Kelly, F. King and M. Kett, Green Chem., 2002, 4, 392–399 RSC.
- W. Shen, G. A. Tompsett, R. Xing, W. C. Conner Jr and G. W. Huber, J. Catal., 2012, 286, 248–259 CrossRef CAS.
- F. King and G. J. Kelly, Catal. Today, 2002, 73, 75–81 CrossRef CAS.
- Y. Watanabe, K. Sawada and M. Hayash, Green Chem., 2010, 12, 384–386 RSC.
- Y. Zhang, Master Thesis, Shanghai Normal University, Shanghai, China, 2010.
- H. E. Swift, J. E. Bozik and F. E. Massoth, J. Catal., 1969, 15, 407–416 CrossRef CAS.
- N. E. Musko and J. D. Grunwaldt, Top. Catal., 2011, 54, 1115–1123 CrossRef CAS.
- C. Chen, X. Liu, H. An, X. Zhao and Y. Wang, J. Chem. Ind. Eng., 2014, 65, 2106–2112 CAS , in Chinese.
- O. Kikhtyanin, V. Kelbichová, D. Vitvarová, M. Kubu and D. Kubicka, Catal. Today, 2014, 227, 154–162 CrossRef CAS.
- A. Lahyani, M. Chtourou, M. H. Frikha and M. Trabelsi, Ultrason. Sonochem., 2013, 20, 1296–1301 CrossRef CAS PubMed.
- B. Li, R. Yan, L. Wang, Y. Diao, Z. Li and S. Zhang, Ind. Eng. Chem. Res., 2014, 53, 1386–1394 CrossRef CAS.
- J. E. Rekoske and M. A. Barteau, Ind. Eng. Chem. Res., 2011, 50, 41–51 CrossRef CAS.
- T. Komatsu, M. Mitsuhashi and T. Yashima, Stud. Surf. Sci. Catal., 2002, 142, 667–674 CrossRef.
- P. Castano, G. Elordi, M. Olazar, A. T. Aguayo, B. Pawelec and J. Bilbao, Appl. Catal., B, 2007, 104, 91–100 CrossRef.
- A. Ungureanu, S. Royer, T. V. Hoang, D. T. On, E. Dumitriu and S. Kaliaguine, Microporous Mesoporous Mater., 2005, 24, 283–296 CrossRef.
- M. Jian, Y. Shi and D. Li, J. Mol. Catal., 1990, 4, 104–111 CAS , in Chinese.
- M. J. Climent, A. Corma, V. Fornés, R. Guil-Lopez and S. Iborra, Adv. Synth. Catal., 2002, 344, 1090–1096 CrossRef CAS.
- P. Huang, Z. Liu, M. Zheng and X. Xie, Ind. Catal. News, 2003, 11, 27–30 CAS , in Chinese.
- C. Anandan and P. Bera, Appl. Surf. Sci., 2013, 283, 297–303 CrossRef CAS.
- J. Z. Shyu, W. H. Weber and H. S. Gandhi, J. Phys. Chem., 1988, 92, 4964–4970 CrossRef CAS.
- F. B. Noronha, E. C. Fendley, R. R. Soares, W. E. Alvarez and D. E. Resasco, Chem. Eng. J., 2001, 82, 21–31 CrossRef CAS.
- Z. He, S. Tian and P. Ning, J. Rare Earths, 2012, 30, 563–572 CrossRef CAS.
- T. Tsoncheva, G. Issa, T. Blasco, M. Dimitrov, M. Popova, S. Hernández, D. Kovacheva, G. Atanasova and J. M. López Nieto, Appl. Catal., A, 2013, 453, 1–12 CrossRef CAS.
- V. Fernandes, I. L. Graff, J. Varald, L. Amaral, F. P. Ichtner, D. Demaille, Y. Zheng, W. H. Schreiner and D. H. Mosca, J. Electrochem. Soc., 2012, 159, K27 CrossRef CAS.
- G. M. Ingo, E. Paparazzo, O. Bagnarelli and N. Zacchetti, Surf. Interface Anal., 1990, 16, 515 CrossRef CAS.
- E. Bêche, P. Charvin, P. Derarnau, S. Abanades and G. Flaman, Surf. Interface Anal., 2008, 40, 264 CrossRef.
- A. Dauscher, L. Hilaire, F. L. Normand, W. Mulle, G. Maire and A. Vasquez, Surf. Interface Anal., 1990, 16, 341 CrossRef CAS.
- C. Wagner, W. Riggs, L. Davis, J. Moulder and G. Muilenberg, Perkin-Elmer Therm. Anal. Appl. Study, 1979, 6, 134–135 Search PubMed.
- J. P. Holgado, R. Alvarez and G. Munuera, Appl. Surf. Sci., 2000, 161, 301–315 CrossRef CAS.
- V. Chauvaut, V. Albin, H. Schneider, M. Cassir, H. Ardéléan and A. Galtayries, J. Appl. Electrochem., 2000, 30, 1405 CrossRef CAS.
- N. Liang, X. Zhang, H. An, X. Zhao and Y. Wang, Green Chem., 2015, 17, 2959–2972 RSC.
- R. Wang and Y. Guo, Ind. Catal. News, 2015, 23, 54–58 CAS , in Chinese.
- R. Bleta, P. Alphonese, L. Pin, M. Gressier and M. J. Menu, J. Colloid Interface Sci., 2012, 367, 120–128 CrossRef CAS PubMed.
- R. K. Zeidan and M. E. Davis, J. Catal., 2007, 25, 379–382 CrossRef.
- H. Tsuji, F. Yagi, H. Hattori and H. Kiti, J. Catal., 1994, 148, 759–770 CrossRef CAS.
- H. Idriss, K. S. Kim and M. A. Barteau, J. Catal., 1993, 139, 119–133 CrossRef CAS.
- S. Luo and J. L. Falconer, J. Catal., 1999, 185, 393–407 CrossRef CAS.
- M. Glinski, W. Szymanski and D. Lomot, Appl. Catal., A, 2005, 281, 107–113 CrossRef CAS.
- X. Zhu, Y. Yao, H. Li, X. Lu and Q. Sheng, J. Chin. Rare Earth Soc., 2002, 20, 468–469 CAS , in Chinese.
- X. Zhang, H. An, H. Zhang, X. Zhao and Y. Wang, Ind. Eng. Chem. Res., 2014, 53, 16707–16714 CrossRef CAS.
- S. Lee and A. Varma, Chem. Eng. Sci., 2013, 104, 619–629 CrossRef CAS.
- M. T. Casale, A. R. Richman, M. J. Elrod, R. M. Garland, M. R. Beaver and M. A. Tolbert, Atmos. Environ., 2007, 41, 6212–6224 CrossRef CAS.
Footnote |
| † Electronic supplementary information (ESI) available. See DOI: 10.1039/c5ra21125e |
| This journal is © The Royal Society of Chemistry 2015 |