DOI:
10.1039/C5RA20916A
(Paper)
RSC Adv., 2015,
5, 104071-104078
Catalytic dehydrochlorination of 1,2-dichloroethane to produce vinyl chloride over N-doped coconut activated carbon†
Received
9th October 2015
, Accepted 28th November 2015
First published on 1st December 2015
Abstract
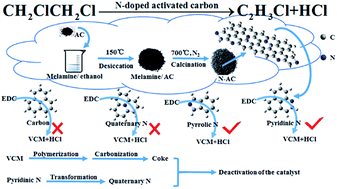
A series of N-doped coconut activated carbon catalysts (N-AC) were prepared using melamine as the nitrogen precursor and their performance for the catalytic dehydrochlorination of 1,2-dichloroethane (1,2-DCE) to produce vinyl chloride monomer (VCM) was assessed. It is indicated that the N-doped catalyst 5
:
10-N-AC exhibits a stable catalytic activity at 250 °C with the 1,2-DCE conversion of 85.1% at 180 h. Through DFT calculations, it is suggested that both pyridinic and pyrrolic nitrogen dopants can adsorb preferentially 1,2-DCE and increase the activity for 1,2-DCE dehydrochlorination at low temperature, in combination with characterizations of BET, Raman, TG, TPD, XPS, etc. In addition, the increase of quaternary nitrogen dopants and coking deposition on the catalyst surface can result in the activity decline. The N-doped activated carbon catalyst provides a promising pathway to produce VCM through a low-temperature energy-saving process of 1,2-DCE catalytic dehydrochlorination.
1. Introduction
Vinyl chloride monomer (VCM) is used to produce polyvinyl chloride (PVC), one of the most popular engineering plastics widely used worldwide.1,2 There are two main pathways to manufacture VCM in the PVC industry: the acetylene hydrochlorination reaction (the coal-based way) and the thermal dehydrochlorination of 1,2-dichloroethane (1,2-DCE) (the oil-based way).3,4 The coal-based reaction way has recently attracted considerable attention in countries enriched with coal sources; however, it faces the bottleneck of huge energy consumption in the production of the raw material of calcium carbide and the serious environment pollution caused by the highly toxic and volatile mercuric chloride catalyst used for acetylene hydrochlorination reaction.5,6 In contrast, the oil-based way is much cleaner and is the current dominant technique to produce VCM using the raw material of oil-based ethylene.7 The thermal dehydrochlorination of 1,2-DCE is performed industrially at the temperature of 480–530 °C and the pressure of 1–2 MPa with the reaction expressed in eqn (1), which provides an 1,2-DCE conversion of about 50–60% and a selectivity to VCM about 99%8 but suffers from the coking deposition in the tubular reactors. Hence, the industrial operation of 1,2-DCE pyrolysis process is discontinuous, i.e., the unit has to be shut down for decoking process every certain intervals dependent on the type of reactor, feedstock, and operating conditions.8–11 |
CH2ClCH2Cl → C2H3Cl + HCl ΔH = 72.8 kJ mol−1
| (1) |
Previous literature has indicated that the 1,2-DCE pyrolysis process proceeds via free-radical reactions, and the coke deposition is resulted partially from the chloroethyl radicals.12–16 Therefore, the catalytic dehydrochlorination of 1,2-DCE has been studied extensively to explore a dehydrochlorination process at lower temperature in order to suppress the coke deposition. For instances, Eberly et al. reported that over the supported ZnCl2 catalyst the 1,2-DCE dehydrochlorination showed a 1,2-DCE conversion of 67.3% at 475 °C.12 Okamoto et al. reported that the activated carbon could be used as the catalyst for 1,2-DCE dehydrochlorination, exhibiting an initial 1,2-DCE conversion of 98.3% at 380 °C and the total liquid hourly space velocity (LHSV) of 0.2 h−1.13 Sotowa et al. used the pyridine deposited pitch-based active carbon fiber as the 1,2-DCE dehydrochlorination catalyst, achieving an initial 1,2-DCE conversion about 60% at 360 °C and the LHSV of 0.5 h−1, but the catalytic activity lost totally in 200 h owing to the pore blocking caused by coking.14 Later, Mochida et al. used polyacrylonitrile-based active carbon fibers as the 1,2-DCE dehydrochlorination catalyst, providing an initial 1,2-DCE conversion about 50% at 360 °C and the LHSV of 1.7 h−1, but the activity lost totally in 50 h due to the coking.15,16 Therefore, it is still a challenge to explore an efficient catalyst for the catalytic dehydrochlorination of 1,2-DCE at low temperature.
Recently, nitrogen-doped graphene supports have been extensively studied to improve the performance of certain catalysts for the oxygen reduction or CO oxidation reaction,17–20 since the nitrogen dopants in carbon materials can enhance the polarity, conductivity and surface hydrophilicity. In particular, nanocomposites of nitrogen-doped carbon21 and graphitic carbon nitride22 were studied respectively as non-metallic catalysts for acetylene hydrochlorination reaction. And a nitrogen-doped ordered mesoporous carbon was prepared using resorcinol and formaldehyde as the carbon precursor and dicyandiamide as the nitrogen precursor, showing the 1,2-DCE conversion about 80% at 300 °C and 10 h reaction time.23 We are enlightened to study an effective nitrogen-doped activated carbon-based catalyst for 1,2-DCE dehydrochlorination with high activity but low coking deposition at low temperature.
In this article, a series of N-doped coconut activated carbon catalysts were prepared using melamine as the nitrogen precursor and assessed the performance for the catalytic dehydrochlorination of 1,2-DCE, in combination with characterizations of BET, Raman, TG, TPD, XPS, etc. It is indicated that the N-doped catalyst 5
:
10-N-AC exhibits a stable catalytic activity at 250 °C with a 1,2-DCE conversion of 85.1% at 180 h.
2. Experimental
2.1 Materials
The raw materials of coconut activated carbon, without the treatment by acidic solution were purchased from Fujian Sensen Activated Carbon Industry Science and Technology Co., Ltd. The reagents including melamine (99.5%), 1,2-dichloroethane (99%), ethanol (99.7%) and sodium hydroxide were purchased from Tianjin Guangfu Fine Chemical Research Institute.
2.2 Catalyst preparation
The coconut activated carbon with the particle size of 40–60 mesh, labeled as AC, was screened to prepare the N-doped catalyst. The N-doped coconut activated carbon (N-AC) samples were prepared using melamine as the nitrogen source. A 0.05 g mL−1 melamine ethanol suspension was added quantitatively into 50 g AC under stirring, so as to modulate the mass ratio of melamine and AC in the range from 0.5
:
10 to 7
:
10. Having been incubated at 60 °C for 12 h and dessicated at 150 °C for 12 h, the AC–melamine mixture was calcined in a tubular furnace at 700 °C for 4 h under N2 atmosphere with a flow rate of 100 mL min−1. The obtained N-doped AC samples were named in terms of the melamine/AC mass ratio, e.g., 0.5
:
10-N-AC and 1
:
10-N-AC indicate the N-doped AC prepared with the melamine/AC mass ratio of 0.5
:
10 and 1
:
10, respectively.
As a control, the coconut activated carbon was calcined at 700 °C without the addition of melamine, and the obtained sample was denoted as 700-AC.
2.3 Catalyst activity evaluation
The experimental apparatus to assess the performance of catalysts is shown in Fig. S1,† with a fixed-bed micro-reactor made of stainless steel tube (i.d. 8 mm). The pipeline was purged with nitrogen to remove water vapor and air in the system before each experiment. Liquid 1,2-DCE, with the LHSV value of 0.2 h−1, was fed into a vaporizing chamber by a micro-injection pump at a rate of 0.10 mL min−1, where the 1,2-DCE was vaporized to flow into the reactor with 30 mL catalyst at a temperature of 250 °C. The effluent of the reactor was condensed to separate the unreacted 1,2-DCE and then passed into an absorption bottle containing 1 M NaOH solution (100 mL) to remove HCl, followed by the composition analysis using Beifen GC-3420A gas chromatograph with a hydrogen flame ionization detector (FID). The absorption bottle with NaOH solution was alternated every 60 minutes, the inside solution was titrated with a HCl standard solution to measure the NaOH residual in the absorption solution.
The dehydrochlorination conversion of 1,2-DCE (X) and the selectivity to VCM (S) were calculated as follows:
|
 | (2) |
|
 | (3) |
where,
V1 is the volume of NaOH solution that used for the absorption (
V1 = 0.1 L),
c1 is the initial concentration of NaOH in the solution that used for the absorption (
c1 = 1 mol L
−1),
t is the absorption time (
t = 60 min),
V2 is the volume of the HCl standard solution that consumed in the titration,
c2 is the concentration of HCl standard solution,
M is the molecular weight of 1,2-DCE,
Q is the volume flow rate of 1,2-DCE (
Q = 0.10 mL min
−1),
ρ is the mass density of 1,2-DCE,
φ is the mole fraction of 1,2-DCE in the gas mixture of which composition is analyzed by gas chromatograph.
2.4 Catalyst characterization
The BET surface area and total pore volume of catalysts were measured by N2 adsorption–desorption at −196 °C with Quantachrome Autosorb Automated Gas Sorption System from USA. The catalyst samples were degassed at 250 °C for 4 h under vacuum before measurements.
The X-ray photoelectron spectroscopy (XPS) measurements of the catalysts were performed by pHI5000 Versa Probe spectrometer, equipped with monochromatised Al Kα X-ray as the excitation source (24.2 W), with an analyzer pass energy of 187.85 eV for survey scans and 46.95 eV for detailed elemental scans. In order to subtract the surface charging effect, binding energies were referenced to C 1s binding energy of carbon, taken to be 284.6 eV. The XPS spectra were analyzed by the XPS peak software.
Structural deformations of the catalysts were determined by Raman spectroscopic analysis using Renishaw from UK, with a He–Ne laser source of 532 nm wavelength, which was focused by a 50 times objective lens with a 0.75 numerical aperture value onto an approximately 1 μm2 sample area.
Thermogravimetric analysis (TGA) of sample was carried out to detect coke deposition using a Diamond thermogravimetric analysis (Perkin Elmer), under air atmosphere at a flow rate of 80 mL min−1. The temperature was increased from 30 to 800 °C (heating rate, 10 °C min−1).
Temperature-programmed desorption (TPD) was performed using a Micromeritics ASAP 2720 instrument equipped with a thermal conductivity detector (TCD) in a temperature range of 50–600 °C, with the heating rate of 10 °C min−1 and the gas flow rate of 25 mL min−1. The catalysts amount used for the test is tuned to keep all the peak areas of these samples similar.
2.5 Computational details
All density functional calculations were performed using the hybrid B3LYP24,25 function, as implemented in the Gaussian 09 program package.26 The standard 6-31G ++ (d,p) basis set was used for C, H, N and Cl atoms. Atomic charges were calculated using the Mulliken type. No geometric constraints were assumed in the geometry optimization. The frequencies of all geometries were calculated at the same level to identify the nature of the stationary points and obtain the zeropoint-energy (ZPE) corrections. Hessian calculation is used to characterize minima (no imaginary frequencies) or transition states (one imaginary frequency). Intrinsic reaction coordinate (IRC) calculations27,28 were used to determine if each transition state linked the correct product with each reactant.
3. Results and discussion
3.1 Catalytic performance of N-doped coconut activated carbon
Fig. 1 shows the performance of the prepared catalysts for catalytic dehydrochlorination of 1,2-DCE reaction at 250 °C and LHSV (1,2-DCE) = 0.2 h−1. Over the undoped AC and 700-AC, the 1,2-DCE conversion is as low as 3% with the selectivity to VCM equal 99.2%. Whereas over N-doped catalysts the 1,2-DCE conversion is increased significantly, for instance, the 1,2-DCE conversion is 55.9% over 0.5
:
10-N-AC, 85.1% over 5
:
10-N-AC, and 86.4% over 7
:
10-N-AC at 180 h, respectively. Fig. S2† shows the effect of temperature on the catalytic performance. The 1,2-DCE conversion of all the catalysts increases with the reaction temperature. It is worthwhile to mention that over 5
:
10-N-AC catalyst the 1,2-DCE conversion is as high as 100% at 260 °C, whereas over undoped AC the total conversion of 1,2-DCE is achieved at 340 °C. It is indicated that the N-dopant can greatly improve the catalytic activity of activated carbon for 1,2-DCE dehydrochlorination, with the activity associated with the melamine/AC mass ratio.
 |
| Fig. 1 1,2-DCE conversion and the selectivity to VCM over different catalysts. Reaction conditions: temperature = 250 °C, 0.1 MPa, LHSV (1,2-DCE) = 0.2 h−1. | |
3.2 Catalyst characterization
3.2.1 N2 adsorption–desorption. Table 1 shows the pore structure parameters of the fresh and used catalysts tested by N2 adsorption–desorption, with the adsorption–desorption isotherms displayed in Fig. S3.† The surface area and total pore volume of N-doped catalysts are lower than those of AC, probably due to the pore blocking resulted from the decomposition of melamine during the calcination. In addition, for the N-doped used catalysts, the surface area and total pore volume are lower than those of the corresponding fresh, suggesting that the catalysts pores are partially blocked during the 1,2-DCE dehydrochlorination reaction. It is worth to mention that the surface area and total pore volume for 700-AC are higher than that obtained for AC, as most of the organic compounds lodged in the micropores can be removed and few pore collapses occur at the calcination temperature of 700 °C.29,30
Table 1 Pore structure parameters of fresh and used catalysts test by N2 adsorption–desorptiona
Samples |
SBET (m2 g−1) |
V (cm3 g−1) |
Fresh |
Used |
Fresh |
Used |
SBET: surface area; V: total pore volume. |
AC |
1156 |
1106 |
0.65 |
0.58 |
700-AC |
1188 |
1125 |
0.69 |
0.64 |
0.5 : 10-N-AC |
1089 |
940 |
0.61 |
0.51 |
1 : 10-N-AC |
1053 |
914 |
0.59 |
0.49 |
2 : 10-N-AC |
1000 |
859 |
0.56 |
0.44 |
5 : 10-N-AC |
929 |
781 |
0.53 |
0.41 |
7 : 10-N-AC |
902 |
752 |
0.51 |
0.40 |
3.2.2 Elemental analysis. The element composition of individual catalyst was measured by XPS. As listed in Table 2, the N content of the N-AC catalysts increases obviously compared with the AC and 700-AC, in particular, the N content increases with the increase of melamine/AC mass ratio, indicating that nitrogen atoms have been doped successfully in the activated carbon catalysts after the calcination with melamine. Moreover, the N content increases with the increasing melamine/AC mass ratio. The O content decreases after calcination, probably due to the decomposition of the oxygen containing groups on the carbon surface and its reaction with melamine. There are trace amounts of Cl in the fresh catalysts which may due to the impurities in the activated carbon. Table S1† gives the bulk phase C, H, N contents of catalysts tested by elemental analyses, which coincide with the XPS results. In combination with the catalytic activity in Fig. 1, it is illustrated that the more amount of N dopants in the catalyst results in more active sites and then higher catalytic activity.
Table 2 Surface element content of fresh and used catalysts determined by XPS
Samples |
Surface atomic composition of fresh catalysts (atom%) |
Surface atomic composition of used catalysts (atom%) |
C 1s |
O 1s |
N 1s |
Cl 2p |
C 1s |
O 1s |
N 1s |
Cl 2p |
AC |
93.0 |
6.6 |
0.3 |
0.1 |
94.6 |
4.0 |
0.2 |
1.2 |
700-AC |
95.1 |
4.6 |
0.2 |
0.1 |
94.3 |
4.3 |
0.2 |
1.2 |
0.5 : 10-N-AC |
93.4 |
5.0 |
1.5 |
0.1 |
93.1 |
4.2 |
1.0 |
1.7 |
1 : 10-N-AC |
93.0 |
4.9 |
2.0 |
0.1 |
92.5 |
4.1 |
1.5 |
1.9 |
2 : 10-N-AC |
92.7 |
4.7 |
2.5 |
0.1 |
92.2 |
4.1 |
1.7 |
2.0 |
5 : 10-N-AC |
91.2 |
4.4 |
4.3 |
0.1 |
91.8 |
4.0 |
1.9 |
2.3 |
7 : 10-N-AC |
91.4 |
4.1 |
4.4 |
0.1 |
91.6 |
3.9 |
2.1 |
2.4 |
In the case of the used catalysts, the N contents decrease while Cl contents increase, comparing with the fresh catalysts, which is probably due to the polymerization of VCM on the pore surface of the catalysts. VCM is easy to polymerize under high temperature14,15 and most vinyl chloride molecules produced by 1,2-DCE dehydrochlorination could desorb from the pore of catalysts, while some vinyl chloride molecules polymerize in the pores, attach to the active sites and gradually carbonized into coke, which leads to the blocking of some pores. Finally, the catalysts lose their activity gradually.
3.2.5 Adsorptive properties of the reactant and products. TPD is carried out to study the effect of N-doping process on the adsorption properties of the reactant and products on the catalysts. Fig. 2 shows the 1,2-DCE, HCl and VCM TPD profiles on different catalysts and Table S2† lists the desorption amount of the catalysts. It is known that the desorption area and the peak temperature can suggest the binding strength of adsorbed species on catalysts. As shown in Fig. 2, the peak positions of 1,2-DCE, HCl and VCM TPD profiles shift to higher temperature with the increasing N content in the catalysts. For the 1,2-DCE-TPD, the peak position of the AC is 201 °C, while the peak position of the 7
:
10-N-AC is 221 °C. For the HCl-TPD, the peak position of the AC is 218 °C, while the peak position of the 7
:
10-N-AC is 243 °C. For the VCM-TPD, the peak position of the AC is 153 °C, while the peak position of the 7
:
10-N-AC is 163 °C. The desorption peak areas of these samples are converted to the values at the same sample amount, which are shown in Table S2.† As shown in Table S2,† the desorption peak area of 1,2-DCE, HCl and VCM TPD profiles also increase as the N content of the catalysts increase. It is indicated that N-doping process can enhance the adsorption of both reactant and products, which is beneficial to the 1,2-DCE dehydrochlorination reaction but meanwhile generate more coke, in accord with the TG results (Table. 4).
 |
| Fig. 2 TPD profiles of the catalysts. (a) 1,2-DCE-TPD, (b) HCl-TPD, (c) VCM-TPD. | |
3.2.6 XPS spectra. XPS spectra were analysed to distinguish the valence states of nitrogen species in the fresh and used catalysts. Through the deconvolution of XPS N 1s profiles (Fig. S6†), there are three peaks located respectively at 398.5 eV due to the pyridinic nitrogen, at 400.0 eV due to pyrrolic nitrogen and at 401.2 eV due to quaternary nitrogen.31,32 Table 5 lists the relative contents and binding energies of nitrogen species in the fresh and used catalysts. For the fresh N-AC catalysts, the content of the pyridinic nitrogen (N1) decreases, the content of pyrrolic nitrogen (N2) increases, while the content of quaternary nitrogen (N3) is almost unchanged. In the case of used N-AC catalysts after 180 h reaction, the contents of pyridinic nitrogen and pyrrolic nitrogen decrease while the content of quaternary nitrogen increases obviously, comparing with the fresh N-AC catalysts. It is indicated that the pyridinic and pyrrolic nitrogen dopants convert into the quaternary nitrogen during the reaction, resulting in the activity decline. Previously, Sotowa et al.16 studied polyacrylonitrile-based active carbon fiber as a catalyst for dehydrochlorination of 1,2-DCE, and found that the pyridinic nitrogen content decreased while the quaternary nitrogen content increased during the deactivation of the catalyst, so they considered that pyridinic nitrogen was the critical active sites for the reaction. Li et al.21 prepared nitrogen-doped carbon composites and use it in the acetylene hydrochlorination reaction, and found that the content of pyrrolic nitrogen is a key factor for the catalytic activity. In combination with the XPS spectra (Fig. S6†) and the catalyst activity (Fig. 1), it is reasonable to consider that the decrease of pyridinic and pyrrolic nitrogen contents probably results in the declining of the catalytic activity. It is suggested that the pyridinic and pyrrolic nitrogen species are the critical nitrogen species in the 1,2-DCE dehydrochlorination, and the quaternary nitrogen species have little catalytic activity in the reaction.
Table 5 The relative contents and binding energies of nitrogen species in the fresh and used catalystsa
Samples |
Relative contents (area%) |
N1 (398.5 eV) |
N2 (400.0 eV) |
N3 (401.2 eV) |
N1: pyridinic nitrogen, N2: pyrrolic nitrogen, N3: quaternary nitrogen. |
Fresh 0.5 : 10-N-AC |
70.82 |
17.87 |
11.31 |
Fresh 1 : 10-N-AC |
66.92 |
22.32 |
10.76 |
Fresh 2 : 10-N-AC |
62.41 |
26.28 |
11.31 |
Fresh 5 : 10-N-AC |
61.21 |
28.21 |
10.58 |
Fresh 7 : 10-N-AC |
57.31 |
33.17 |
9.52 |
Used 0.5 : 10-N-AC |
59.01 |
17.62 |
23.37 |
Used 1 : 10-N-AC |
45.88 |
17.34 |
36.78 |
Used 2 : 10-N-AC |
42.32 |
20.31 |
37.37 |
Used 5 : 10-N-AC |
39.69 |
21.03 |
39.28 |
Used 7 : 10-N-AC |
33.24 |
23.77 |
42.99 |
Through the deconvolution of XPS Cl 2p profiles (Fig. S7†), the different chemical states of Cl are represented by four main peaks at 197.3 eV, 199.0 eV, 200.2 eV and 201.7 eV, respectively, corresponded to the Cl 2p3/2 of Cl−1, the Cl 2p1/2 of Cl−1, the Cl 2p3/2 of C–Cl bond, and the Cl 2p1/2 of C–Cl bond.33,34 Polymer of vinyl chloride is proved to be produced on the catalysts surface during the reaction by the C–Cl bond that exists in the used catalysts. The Cl−1 can be attributed to the HCl product that absorbed on the catalysts. It can be concluded the coke deposits containing both carbon and chlorine are the cause of deactivation.
3.2.7 Density functional theory (DFT) calculations. In order to study the active sites in the catalysts, three kinds of N dopant species models were built by Gaussian, with N1, N2 and N3 indicating respectively the pyridinic, the pyrrolic and the quaternary nitrogen, as shown in Fig. 3. The adsorption energies of 1,2-DCE, VCM and HCl were calculated on three different N dopant models, as listed in Table 6. The theoretical calculation results show that 1,2-DCE can be adsorbed onto the pyridinic nitrogen structure (EAds = −2.21 kcal mol−1) and pyrrolic nitrogen structure (EAds = −2.73 kcal mol−1), which is obviously stronger than that on the quaternary nitrogen structure (EAds = −0.82 kcal mol−1) and graphene structure (EAds = −0.08 kcal mol−1). The stronger adsorption energies of 1,2-DCE on N1 and N2 indicate that the pyridinic and pyrrolic nitrogen dopant species play key role in enhancing the activity for 1,2-DCE dehydrochlorination.
 |
| Fig. 3 The structures of various N species in the N-doped AC catalysts. C: graphene structure; N1: pyridinic nitrogen structure; N2: pyrrolic nitrogen structure; N3: quaternary nitrogen structure. Nitrogen, carbon, and hydrogen atoms are depicted in blue, gray and white, respectively. | |
Table 6 Adsorption energies on different N species in the N-doped AC catalystsa
Type |
Adsorption energy (kcal mol−1) |
C: graphene structure; N1: pyridinic nitrogen structure; N2: pyrrolic nitrogen structure; N3: quaternary nitrogen structure. |
C–1,2-DCE |
−0.08 |
N1–1,2-DCE |
−2.21 |
N2–1,2-DCE |
−2.73 |
N3–1,2-DCE |
−0.82 |
C–VCM |
−0.47 |
N1–VCM |
−1.27 |
N2–VCM |
−1.55 |
N3–VCM |
−0.43 |
C–HCl |
−1.65 |
N1–HCl |
−9.57 |
N2–HCl |
−8.88 |
N3–HCl |
−2.31 |
Density functional theory (DFT) calculations were performed to disclose the reason that the pyridinic and pyrrolic nitrogen dopants are more active in the 1,2-DCE dehydrochlorination. These calculations were used to study the most relevant elementary steps involved in the mechanism of 1,2-DCE dehydrochlorination, including adsorption sites, cleavage of H–C bond and Cl–C bond, formation of H–Cl bond and C
C bond, and product desorption. Fig. 4 shows the energy profile for 1,2-DCE dehydrochlorination, the detailed geometries of the substances involved in the reaction path are displayed in Fig. S8.† In addition, Table 7 lists the changes of bond length and electron density. As observed in Fig. 4(a) and S8(a),† the 1,2-DCE (the first configuration) rotates its C–C bond and translates into a new configuration (the second configuration) containing higher energy via a transition states (Ts1). Then the 1,2-DCE (the second configuration) is adsorbed at the nitrogen atom on the pyrrolic nitrogen through its H(1) atom near the nitrogen atom. The bond length of H(1)–C(1) and Cl(2)–C(2) in 1,2-DCE in ads is 1.092 Å and 1.816 Å (Fig. S8† – Ads), which is longer than the normal 1.090 Å and 1.810 Å in free 1,2-DCE (Fig. S8† – Re′). This result indicates that 1,2-DCE is activated in the ads system. Therefore, the catalytic performance of N-AC could be due to N–AC providing activation sites for 1,2-DCE. This also explains why the 1,2-DCE conversion rate increases with increasing nitrogen content in the N–AC catalyst. In Ts2, both of the H(1)–C(1) and Cl(2)–C(2) bond length become longer than that in Ads further, and the electron density of H(1), Cl(2), N increases from 0.209 au, –0.045 au, –0.090 au (Ads) to 0.551 au, –0.035 au, 0.093 au (Ts2). Thus in this step, the H(1)–C(1) and Cl(2)–C(2) bond break, forming the C
C bond and HCl molecule, which has the highest energy barrier of 31.23 kcal mol−1 and is the rate-controlling step. The final step is the desorption of the VCM and HCl molecules, and the desorption energy is 10.58 kcal mol−1. The process of the catalytic reaction on the pyridinic nitrogen structure shown in Fig. 4(b) and S8(b)† is similar with that on the pyrrolic nitrogen structure, which also has a similar energy barrier of 33.19 kcal mol−1.
 |
| Fig. 4 Reaction energy diagram of the substances involved in the reaction path. (a): For pyrrolic nitrogen structure; (b): for pyridinic nitrogen structure. The path contains: reactant of 1,2-DCE in first configuration (Re), transition state 1 (Ts1), reactant of 1,2-DCE in second configuration (Re′), adsorbed reactants (Ads), transition state 2 (Ts2), co-adsorbed products (Co-ads), product (Pr). Chlorine, nitrogen, carbon, and hydrogen atoms are depicted in green, blue, gray and white, respectively. | |
Table 7 The changes of bond length and electron density corresponding to the reaction path in Fig. 4
Path |
Type |
Re′ |
Ads |
Ts2 |
Path on pyrrolic nitrogen structure |
C–Cl bond length |
1.810 |
1.816 |
1.845 |
C–H bond length |
1.090 |
1.092 |
1.512 |
N electron density |
−0.140 |
−0.090 |
0.093 |
H electron density |
0.208 |
0.209 |
0.551 |
Cl electron density |
−0.022 |
−0.045 |
−0.035 |
Path on pyridinic nitrogen structure |
C–Cl bond length |
1.810 |
1.815 |
1.859 |
C–H bond length |
1.090 |
1.092 |
1.662 |
N electron density |
−0.140 |
−0.123 |
0.045 |
H electron density |
0.208 |
0.165 |
0.519 |
Cl electron density |
−0.022 |
−0.030 |
−0.054 |
4. Conclusions
N-doping method is an effective way to improve the catalytic activity of activated carbon on 1,2-DCE dehydrochlorination. The 1,2-DCE conversion increases obviously after N-doping process, and the VCM selectivity also increases slightly. The best catalytic performance is obtained over 5
:
10-N-AC, with an initial 1,2-DCE conversion of 85.1% and VMC selectivity of 99.4%. All the N-doped coconut activated carbon catalysts show good stability, with an 1,2-DCE conversion decline below 6.3% in 180 h. After N-doping process, the adsorption energy between 1,2-DCE and activated carbon increases, the electron density and transfer property of the activated carbon is enhanced, and the defects on the activated carbon increases, which are the main reasons for the activity improvement. Pyridinic and pyrrolic nitrogen species are the critical nitrogen species in the catalyst reaction. The pyridinic and pyrrolic nitrogen can adsorb 1,2-DCE and activated H(1)–C(1) and Cl(2)–C(2) bond, and the cleavage of H–C and Cl–C bond provides a rate-controlling step (Eact = 31.23 kcal mol−1 for pyrrolic nitrogen, and Eact = 33.19 kcal mol−1 for pyridinic nitrogen). The activity decline is due to increase of quaternary nitrogen species and coking. This research could provide a low energy consumption and low price way for dehydrochlorination of 1,2-DCE.
Acknowledgements
This work was supported by the National Basic Research Program of China (2012CB720302), NSFC (21176174), and the Program for Changjiang Scholars and Innovative Research Team in University (No. IRT1161).
References
- X. Wei, H. Shi, W. Qian, G. Luo, Y. Jin and F. Wei, Ind. Eng. Chem. Res., 2009, 48, 128–133 CrossRef CAS.
- J. Zhang, N. Liu, W. Li and B. Dai, Front. Chem. Sci. Eng., 2011, 5, 514–520 CrossRef CAS.
- H. Zhang, B. Dai, W. Li, X. Wang, J. Zhang, M. Zhu and J. Gu, J. Catal., 2014, 316, 141–148 CrossRef CAS.
- J. B. Agnew and H. S. Shankar, Ind. Eng. Chem. Prod. Res. Dev., 1986, 25, 19–22 CrossRef CAS.
- M. Conte, A. F. Carley, C. Heirene, D. J. Willock, P. Johnston, A. A. Herzing, C. J. Kiely and G. J. Hutchings, J. Catal., 2007, 250, 231–239 CrossRef CAS.
- B. Nkosi, N. J. Coville, G. J. Hutchings, M. D. Adams, J. Friedl and F. E. Wanger, J. Catal., 1991, 128, 366–377 CrossRef CAS.
- Y. Korai, M. Ishibashi, K. Yamamoto, I. Mochida and K. Higuchi, J. Jpn. Pet. Inst., 2003, 46, 308–314 CrossRef CAS.
- A. Borsa, A. M. Herring and T. J. McKinnon, Ind. Eng. Chem. Res., 1999, 38, 4259–4267 CrossRef CAS.
- L. F. Albright and J. C. Marek, Ind. Eng. Chem. Res., 1988, 27, 755–759 CrossRef CAS.
- I. Mochida, T. Tsunawaki, C. Sotowa, Y. Korai and K. Higuchi, Ind. Eng. Chem. Res., 1996, 35, 3803–3807 CrossRef CAS.
- C. Li, G. Hu, W. Zhong, W. He, W. Du and F. Qian, Ind. Eng. Chem. Res., 2013, 52, 17501–17516 CrossRef CAS.
- K. C. Eberly, US Patent 2 875 255, to The Firestone Tire & Rubber Company, 1959.
- K. Okamoto and K. Adachi, Bull. Chem. Soc. Jpn., 1966, 39, 1522–1524 CrossRef CAS.
- C. Sotowa, Y. Kawabuchi and I. Mochida, Chem. Lett., 1996, 11, 967–968 CrossRef.
- I. Mochida and Y. Watanabe, Chem. Lett., 1994, 2, 197–200 CrossRef.
- C. Sotowa, Y. Watanabe, S. Yatsunami, Y. Korai and I. Mochida, Appl. Catal., A, 1999, 180, 317–323 CrossRef CAS.
- Z. Wu, E. M. Benchafia, Z. Iqbal and X. Wang, Angew. Chem., Int. Ed., 2014, 53, 12555–12559 CAS.
- X. Lepro, R. Ovalle-Robles, M. D. Lima, A. L. Elias, M. Terrones and R. H. Baughman, Adv. Funct. Mater., 2012, 22, 1069–1075 CrossRef CAS.
- K. Gong, F. Du, Z. Xia, M. Durstock and L. Dai, Science, 2009, 323, 760–764 CrossRef CAS PubMed.
- L. Yu, X. Pan, X. Cao, P. Hu and X. Bao, J. Catal., 2011, 282, 183–190 CrossRef CAS.
- X. Li, X. Pan, L. Yu, P. Ren, X. Wu, L. Sun, F. Jiao and X. Bao, Nat. Commun., 2014, 5, 3688 CAS.
- X. Li, Y. Wang, L. Kang, M. Zhu and B. Dai, J. Catal., 2014, 311, 288–294 CrossRef CAS.
- J. Xu, X. Zhao, A. Wang and T. Zhang, Carbon, 2014, 80, 610–616 CrossRef CAS.
- A. D. Becke, J. Chem. Phys., 1993, 98, 5648–5652 CrossRef CAS.
- C. Lee, W. Yang and R. G. Parr, Phys. Rev. B, 1988, 37, 785 CrossRef CAS.
- M. J. Frisch, G. W. Trucks, H. B. Schlegel, M. A. Scuseria, M. A. Robb, J. R. Cheeseman, V. G. Zakrzewski, J. A. Montgomery, R. E. Stratmann and J. C. Burant, et al., Gaussian 09, Revision C.01, Gaussian Inc., Wallingford, CT, 2010 Search PubMed.
- C. Gonzalez and H. B. Schlegel, J. Phys. Chem. C, 1989, 90, 2154–2161 CrossRef CAS.
- C. Gonzalez and H. B. Schlegel, J. Phys. Chem. C, 1990, 94, 5523–5527 CrossRef CAS.
- P. Chingombe, B. Saha and R. J. Wakeman, Carbon, 2005, 43, 3132–3143 CrossRef CAS.
- Y. C. Chiang, C. Y. Lee and H. C. Lee, Mater. Chem. Phys., 2007, 101, 199–210 CrossRef CAS.
- D. Hulicova-Jurcakova, M. Kodama, S. Shiraishi, H. Hatori, Z. H. Zhu and G. Q. Lu, Adv. Funct. Mater., 2009, 19, 1800–1809 CrossRef CAS.
- D. Wei, Y. Liu, Y. Wang, H. Zhang, L. Huang and G. Yu, Nano Lett., 2009, 9, 1752–1758 CrossRef CAS.
- N. Tsubouchi, T. Saito, N. Ohtaka, Y. Nakazato and Y. Ohtsuka, Energy Fuels, 2013, 27, 5076–5082 CAS.
- N. Tsubouchi, T. Saito, N. Ohtaka, Y. Nakazato and Y. Ohtsuka, Energy Fuels, 2013, 27, 87–96 CrossRef CAS.
Footnote |
† Electronic supplementary information (ESI) available. See DOI: 10.1039/c5ra20916a |
|
This journal is © The Royal Society of Chemistry 2015 |
Click here to see how this site uses Cookies. View our privacy policy here.