On the origin of the oxidizing ability of ceria nanoparticles†
Pan Ni,
Xiaoshu Wei,
Jin Guo,
Xiaorui Ye and
Sen Yang*
College of Resources and Environmental Sciences, China Agricultural University, Beijing 100193, PR China. E-mail: syang@cau.edu.cn; Fax: +86 1062733470; Tel: +86 1062733470
First published on 5th November 2015
Abstract
To better understand the oxidizing ability of ceria nanoparticles (nanoceria), the influences of protons, dissolved oxygen (DO), superoxide dismutase (SOD) and catalase on the oxidation of organic dyes in an aqueous suspension of rod-like nanoceria were investigated in detail. The strong oxidizing ability of nanoceria was verified. Electron paramagnetic resonance (EPR) results revealed the existence of superoxide anion radicals (˙O2−) and hydroxyl radicals (˙OH) in the nanoceria suspension without additional hydrogen peroxide (H2O2). A reasonable origin of the oxidizing ability of nanoceria was hypothesized: the adsorbed ˙O2− on the nanoceria surface can dismutate to H2O2 via the SOD-mimetic activity of nanoceria, and then, the ˙OH are produced through a Fenton-like reaction. This process is inherent and pH-dependent. The regeneration of ˙O2− and persistent production of ˙OH can be realized by including DO in an aqueous solution. Moreover, we found that the Ce4+ in nanoceria could also directly act as an oxidant at low pH values.
1 Introduction
Ceria (CeO2), a rare earth oxide, is widely used in catalysis, mechanical polishing, UV-shielding, solid-oxide fuel cells and other industrial applications.1,2 In recent years, nanoceria have attracted increasing attention in nanomedicine and pharmacology because they are expected to scavenge almost all types of reactive oxygen species (ROS) and thereby protect cells against oxidative damage.3–8 The antioxidant properties of nanoceria are mainly attributable to two catalytic processes: SOD-like activity to catalyse the dismutation of ˙O2− to ordinary molecular oxygen (O2) and H2O2![[thin space (1/6-em)]](https://www.rsc.org/images/entities/char_2009.gif) 4,5,9 and catalase-like activity to decompose H2O2 into water and O2.6,10,11
4,5,9 and catalase-like activity to decompose H2O2 into water and O2.6,10,11
However, the oxidizing ability of nanoceria has also been reported frequently in the literature.12–16 In the presence of an oxidizing agent (e.g., H2O2), nanoceria usually exhibit strong oxidizing ability. For example, many studies have demonstrated that the degradation of organic pollutants could be realized using the nanoceria/H2O2 system, regardless of whether interfacial peroxide species or ˙OH radicals were involved in the oxidation.16,17 Interestingly, some recent studies have suggested that nanoceria may exhibit oxidative capabilities even in the absence of a strong oxidizing agent. For example, Asati et al.12 reported that nanoceria exhibited a unique oxidase-like activity at acidic pH values, quickly oxidizing a series of organic substrates in the absence of an oxidizing agent (e.g., H2O2). To identify the oxidizing agent, Gao and co-workers13 thoroughly investigated the oxidation of an organic dye in the presence of nanoceria. They suggested that instead of acting as an oxidase mimic, the nanoceria functioned as a nanoparticulate oxidizing agent under acidic conditions. Although efforts have been made to study and apply the oxidizing ability of nanoceria,12,18–20 the molecular mechanism underlying these oxidation reactions has not been fully elucidated until now.
In fact, nanoceria are known to exhibit versatile catalytic properties (including multi-enzyme-mimetic and Fenton-like catalyst properties), and the role they play may depend on a variety of factors, such as differences in the nanoceria themselves (e.g., synthetic methods, sizes, crystal structures, Ce3+/Ce4+ ratios, morphologies, and surface coatings) and the complexity of the reaction system (e.g., the pH value, and buffer solution).11,20 For example, nanoceria have been found to exert both SOD mimetic and catalase mimetic activities.14,21 In addition, higher surface concentrations of Ce3+ or oxygen vacancies are correlated with greater reactivities toward ˙O2− and reduced reactivities toward H2O2.4–6 More recently, the recycling rates of Ce3+ and Ce4+ were proposed to play key roles in the SOD and catalase-mimetic activities. The negligible SOD-mimetic activity of nanoceria (Ce3+/Ce4+ = 0.036) was greatly increased when external additives were added to accelerate the regeneration of Ce3+.9 A phosphate-dependent shift in the activity of the nanoceria from SOD to catalase-mimetic was also observed in vitro and was attributed to the formation of cerium phosphate blocking redox cycling between Ce3+/Ce4+.21 Palivan and co-workers22 found that the generation and scavenging of ˙OH based nanoceria occurred simultaneously in a typical Fenton reaction system involving Fe2+ and H2O2, although the scavenging effect of the nanoceria was significantly higher than its oxidation effect (Fenton-like reaction). Regarding the controversy over whether nanoceria act directly as an oxidase or as an oxidant in the oxidation of organic dyes, in their recent review, Xu and Qu deduced that under acidic conditions, nanoceria acted as a consumable oxidant, whereas under neutral or basic conditions, they acted as an oxidase because the Ce3+/Ce4+ recycling ability was maintained.11
To explore the origin of the oxidizing ability of nanoceria, herein, organic dye oxidation and H2O2 decomposition were investigated in aqueous suspension of ceria nanorods. Ceria nanorods were employed because rod-like nanoceria have been reported to expose reactive facets and exhibit excellent redox properties compared with traditional irregular ceria nanoparticles.23 The influences of protons, DO, SOD, and catalase on the oxidation of organic dyes were studied in detail. EPR results revealed the existence of ˙O2− and ˙OH in the nanoceria suspension without additional H2O2. In addition, a reasonable origin of the oxidizing ability of nanoceria was hypothesized.
2 Experiments
2.1 Materials
The chemical reagents were analytically pure and obtained from Sinopharm Chemical Reagent Co. Ltd (Shanghai, China). All reagents were used as received without further purification. Cytochrome C from equine heart was purchased from Merck (Darmstadt, Germany). Xanthine oxidase from bovine milk (0.8 U mg−1 protein), hypoxanthine, SOD from Escherichia coli (1100 U mg−1), catalase from bovine liver (3809 U mg−1), horse radish peroxidase (HRP) from horse radish (220–330 U mg−1), 2,2-azinobis(3-ethylbenzothizoline-6-sulfonic acid) (ABTS), and 3,3′,5,5′-tetra-methylbenzidine (TMB) were purchased from Sigma-Aldrich (USA). High-purity 5,5-dimethyl-1-pyrroline-N-oxide (DMPO) was obtained from ENZO Life Sciences International (New York, USA).2.2 Preparation and characterization of nanoceria
Ceria nanorods were prepared by a hydrothermal method with some modifications.23 Ce(NO3)3·6H2O (1.5 g) was dissolved in deionized water, and the appropriate amount of NaOH solution (10%) was rapidly added with stirring at 200 rpm. After approximately 15 min of stirring, the slurry (approximately 40 mL) was placed into a 50 mL Teflon-sealed autoclave and heated at 120 °C for 12 h. The products were washed with deionized water and dried at 60 °C for 12 h. A transmission electron microscope (TEM, FEI Tecnai G2 T20) was used to obtain images of the nanoceria. XRD spectra were obtained using an X-ray diffractometer (Bruker D8 Advance) with Cu-Kα radiation (λ = 1.5406 Å). XPS data were acquired via an X-ray photoelectron spectrometer (VG ESCA lab220i-XL) under Al-Kα radiation. The Ce 3d peak positions were then fitted by Peak Fit (version 4.0) software. The surface area was measured by Micromeritics NOVA 3200e based on N2 adsorption/desorption isotherms collected at 80 °C using the BET method.2.3 EPR measurements
DMPO was used as the spin trap to monitor the potential radicals by EPR spectroscopy. Prior to adding DMPO, the nanoceria suspension was sonicated for 5 min. Then DMPO (100 μL, 150 mM) was mixed with an equal volume of nanoparticle suspension. An aliquot of the mixture described above (20 μL) was transferred to an EPR capillary tube (i.d. ∼1 mm, o.d. 1.55 mm), and the tube was sealed at one end with sealant. The capillary was inserted in a 4 mm EPR tube and then placed in the EPR resonator of the JEOL JES FA200 EPR spectrometer. The spectra were then recorded with the spectrometer operating in the X-band with dual cavities. Ultrapure water was used in the test, and typical parameters were as follows: modulation frequency, 100 kHz; microwave frequency, 9.05 GHz; sweep width, 50 G; EPR microwave power, 3 mW; modulation amplitude, 1 G; time constant, 0.03 s; and sweep time, 4 min, except for the labelled sample.2.4 The role of DO
The oxidation of ABTS (143 μM) catalysed by aqueous suspensions of nanoceria with different level of DO was monitored using a UV-vis spectrophotometer at 734 nm for 30 min at room temperature. The DO of the nanoceria aqueous suspension was varied by purging with N2 (99.999%) for 2.5 h, by purging with N2 for 2.5 h and then with compressed air for 2.5 h, or by exposing the suspension to air for 24, 48, or 72 h. A suspension of nanoceria (10 mg L−1) in 40 mM citrate buffer solution (pH 3.0) served as the control.2.5 SOD and catalase treatments
To test the effects of SOD and catalase on the oxidizing activity of nanoceria, nanoceria (250 mg L−1) was pretreated with SOD (73 U mL−1) for 0.5 h at pH 7.8 and 25 ± 0.5 °C, and nanoceria (2 g L−1) was pretreated with catalase (1900 U mL−1) for 2 h at pH 5.0 and 25 ± 0.5 °C. Then, the pH values were adjusted to 3.0, and ABTS oxidation was initiated.2.6 SOD-mimetic assay
The SOD-mimetic activity was measured as described previously.5,24 Briefly, a competition assay for cytochrome C reduction was utilized to determine the superoxide scavenging activity of the nanoceria. In this assay, hypoxanthine (1.125 mM), xanthine oxidase (10.4 mU mL−1), and cytochrome C (1.05 × 10⁻² mM) were adopted to ensure that the control samples reduced cytochrome C at a rate of 0.025 ± 0.005 absorbance (550 nm) units per minute. The assay was run at room temperature for 5 min in a 96-well plate buffered by Tris–HCl (50 mM, pH 7.5) using a Power Wave XS2 UV-visible spectrophotometer (Bio Tek Co.). For each time point, control samples (no nanoceria) were run in parallel. All samples included 2000 units of catalase to eliminate any residual H2O2 that could have reacted with the nanoceria or cytochrome C.3 Results and discussion
3.1 Characterization of nanoceria
Fig. 1A shows a typical TEM image of the as-obtained ceria nanorods. All the ceria nanoparticles clearly possess a rod-like morphology with lengths of 100–300 nm and diameters of 15–20 nm. The XRD analysis shows that the nanoceria exhibit pure fluorite cubic structures (space group Fm3m (225)) with a lattice constant of α = 5.411 Å (JCPDS 34-0394) (Fig. 1B). XPS was used to characterize the valence state of cerium. The spectra of Ce 3d (Fig. 1C) on the surface of the nanoceria reveal that most of the cerium cations are Ce4+, although Ce3+ species are also present.23,25 The fitted results confirm that the amount of Ce3+ on the surface of the nanoceria is 22.8%. The specific surface area of the nanoceria is 89.9 m2 g−1.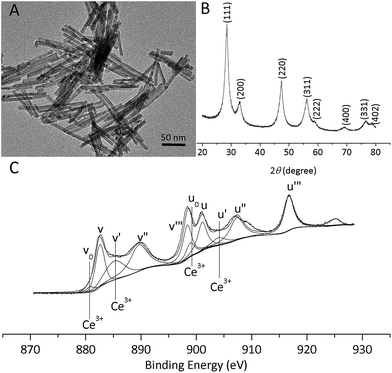 | ||
| Fig. 1 Characterization of nanoceria: (A) TEM images of the nanoceria; (B) XRD spectra of the nanoceria; (C) X-ray photoelectron spectra of Ce 3d. | ||
3.2 The pH-dependent oxidizing ability
To evaluate the oxidizing ability of nanoceria, ABTS was selected as the reactant and it exhibits a colour change from colourless to coloured free radical ion (ABTS+˙) when oxidized in aqueous solution.12,13 As shown in the inset photo of Fig. 2, when ABTS (4 mM) was added to an equal volume of the aqueous suspension of nanoceria (2 g L−1), the colourless ABTS solutions became green within 3 min, indicating that the ABTS had been oxidized. The colour gradually deepened from pH 8.0 to pH 2.5, showing that the oxidizing ability of the nanoceria suspension is pH-dependent and that its oxidizing ability is stronger at lower pH values.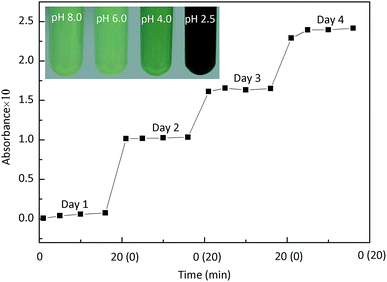 | ||
| Fig. 2 Oxidation of ABTS as a function of time with 71.4 μM ABTS and 10 mg L−1 nanoceria in 40 mM, pH 3.0 citrate buffer solution. The inset photographs show pH-dependent oxidation of ABTS. | ||
The influence of the reaction time on ABTS oxidation was investigated in 40 mM citrate buffer solution (pH 3.0), which minimally influenced ABTS oxidation and would maintain the pH of the suspension. Fig. 2 clearly shows that ABTS+˙ accumulated in a time-dependent manner within 4 d at pH 3.0 and room temperature. In addition, the reaction rate gradually decreased as time passed. In other words, the oxidation reaction did not reach completion shortly after the addition of the nanoceria, as reported by Gao and co-workers;13 this behaviour also differs from that of the HRP catalytic reaction, which has a fixed reaction rate. Thus, we speculate that another reactant is involved in ABTS oxidation and likely controls the reaction rate because excess nanoceria and ABTS were present. This additional reactant may be DO with a fixed proton level.
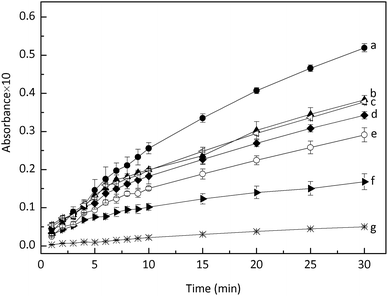
Thus, the effect of DO on ABTS oxidation was investigated. First, the nanoceria suspension was deoxygenized by purging with ultrapure N2 for 2.5 h and then used for ABTS oxidation. Compared with the control sample (line a in Fig. 3), ABTS oxidation was noticeably inhibited, and this inhibition became increasingly obvious as the reaction time increased (line f in Fig. 3). Subsequently, the DO level of the deoxygenized nanoceria suspension was recovered by purging with compressed air for 2.5 h or exposing the suspension to air for 24–72 h. Fig. 3 (lines b, c, d, and e) shows that the oxidizing ability of the deoxygenized nanoceria suspension was partly recovered by increasing the DO level. During all of the treatments, the pH values of the nanoceria suspensions were carefully controlled and the influence of pH on the ABTS oxidation could be ignored. These results suggest that DO influences ABTS oxidation. However, we observed that the oxygen concentration of the nanoceria suspension drastically decreased from ∼8.0 ppm to ∼0.4 ppm during N2 purging (2.5 h),13 whereas the ABTS+˙ production did not show a corresponding degree of inhibition (lines a and f in Fig. 3). Moreover, the recovered ABTS+˙ production was increased as post-treatment time prolonged (lines b, c, d, and e in Fig. 3). Thus, although DO is involved, it does not directly participate in ABTS oxidation.
Two mechanisms of organic dye oxidations in the presence of nanoceria have been reported. One suggests that nanoceria exhibit pH-dependent oxidase-like activity because the observed oxidation kinetics were in good agreement with the Michaelis–Menten model.12 However, in contrast to the obvious faint colour observed at pH 8.0 within 3 min (Fig. 2 inset photo), those authors were unable to observe colour development at pH 7.0, even after incubation overnight. The other mechanism was reported by Gao and co-workers, who excluded DO, citrate, and protons as electron acceptors and instead focused on dissolved nanoceria.13 Those authors suggested that nanoceria functioned as an oxidizing agent rather than as an oxidase-like catalyst. They also reported that the oxidation reaction reached completion quickly and that DO had almost no effect on the oxidation, which is significantly different from our findings. Thus, we speculate that another mechanism may be responsible for our observations.
3.3 Spin trapping by DMPO
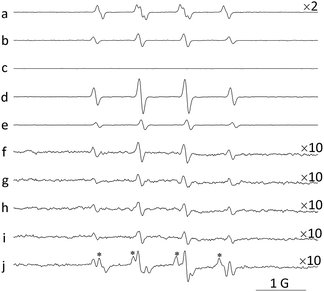
To identify the potential oxidant involved in the reaction, EPR was introduced in this work. When nanoceria were dispersed in pure dimethyl sulfoxide (DMSO) solvent, DMPO–O2− was detected (Fig. 4a). This implies ˙O2− species exist on the surface of the nanoceria. The existence of ˙O2− adsorbed on the nanoceria surface have been reported in many papers, and the production of ˙O2− occurs via electron transfer between adsorbed molecular oxygen and oxygen vacancies or low-coordinated Ce3+.26–28 When nanoceria were dispersed in water, only the signal typical of DMPO–OH adducts was detected, and the signal intensity increased as the nanoceria concentration increased (Fig. 4d–f). However, the detection of DMPO–OH adducts does not necessarily mean that ˙OH has been trapped. According to the literature, in this system, three possible pathways can lead to the formation of DMPO–OH adducts: (1) ˙OH scavenging by DMPO, (2) the nucleophilic addition of water to DMPO catalysed by metal ions,29,30 and (3) ˙O2− scavenging to produce the spin adduct DMPO–OOH, which is unstable and decomposes to DMPO–OH adduct;31–33 the latter two mechanisms are unrelated to ˙OH. Thus, the production of the DMPO–OH adduct should be carefully analysed.Regarding the ˙O2− adduct of DMPO, the pH value of the aqueous solution is an important factor because ˙O2− will hydrolyse to form HOO˙ under acidic conditions:34
| ˙O2− + H+ → HOO˙ | (1) |
The reaction of DMPO with HOO˙ predominates below pH 7.7, while that with ˙O2− predominates above pH 7.7.35 Fig. 4f–h show the effect of the pH value on the EPR signal. Only the signal typical of DMPO–OH was detected from pH 3.0 to pH 10.0; no signal indicating DMPO–OOH or DMPO–O2− was observed. The strongest DMPO–OH signal intensity was obtained at pH 3.0, and this signal declined as the pH value increased. However, a strong signal of DMPO–OOH was detected and the signal intensity of DMPO–OH was sharply enhanced at pH 7.5 after the addition of an external source of ˙O2− (hypoxanthine/xanthine oxidase) to the nanoceria suspension (Fig. 4j). Therefore, high levels of ˙O2− could be trapped by DMPO and result in the formation of the DMPO–OOH adduct at pH 7.5 and the conversion of a portion of the DMPO–OOH into DMPO–OH adduct. Therefore, the failure to detect ˙O2− in the aqueous suspensions of nanoceria may be attributable to the low concentration of ˙O2− or the fast dismutation of ˙O2−.36,37 In any case, it can be concluded that the contribution of ˙O2− to the EPR signal intensity of DMPO–OH is minimal from pH 3.0 to pH 10.0. In fact, differing opinions regarding the mechanism of the conversion of DMPO–OOH into DMPO–OH exist.31–33 For example, Shi et al.33 concluded that DMPO–OOH does not readily decay to its hydroxyl adduct. Additionally, Finkelstein and co-workers31 reported that only 3% of DMPO–OOH would decompose to DMPO–OH.
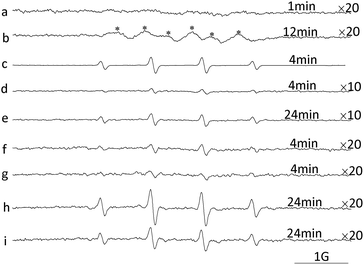
It has been reported that CeIV is able to catalyse the non-radical nucleophilic reaction of water with DMPO.29 Thus, two independent tests were performed to determine whether nanoceria can catalyse nucleophilic-type reactions. First, DMPO was incubated with nanoceria in pure methanol (Fig. 5a and b). After 12 min, a strong EPR signal characteristic of DMPO–OMe was readily detected with αHβ = 7.87 G, and αN = 13.78 G (Fig. 5b), which is consistent with a nucleophilic addition mechanism.29,30 Then, DMPO was incubated with nanoceria in citrate buffer (pH 3.0). The DMPO–OH signal was strongly inhibited (Fig. 5c and d), also confirming the nucleophilic addition of water in this reaction system because the nucleophilic addition of water can be effectively suppressed by citrate buffer.38 However, a very weak DMPO–OH adduct signal was observed after the first 4 min and increased as the incubated time increased (Fig. 5d and e). The new DMPO–OH signal indicates the presence of low levels of ˙OH. In fact, even during the typical Fenton reaction, the non-radical nucleophilic reaction of water with DMPO is a significant pathway for the formation of DMPO–OH adducts.39
Additionally, the low concentration of ˙OH may explain the observation that even though the signal intensity of DMPO–OH was cut off, as reported previously,29,40 DMPO–CH3 cannot be detected when excess DMSO (an ˙OH scavenger) is present in the nanoceria aqueous suspension (Fig. 4b). Dellinger and co-workers observed the same phenomenon when they used ethanol to scavenge the ˙OH produced from H2O2. They found that the scavenging efficiency of ethanol was too low to form detectable secondary radicals when the H2O2 concentration was below 0.25 mM.40
The effect of DO on the signal intensity of DMPO–OH was further investigated and is shown in Fig. 5f–i. Compared with the control (Fig. 5f and h), the DMPO–OH signal of the N2-purged nanoceria suspension was weaker, and the difference became more obvious as the incubation time increased. These trends were in line with the inhibited oxidation of ABTS in the deoxygenized nanoceria suspension (Fig. 3f). The influence of DO on the nanoceria suspension reveals that DO is required to generate ˙OH in the nanoceria aqueous suspension and that higher DO levels improve the oxidizing ability of nanoceria suspensions.
3.4 Mechanism for the generation of ˙OH
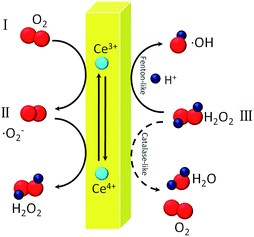
Based on the results mentioned above, one conceivable pathway in Scheme 1 was hypothesized to explain the formation of ˙OH in the nanoceria aqueous suspension: O2 (including gas phase O2 and dissolved O2) is adsorbed on the nanoceria and is reduced by the nanoceria to produce adsorbed ˙O2−; then, the adsorbed ˙O2− dismutate to H2O2; and finally, the H2O2 is converted into ˙OH via a Fenton-like reaction.To verify this scheme, SOD, an efficient ˙O2− scavenger, was added into aqueous suspensions of nanoceria at pH 7.8 (the optimum pH for SOD). After 30 min, the catalytic activity of the pretreated nanoceria was tested at pH 3.0. As shown in Fig. 6A, ABTS oxidation was inhibited by approximately 20%. This result strongly suggests the interconnection between ˙O2− and the oxidizing ability of nanoceria aqueous suspensions.
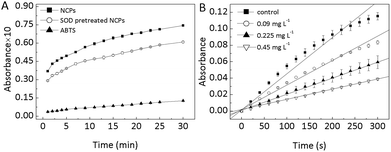 | ||
| Fig. 6 (A) The effect of SOD on the oxidation of ABTS, nanoceria (NCPs) (25 mg L−1), ABTS (467 μM); (B) SOD mimetic activity of nanoceria with different concentration. | ||
The SOD-mimetic activity of nanoceria is shown in Fig. 6B. The reduction of cytochrome C induced by ˙O2− was obviously inhibited by nanoceria, and this inhibition was dose-dependent. These results demonstrate that nanoceria are able to remove ˙O2− and exhibit dose-dependent SOD-mimetic activity.4,5
The HRP method was used to test the level of H2O2 (formed by ˙O2− dismutation) in the filtrate of nanoceria suspensions.41 Unfortunately, no observable colour change occurred after the filtrate was incubated with HRP and TMB for 15 min at 25 ± 0.5 °C, indicating that no H2O2 was present. However, it should be noted that the failure to detect H2O2 cannot exclude the formation of H2O2 because the H2O2 concentration in the filtrate may be lower than the detection limit (10 μM) of the HRP-based method. Additionally, H2O2 may be absorbed on the surface of the nanoceria.17,42,43 Indeed, several investigations have confirmed the existence of H2O2 in nanoceria suspensions.4,44 For example, Xia et al.44 reported that 8 nm CeO2 (10 μg mL−1) could produce 1.138 μM H2O2 after incubation at 22 °C based on cyclic voltammetry. An increase in the H2O2 level was also observed when external ˙O2− was added into the nanoceria suspension.4 Therefore, to verify the existence of H2O2, catalase was introduced. As shown in Fig. S2,† ABTS oxidation was inhibited when the nanoceria were pretreated with catalase. These results indicate that H2O2 was indeed produced in the nanoceria suspension and participated in the catalytic oxidation process. However, the low concentration of H2O2 could not directly oxidize ABTS within 3 min (Fig. S1B†).
The ability of nanoceria to decompose H2O2 was examined by introducing external H2O2. The data show that the decomposition of H2O2 is pH and time-dependent (Fig. S3†). The decomposition rate of H2O2 increased from pH 3.0 to pH 4.0, and then remained constant from pH 4.0 to pH 10.0. In this work, 19.0 mM H2O2 was nearly completely decomposed at neutral pH (0.29 mM remaining) within 150 min at 25 ± 0.5 °C (Fig. S3†). These results demonstrate that nanoceria constitute an efficient catalyst for H2O2 decomposition, as reported previously.10,15,45 For the catalytic reaction, two main mechanisms have been suggested: a catalase-like reaction and a Fenton-like reaction. The intermediate product ˙OH is key for distinguishing between the two catalytic mechanisms.15,22,29 EPR revealed that ˙OH was produced at pH 3.0 (Fig. 5d and e), which means that a Fenton-like reaction occurred. However, our results showed the following: (1) the decomposition rate of H2O2 is higher in neutral or alkaline conditions than at acid pH (Fig. S3†); (2) the production of ˙OH is pH-dependent in the nanoceria/H2O systems and is facilitated by acidic conditions14,46 (Fig. 4); and (3) the oxidizing ability of nanoceria/H2O2 is anticorrelated with the decomposition of H2O2 (Fig. S3 and S4†). These points illustrate that a Fenton-like reaction is not the only way to decompose H2O2; other mechanisms, such as a catalase-like process, may coexist.6,10,11 The Fenton-like reaction occurs preferentially in an acidic environment, while the catalase-like reaction is believed to occur at the neutral or alkaline pH. Therefore, the solution pH may act as a switch to modulate the oxidizing ability of nanoceria. This conclusion is in agreement with nanoceria's observed cytotoxicity toward cancer cells (acidic environment) and lack of activity toward normal cells (neutral environment). Thus, nanoceria have promising applications in cancer therapeutics.14,46
These results together with the influence of DO on the DMPO–OH signal and the oxidizing ability of nanoceria aqueous suspensions indirectly show that ˙OH can be generated via Scheme 1.
3.5 The relationship between ˙OH and the oxidizing ability of nanoceria
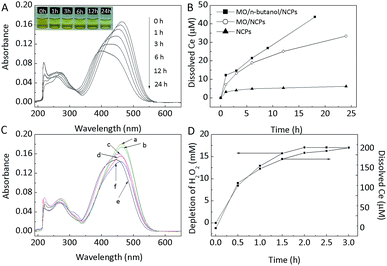
The standard redox potential of ABTS˙+/ABTS is 0.68 V which means that ABTS can be easily oxidized. Therefore, methyl orange (MO), a relatively stable azo dye, was chosen to investigate the relationship between ˙OH and the oxidizing ability of nanoceria.After mixing MO aqueous solution (7.0 mg L−1) with an equal volume of nanoceria suspension (2.0 g L−1) at pH 2.58, MO, which was initial red in colour became colourless, while the nanoparticle surface changes from yellow to orange after 1 h of reaction (Fig. S5A,† inset photographs). In addition, the UV-vis absorption spectra of the supernatant revealed that the dominant peak of MO at 505 nm decreased in intensity and that the peaks at 250–350 nm disappeared completely (Fig. S5A†). However, most MO was adsorbed on the nanoceria and could be completely desorbed at pH 13.0 (Fig. S6†). Thus, to precisely assess the oxidizing ability of nanoceria towards MO, the pH value of reaction system was adjusted from 2.58 to 13.0 at different reaction times; the corresponding colour and UV-vis absorption spectra at pH 13.0 are shown in Fig. 7.
The colour of the MO supernatant was observed to become lighter as the reaction time increased, and the dominant peak of MO (pH 13.0) at 464 nm was observed to decrease as the spectra were blue-shifted (Fig. 7A). Furthermore, the pH value of reaction system increased from 2.58 to 2.71 over 24 h before the pH value was adjusted, indicating that 10.42 ± 0.39 μmol protons was consumed (Fig. S5B†). Compared with the nanoceria aqueous suspension, the amount of consumed protons increased by 28.5 ± 4.8% in the MO/nanoceria system. These results demonstrate that nanoceria suspensions can oxidize MO and that protons are consumed during the oxidation.
Dissolved Ce was also tested, and the results are shown in Fig. 7B. The amount of dissolved Ce increased with the reaction time and reached a maximum value of 33.4 μM at 24 h. However, in the control test (nanoceria without MO), the dissolved Ce was only 4.9 μM at 6 h and then increased by 1.4 μM in the last 18 h. These results indicate that the oxidation of MO can greatly accelerate the dissolution of nanoceria at pH 2.58. It is clear that, in our work, organic dyes such as ABTS and MO were preferentially oxidized by ˙OH if this species was present. Thus, excess n-butanol (300 mM) was added to scavenge ˙OH in the nanoceria/MO system (line c in Fig. 7C). MO oxidation was significantly inhibited under this condition, demonstrating that ˙OH plays a key role in oxidizing the dye. The reduced DMPO–OH EPR signal observed after adding n-butanol to the nanoceria aqueous suspension also confirmed this role (Fig. 4i). However, the expected complete inhibition was not observed, unlike as reported for Fe3O4 or Fe3O4–CeO2 nanoparticles,47,48 which indicates that another oxidant, such as H2O2 or Ce4+, participated in the oxidation reaction in the nanoceria/MO system. Moreover, adding n-butanol (300 mM) was observed to increase the amount of dissolved nanoceria (Fig. 7B).
To verify the possibility that H2O2 was the oxidant, 500 μM H2O2, which greatly exceeded the highest possible level in the nanoceria aqueous suspension, was added to oxidize MO. The UV-vis spectra of MO did not change after this addition, excluding the possibility of H2O2 being the oxidant (line b in Fig. 7C). Then, Ce was studied. For this purpose, CeIV compound (Ce(SO4)2) and the CeIII compound (CeCl3) (13.2–18.9 μM) were added to separate MO solutions. UV-vis spectra of the MO were then collected and are shown in Fig. 7C and S7.† Ce3+ was unable to oxidize MO, but Ce4+ showed efficient oxidation at pH 2.58. These results strongly suggest that nanoceria can oxidize MO at pH 2.58. Therefore, MO oxidation in nanoceria aqueous suspensions is attributed to the synergistic effect of ˙OH and Ce4+ in nanoceria, and the oxidative activity of the latter cannot be inhibited by the addition of n-butanol, an ˙OH scavenger.
Furthermore, we noted that the dissolution of nanoceria should be enhanced by introducing MO or n-butanol at pH 2.58 (Fig. 7B), and that, compared with MO, n-butanol improved this dissolution. These results allow us to speculate that the addition of reductive material (or ˙OH scavengers) should enhance the dissolution of nanoceria at low pH, and that the use of material that is relatively easy to be oxidized (or that is more adept at trapping ˙OH) will increase the amount of dissolved nanoceria. To verify this speculation, the effect of H2O2 (20 mM) on the dissolution of nanoceria was studied, as shown in Fig. 7D. The level of dissolved Ce was observed to increase to 113 μM after only 0.5 h, and the molar ratio of dissolved Ce to decomposed H2O2 was 1![[thin space (1/6-em)]](https://www.rsc.org/images/entities/char_2009.gif) :
:![[thin space (1/6-em)]](https://www.rsc.org/images/entities/char_2009.gif) 86 ± 6 throughout the reaction time. Therefore, nanoceria catalyse H2O2 decomposition. The negligible oxidant ability of the MO/nanoceria system's supernatant indicates that Ce3+ was dominant among the dissolved Ce cations (Fig. S7†). The molecular mechanism underlying the dissolution of Ce is unclear, and more work should be carried out to better understand this issue. However, we speculate that the addition of reductive materials to nanoceria aqueous suspensions will break the recycling balance of Ce3+ and Ce4+ and cause Ce3+ to accumulate, which would dissolve at low pH. Accordingly, Ce3+ on the nanoceria surface is responsible for the nanoceria's toxicity, which increases ROS and causes membrane damage.49,50 Therefore, a net reduction in the nanoceria resulting from the organic materials or H2O2 in cells may be one explanation for the observed toxicity.
86 ± 6 throughout the reaction time. Therefore, nanoceria catalyse H2O2 decomposition. The negligible oxidant ability of the MO/nanoceria system's supernatant indicates that Ce3+ was dominant among the dissolved Ce cations (Fig. S7†). The molecular mechanism underlying the dissolution of Ce is unclear, and more work should be carried out to better understand this issue. However, we speculate that the addition of reductive materials to nanoceria aqueous suspensions will break the recycling balance of Ce3+ and Ce4+ and cause Ce3+ to accumulate, which would dissolve at low pH. Accordingly, Ce3+ on the nanoceria surface is responsible for the nanoceria's toxicity, which increases ROS and causes membrane damage.49,50 Therefore, a net reduction in the nanoceria resulting from the organic materials or H2O2 in cells may be one explanation for the observed toxicity.
4 Conclusions
In conclusion, EPR revealed the existence of ˙O2− and ˙OH in nanoceria suspension without additional H2O2. The strong oxidizing ability of nanoceria was verified, and a reasonable origin of the oxidizing ability of nanoceria was hypothesized: the adsorbed ˙O2− on the nanoceria surface dismutates to H2O2 via nanoceria's SOD-mimetic activity, and then, the H2O2 is converted into ˙OH via a Fenton-like reaction. This process is inherent and pH-dependent. The regeneration of ˙O2− and persistent production of ˙OH can be realized by providing DO. Moreover, the oxidative mechanism of nanoceria is more complicated than previously thought and involves the synergistic effect of ˙OH and Ce4+ in the nanoceria at low pH values.Acknowledgements
The authors are grateful for the financial support provided by the National Natural Science Foundation of China (Grant No. 21476251).References
- S. Chen, L. Luo, Z. Jiang and W. Huang, ACS Catal., 2015, 5, 1653 CrossRef CAS.
- M. Yashima, Catal. Today, 2015, 253, 3 CrossRef CAS.
- J. Chen, S. Patil, S. Seal and J. F. McGinnis, Nat. Nanotechnol., 2006, 1, 142 CrossRef CAS PubMed.
- C. Korsvik, S. Patil, S. Seal and W. T. Self, Chem. Commun., 2007, 1056 RSC.
- E. G. Heckert, A. S. Karakoti, S. Seal and W. T. Self, Biomaterials, 2008, 29, 2705 CrossRef CAS PubMed.
- T. Pirmohamed, J. M. Dowding, S. Singh, B. Wasserman, E. Heckert, A. S. Karakoti, J. E. S. King, S. Seal and W. T. Self, Chem. Commun., 2010, 46, 2736 RSC.
- X. Cai, S. A. Sezate, S. Seal and J. F. McGinnis, Biomaterials, 2012, 33, 8771 CrossRef CAS PubMed.
- C. K. Kim, T. Kim, I. Y. Choi, M. Soh, D. Kim, Y. J. Kim, H. Jang, H. S. Yang, J. Y. Kim, H. K. Park, S. P. Park, S. Park, T. Yu, B. W. Yoon, S. H. Lee and T. Hyeon, Angew. Chem., Int. Ed., 2012, 51, 11039 CrossRef CAS PubMed.
- Y. Li, X. He, J. J. Yin, Y. Ma, P. Zhang, J. Li, Y. Ding, J. Zhang, Y. Zhao, Z. Chai and Z. Zhang, Angew. Chem., Int. Ed., 2015, 54, 1832 CrossRef CAS PubMed.
- I. Celardo, J. Z. Pedersen, E. Traversa and L. Ghibelli, Nanoscale, 2011, 3, 1411 RSC.
- C. Xu and X. Qu, NPG Asia Mater., 2014, 6, e90 CrossRef CAS.
- A. Asati, S. Santra, C. Kaittanis, S. Nath and J. M. Perez, Angew. Chem., Int. Ed., 2009, 48, 2308 CrossRef CAS PubMed.
- Y. Peng, X. Chen, G. Yi and Z. Gao, Chem. Commun., 2011, 47, 2916 RSC.
- L. Alili, M. Sack, A. S. Karakoti, S. Teuber, K. Puschmann, S. M. Hirst, C. M. Reilly, K. Zanger, W. Stahl, S. Das, S. Seal and P. Brenneisen, Biomaterials, 2011, 32, 2918 CrossRef CAS PubMed.
- S. S. Lee, W. Song, M. Cho, H. L. Puppala, N. Phuc, H. Zhu, L. Segatori and V. L. Colvin, ACS Nano, 2013, 7, 9693 CrossRef CAS PubMed.
- F. Chen, X. Shen, Y. Wang and J. Zhang, Appl. Catal., B, 2012, 121, 223 CrossRef.
- P. Ji, L. Wang, F. Chen and J. Zhang, ChemCatChem, 2010, 2, 1552 CrossRef CAS.
- W. Lin, Y. W. Huang, X. D. Zhou and Y. Ma, Int. J. Toxicol., 2006, 25, 451 CrossRef CAS PubMed.
- A. Asati, C. Kaittanis, S. Santra and J. M. Perez, Anal. Chem., 2011, 83, 2547 CrossRef CAS PubMed.
- E. Grulke, K. Reed, M. Beck, X. Huang, A. Cormack and S. Seal, Environ. Sci.: Nano, 2014, 1, 429 RSC.
- S. Singh, T. Dosani, A. S. Karakoti, A. Kumar, S. Seal and W. T. Self, Biomaterials, 2011, 32, 6745 CrossRef CAS PubMed.
- M. Spulber, P. Baumann, J. Liu and C. G. Palivan, Nanoscale, 2015, 7, 1411 RSC.
- K. B. Zhou, X. Wang, X. M. Sun, Q. Peng and Y. D. Li, J. Catal., 2005, 229, 206 CrossRef CAS.
- J. M. McCord and I. Fridovich, J. Biol. Chem., 1969, 244, 6049 CAS.
- M. Romeo, K. Bak, J. Elfallah, F. Lenormand and L. Hilaire, Surf. Interface Anal., 1993, 20, 508 CrossRef CAS.
- G. Preda, A. Migani, K. M. Neyman, S. T. Bromley, F. Illas and G. Pacchioni, J. Phys. Chem. C, 2011, 115, 5817 CAS.
- A. Aboukais, E. A. Zhilinskaya, J. F. Lamonier and I. N. Filimonov, Colloids Surf., A, 2005, 260, 199 CrossRef CAS.
- J. Soria, A. Martinezarias and J. C. Conesa, J. Chem. Soc., Faraday Trans., 1995, 91, 1669 RSC.
- M. Culcasi, L. Benameur, A. Mercier, C. Lucchesi, H. Rahmouni, A. Asteian, G. Casano, A. Botta, H. Kovacic and S. Pietri, Chem.-Biol. Interact., 2012, 199, 161 CrossRef CAS PubMed.
- S. Dikalov, P. Tordo, A. Motten and R. P. Mason, Free Radical Res., 2003, 37, 705 CrossRef CAS PubMed.
- E. Finkelstein, G. M. Rosen and E. J. Rauckman, Mol. Pharmacol., 1982, 21, 262 CAS.
- G. Bacic, I. Spasojevic, B. Secerov and M. Mojovic, Spectrochim. Acta, Part A, 2008, 69, 1354 CrossRef PubMed.
- H. L. Shi, G. Timmins, M. Monske, A. Burdick, B. Kalyanaraman, Y. Liu, J. L. Clement, S. Burchiel and K. J. Liu, Arch. Biochem. Biophys., 2005, 437, 59 CrossRef CAS PubMed.
- D. Behar, G. Czapski, J. Rabani, L. M. Dorfman and H. A. Schwarz, J. Phys. Chem., 1970, 74, 3209 CrossRef CAS.
- E. Finkelstein, G. M. Rosen and E. J. Rauckman, Arch. Biochem. Biophys., 1980, 200, 1 CrossRef CAS PubMed.
- F. A. Villamena, S. Xia, J. K. Merle, R. Lauricella, B. Tuccio, C. M. Hadad and J. L. Zweier, J. Am. Chem. Soc., 2007, 129, 8177 CrossRef CAS PubMed.
- L. Khachatryan, E. Vejerano, S. Lomnicki and B. Dellinger, Environ. Sci. Technol., 2011, 45, 8559 CrossRef CAS PubMed.
- P. M. Hanna, W. Chamulitrat and R. P. Mason, Arch. Biochem. Biophys., 1992, 296, 640 CrossRef CAS PubMed.
- K. Makino, T. Hagiwara, A. Hagi, M. Nishi and A. Murakami, Biochem. Biophys. Res. Commun., 1990, 172, 1073 CrossRef CAS PubMed.
- L. Khachatryan and B. Dellinger, Environ. Sci. Technol., 2011, 45, 9232 CrossRef CAS PubMed.
- S. G. Rhee, T. S. Chang, W. Jeong and D. Kang, Mol. Cells, 2010, 29, 539 CrossRef CAS PubMed.
- H. Zhao, Y. Dong, P. Jiang, G. Wang and J. Zhang, ACS Appl. Mater. Interfaces, 2015, 7, 6451 CAS.
- W. Cai, F. Chen, X. Shen, L. Chen and J. Zhang, Appl. Catal., B, 2010, 101, 160 CrossRef CAS.
- T. Xia, M. Kovochich, M. Liong, L. Maedler, B. Gilbert, H. Shi, J. I. Yeh, J. I. Zink and A. E. Nel, ACS Nano, 2008, 2, 2121 CrossRef CAS PubMed.
- M. Das, S. Patil, N. Bhargava, J. F. Kang, L. M. Riedel, S. Seal and J. J. Hickman, Biomaterials, 2007, 28, 1918 CrossRef CAS PubMed.
- J. M. Perez, A. Asati, S. Nath and C. Kaittanis, Small, 2008, 4, 552 CrossRef CAS.
- L. Xu and J. Wang, Environ. Sci. Technol., 2012, 46, 10145 CAS.
- L. J. Xu and J. L. Wang, Appl. Catal., B, 2012, 123, 117 CrossRef.
- T. Naganuma and E. Traversa, Biomaterials, 2014, 35, 4441 CrossRef CAS PubMed.
- C. J. Szymanski, P. Munusamy, C. Mihai, Y. M. Xie, D. H. Hu, M. K. Gilles, T. Tyliszczak, S. Thevuthasan, D. R. Baer and G. Orr, Biomaterials, 2015, 62, 147 CrossRef CAS PubMed.
Footnote |
| † Electronic supplementary information (ESI) available. See DOI: 10.1039/c5ra20700b |
| This journal is © The Royal Society of Chemistry 2015 |

