DOI:
10.1039/C5RA20631F
(Paper)
RSC Adv., 2015,
5, 98709-98716
Structure, luminescence property and abnormal energy transfer behavior of color-adjustable Ca3Hf2SiAl2O12:Ce3+,Mn2+ phosphors
Received
6th October 2015
, Accepted 3rd November 2015
First published on 9th November 2015
Abstract
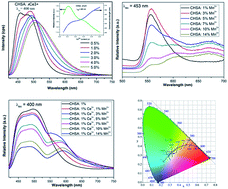
A series of color-adjustable phosphors Ca3Hf2SiAl2O12:Ce3+,Mn2+ were synthesized through a high temperature solid-state method. Ca3Hf2SiAl2O12 belongs to body-centered cubic crystal system and Ia
d (230) space-group. It was found that three different cation sites in the Ca3Hf2SiAl2O12 phase were occupied evenly by Ce3+ and Mn2+ ions. Different situations of Mn2+ occupying sites and energy transfer from Ce3+ to Mn2+ can appear with different Mn2+ content and the critical distance was calculated to be Rc1 = 10.8 Å, Rc2 = 10.1 Å and Rc3 = 12.6 Å after calculation of energy transfer from the Ce3+ to Mn2+ by using the concentration quenching method. Ca3Hf2SiAl2O12:Ce3+,Mn2+ phosphors exhibited a broad excitation band ranging from 300 to 450 nm and two broad asymmetric emission bands upon 400 nm excitation. The emission colors of Ca3Hf2SiAl2O12:Ce3+,Mn2+ could be tuned from blue-green (0.2303, 0.3265) to white (0.3350, 0.3388) by changing the ratio of Ce3+/Mn2+. The correlated color temperature can be adjusted from 12
763 K to 5379 K. It indicated that Ca3Hf2SiAl2O12:Ce3+,Mn2+ possesses potential applications in white-LEDs.
1. Introduction
Nowadays, white light emitting diodes (W-LEDs) have attracted considerable attention and been used in many areas1 for their various advantages such as small volume, high efficiency, long lifetime, energy saving and environment-friendly.2,3 The initial method to get W-LED lamp is consisting three triple LED chips for red, green and blue.4 Though it is easy to fabricate, it has different thermal stability, different drive voltage, different degradation and expensive for different LED chips,5–7 which restrains its application. Another feasible scheme for W-LED generation is using blue or ultraviolet chips combining with some phosphors which can be excited by them. For instance, YAG:Ce3+ yellow phosphor excited by a blue InGaN chip can generate white light by yellow emission from the phosphor and blue light from the chip. Though it has been commercialization and widely used, it cannot satisfy the optimum requirements. Different degradation for blue chip and phosphor leads to chromatic aberration. Lack of red light component causes high correlated color temperature (7765 K) and poor color rendering index which restricts its more broad applications. In order to obtain warm white light and high color rendering index, red phosphor is introduced to that system.8–12 In addition to this method, another kind of W-LEDs can be fabricated by combing of the GaN-based blue chip with green and red phosphors or via coupling ultraviolet (UV) LED (350–420 nm) with blue, green and red phosphors.13–15 As compared to YAG:Ce3+ yellow phosphor excited by a blue InGaN chip, this type of W-LEDs has low correlated color temperature and high color rendering index (Ra > 90), but low luminous efficiency due to the re-absorption between phosphors. Recently, more efforts to get satisfied warm white light have been focused on by using single-component phosphor which can emit white light doped with rare earth ions.16–23 The single-component phosphor is more stable, more efficient and no phase separation, which can avoid the above mentioned problems. The single-composition white-light phosphor can be realized by co-doping a sensitizer and an activator such as Ce3+ and Mn2+ into the same host. It is accepted that the Ce3+ ion with the 4f configuration in solids shows efficient broad band luminescence due to the 4f–5d parity allowed electric dipole transition. Attributing to the extended radial wavefunctions of the 5d state, the Ce3+ ion usually has a large Stokes shift and its emission can be shifted from UV to the visible region of the electromagnetic spectrum, which is dependent on the host lattice. Moreover, the Ce3+ ion also acts as a good sensitizer, transferring a part of its energy to the activator ion. Being considered as a candidate of the activator, the transition-metal ion Mn2+ can give a broad emission band in the visible range, and the emission color of Mn2+ can vary from green to red, which is strongly affected by the crystal field of the host materials. Owing to the forbidden 4T1–6A1 transition of Mn2+ ion, the emission intensity of a Mn2+-ion singly doped phosphor is low under UV excitation. Based on the above-mentioned considerations, it is necessary to enhance the emission intensity of Mn2+-doped materials by introducing an efficient sensitizer Ce3+. More importantly, white light can be obtained by co-doping Ce3+ and Mn2+ ions under effective resonance-type energy transfer in a single phase host. Therefore, a single-phase white-light-emitting phosphor based on the mechanism of energy transfer has been realized by doping the sensitizers and activators in some host lattices such as Ca3Sc2Si3O12:Ce3+,Mn2+,24 Ba2Li2Si2O7:Ce3+,Mn2+,25 Ca2Gd8Si6O26:Ce3+,Mn2+,26 Ca3YGa3B4O15:Ce3+,Mn2+.27
A new species of the garnet super-group Ca3(Hf, Sn, Zr, Ti)2SiAl2O12 was discovered in metasomatically altered carbonate-silicate xenoliths in ignimbrites of the upper Chegem Caldera, Northern Caucasus, Kabardino-Balkaria, Russia at 2013. It is said that Hf-garnet obtains higher in the conduction band, above 4.0 eV, which may obtain NUV excitation. We previously reported the discovery and crystal structure of Ca3Hf2SiAl2O12 (hereafter referred to as CHSA) and explored the potential of its Ce3+-activated derivative for use as a phosphor in LED. CHSA:Ce3+ emits a strong blue-green light under excitation from the UV to near-UV. Here, we reported Ce3+,Mn2+ co-doped CHSA and studied its energy transfer situation. According to changing different Mn2+ contents, we realized the adjustable CIE coordinates and color temperature.
2. Experimental section
CaCO3 (99.9%), HfO2 (99.99%), Al(OH)3 (AR), H2SiO3 (AR), CeO2 (99.99%) and MnCO3 (99.9%) as the raw materials are stoichiometric and 5 wt% H3BO3 as the flux is also used in the synthesis process. Aluminum oxide crucibles (10 mm × 10 mm) and porcelain boat are utensils for sintering.
2.1 Synthesis
A series of Ca3Hf2SiAl2O12:Ce3+,Mn2+ samples are synthesized by two-step traditional high temperature solid-stated reaction. The relative amounts of materials are calculated and then are weighed by electronic balance accurate to 4 decimal places. All the raw materials and the flux are put into agate mortar with 8 mL ethanol added in it at the same time. Grind the mixture for 30 min until they are evenly blended and homogeneous. After the mixture dry, transfer the mixture into aluminum oxide crucibles (10 mm × 10 mm) and pre-fire at 800 °C for 2 h under air atmosphere, then, calcine them at 1480 °C for 5 h under flowing 95% N2–5% H2 atmosphere in the horizontal tube furnace. When they are cooled with 5 °C per min speed to room temperature, grind them to powders, yielding the resulting phosphor powder.
2.2 Characterization
The phase formation and crystal structure were analyzed by the X-ray powder diffraction (XRD) (D2 PHASER X-ray diffractometer, Germany) with graphite monochromator using Cu Kα radiation (λ = 1.54056 A), operating at 30 kV and 15 mA. The investigation range is 10° to 80° with scanning speed of 15° 2θ min−1 for the series Ca3Hf2SiAl2O12:Mn2+ samples. The photoluminescence (PL) and photoluminescence excitation (PLE) spectra of the samples are measured by a Fluorlog-3 spectrofluorometer equipped with 450 W xenon lamps (Horiba Jobin Yvon). The temperature-dependence luminescence properties are measured on the same spectrophotometer, which is combined with a self-made heating attachment and a computer-controlled electric furnace from room temperature (25 °C) to 250 °C with a heating rate of 100 °C min−1 and a holding time of 5 min for each temperature point. The luminescence decay curves were obtained by FLS-920T fluorescence spectrophotometer as well. All the testes are carried out at room temperature.
3. Results and discussion
Ca3Hf2SiAl2O12 belongs to body-centered cubic crystal system and Ia
d (230) space-group which is shown in Fig. 1 observing from [100] crystal orientation. There are three sites for cations in this crystal structure and only one lattice site for Hf, Al/Si and Ca, respectively. In the present work, there is valency imposed double site-occupancy (R4+, R3+) at the Al/Si tetrahedron site,28,29 which Al and Si atoms are in substitutional disorder, and the atomic position and anisotropic displacement parameters of Al and Si are constrained to be identical at Al/Si sites in the initial refinements. The yellow octahedrons (six coordination), [HfO8]4− is fully occupied by Hf, while the blue tetrahedrons site, [AlO4]5−, [SiO4]4− is occupied by 2/3 Al and 1/3 Si. The green spheres located in the space between the polyhedrons represent the Ca site. The anion sites (oxygen sites) are located at the shared corners of the octahedra and tetrahedra. According to ions radius analysis, the radius of Ce3+ in eight coordinated is 1.283 Å which is close to Ca2+ 1.26 Å. It may provide a proof that Ce3+ will occupy Ca2+ site in this crystal structure. In the same time, the radius of Al3+/Si4+ in tetrahedron site is 0.53/0.40 Å and the radius of Hf4+ in octahedrons (six coordination) is 0.85 Å. Generally, the radius of Mn2+ is larger than Al3+/Si4+ and small but close to Hf4+, while smaller than Ca2+. It is considered that Mn2+ may occupy every cation site in this structure.
 |
| Fig. 1 The structure of Ca3Hf2SiAl2O12 and the coordination of Ca, Hf and Al/Si. | |
XRD patterns of the as-prepared CHSA:y%Mn2+ (1 ≤ y ≤ 14) phosphors were collected to verify the phase purity. As given in Fig. 2, it can be seen that all the diffraction peaks of the samples can be indexed to the corresponding calculated data basically, suggesting that CHSA:y%Mn2+ with different Mn2+ contents can be formed in the single-phased structure. From the right image, the peak shift of series XRD patterns, we can see that the peaks shift to smaller angle firstly with increasing Mn2+ content, and then shift to larger angle. It could provide a proof that Mn2+ can occupy not only one site. According to analysis above, in the low Mn2+ content, Mn2+ could occupy Al3+/Si4+ tetrahedrons site. The radius of Mn2+ in tetrahedrons is 0.80 Å, larger than Al3+/Si4+. According to2d
sin
θ = nλ, with the interplanar spacing (d) increasing, the sin
θ will decrease and lead to the XRD peaks shift to smaller angle. With the increasing of Mn2+ content, Mn2+ will occupy Hf4+ or Ca2+ site. The radius of Mn2+ in six or eight coordination is smaller than Hf4+ or Ca2+. When Mn2+ substitutes Hf4+ or Ca2+, the interplanar spacing (d) will decrease and lead to XRD peaks shift to larger angle. The phenomenon of peaks shift could be as evidence for Mn2+ different occupying situation and it indicates that Mn2+ could substitute Al3+/Si4+ site. However, it cannot distinguish which site of Hf4+ and Ca2+ will be occupied by Mn2+. Another situation is that Mn2+ may substitute both Hf4+ and Ca2+. Because of the radius of Hf4+ and Ca2+ are both larger than Mn2+. Occupying one site of Hf4+ and Ca2+ or both sites of them will both lead to peak shift to larger angle.
 |
| Fig. 2 XRD patterns of series Ca3Hf2SiAl2O12:x%Mn2+ and calculated data (left image); peak shift of series XRD patterns (right image). | |
Fig. 3 presents the excitation and emission spectra of single doped and co-doped Ca3Hf2SiAl2O12 phosphors. As shown in Fig. 3a demonstrates the PLE and PL spectra of CHSA:1%Mn2+. The excitation spectrum consists of several bands centering at 362 nm, 410 nm, 455 nm and 480 nm, corresponding to the transitions of Mn2+ ion from ground level 6A1(6S) to 4E(4D), 4T2(4D), [4A1(4G), 4E(4G)], and 4T1(4G) levels, respectively. The broad emission band from 525 to 600 nm centered at 556 nm ascribed to the spin-forbidden 4T1(4G)–6A1(6S) transition of the Mn2+ ions.30 The PLE and PL spectra of CHSA:1%Ce3+ sample are shown in Fig. 3b. The PLE spectrum monitored by 457 nm exhibits two distinct excitation bands at 325 and 400 nm, which could be ascribed to the electronic transitions from the ground state to the different crystal field splitting bands of excited 5d states of Ce3+. Upon 400 nm excitation, the PL spectrum consists of an asymmetric broad emission band from 450 to 550 nm with a maximum at 455 nm which is assigned to the 5d–4f transitions of Ce3+. It is well-known that the typical emission of Ce3+ should consist of a double band in view of the transitions of Ce3+ ions from 5d state to the 2F5/2 and 2F7/2 ground states, and the theoretical energy difference of this splitting between 2F5/2 and 2F7/2 level is about 2000 cm.31 As seen in Fig. 3a and b the significant spectral overlap occurs between the emission band of Ce3+ and the excitation band of Mn2+, which indicates the possible resonance type energy transfer from the Ce3+ to Mn2+ ions in CHSA matrix. The PLE and PL spectra of CHSA:1%Ce3+, 1%Mn2+ monitored at the emission of Mn2+ (556 nm) with 400 nm excitation are shown in Fig. 3c. Upon excitation at 400 nm, the PL spectrum of CHSA:1%Ce3+,1%Mn2+ phosphor appears not only as a blue-green band of Ce3+ ions also as a green band of the Mn2+ ions.
 |
| Fig. 3 PLE (left) and PL (right) spectra of Ca3Hf2SiAl2O12:Mn2+ (a); Ca3Hf2SiAl2O12:Ce3+ (b); Ca3Hf2SiAl2O12:Ce3+,Mn2+ (c). | |
From Fig. 4, we can see that CHSA:xCe3+ can emit cyan light (450–550 nm) under UV excitation and the emission spectra consist of two apparent asymmetric broad peaks before x = 0.03 which corresponds to the 5d–4f allowed transition of Ce3+, beyond x = 0.03, emission spectra turn to be a broad peak. Additionally, the inset (upper right) of Fig. 4 shows the Ce3+ content dependent emission intensity and peak position. It can be easily seen that the emission intensities have an obvious increasing trend with increasing Ce3+ concentration, and maximizes at x = 0.01, then the emission intensity decreases. The peak position has apparent red shift from 481 to 508 nm about 1105 cm−1. It is well-known that the typical emission of Ce3+ should consist of a double band in view of the transitions of Ce3+ ions from 5d state to the 2F5/2 and 2F7/2 ground states. That's the reason why emission spectra consist of two apparent asymmetric broad peaks, and, with the increasing of Ce3+ content, the energy transfer of intra-Ce3+ becomes to be significant, this kind energy transfer that also leads to red shift and broader of emission and excitation spectra.32
 |
| Fig. 4 PL properties under 400 nm excitation of series Ca3Hf2SiAl2O12:x%Ce3+ phosphors; inset: (upper right) dependence of emission intensity and peak position of Ca3Hf2SiAl2O12:x%Ce3+ phosphors on Ce3+ content. | |
The PL spectra of Ca3Hf2SiAl2O12:y%Mn2+ with different Mn2+ content are shown in Fig. 5. With 453 nm excitation, CHSA:Mn2+ can emit visible light which attributes 4T1(4G)–6A1(6S) transition of the Mn2+. Specially, in the low content, it is clearly that CHSA:Mn2+ can emit green light peaking at about 556 nm. With the increasing of Mn2+ content, another two peaks appear peaking at about 590 and 670 nm and emit orange and red light. According to above site occupying situations of Mn2+, the special emission spectra of CHSA:Mn2+ can be explained by different occupying site of Mn2+. In the low content of Mn2+, Mn2+ may substitute Al3+/Si4+ site. Generally speaking, the emission properties of Mn2+ are determined to the coordination number of the occupied site in the crystal structure mainly by Mn2+.33,34 With the coordination number increasing, the emission of Mn2+ will shift to red range in the spectra. In this CHSA structure, Al3+/Si4+ are four coordinations. That is a relative small coordination and when Mn2+ occupies in this site, it will emit shortwave light. Therefore, in the low content of Mn2+ it will emit green light in this system. The occupying situation of Mn2+ in low content is certified by XRD peaks shift and emission spectra property. Furthermore, in high content of Mn2+ another two emission peaks appear. We conjecture that in high Mn2+ content, Mn2+ will occupy Hf4+ and Ca2+ site. Due to different coordination of Hf4+ and Ca2+, when Mn2+ occupy these two sites it will emit different light. Hf4+ has six coordinations and Ca2+ is eight as shown in Fig. 1. Therefore, when Mn2+ substitutes Hf4+ site it will emit orange light peaking at 590 nm while Mn2+ substitutes Ca2+ site it will emit orange light peaking at 670 nm, respectively. According to emission spectra properties, we conjecture that Mn2+ may substitute both Hf4+ and Ca2+. That can be as a supportive certification of Mn2+ occupying situation in high content.
 |
| Fig. 5 PL properties under 453 nm excitation of series Ca3Hf2SiAl2O12:y%Mn2+ phosphors. | |
The PL properties of Ce–Mn co-doped CHSA phosphors are shown in Fig. 6. It is clearly seen that the spectra are consist of two parts, one is at the range of 450–525 nm which can be attributed to Ce3+ emission; another part is at about 550–650 nm, which can be attributed to Mn2+ emission. Furthermore, as the general situation, with the increasing of Mn2+ content, the intensities of Ce3+ emission are decreasing gradually and the intensities of Mn2+ are increasing, respectively. More importantly, in the Ce–Mn co-doped situation, in the low Mn2+ content, specially, at 3%, the intensity of emission peaking at 556 nm reaches to highest. With the increasing of Mn2+ content, the emission peaking at 556 nm becomes weak and disappears in the spectra cause to concentration quenching and anther peak at 590 nm appear and then becomes weak. The emission peaks of Mn2+ just appear two peaking at about 556 and 590 nm which is different with the Mn2+ single-doped phosphor shown in Fig. 5. We surmise that the different energy transition efficiency between Ce3+ and Mn2+ may lead to this special situation. In general, the resonant-type energy transfer from a sensitizer to an activator in a phosphor may take place via the exchange interaction and electric multipolar interaction. In many cases, concentration quenching is due to energy transfer from one activator to another until an energy sink in the lattice is reached. The critical distance RC for energy transfer from the Ce3+ to Mn2+ ions can be calculated using the concentration quenching method. According to Sato, the critical distance Rc can be described by35
where
N is the number of available sites for the dopant in the unit cell,
xc is the total concentration of the Ce
3+ and Mn
2+ ions, and
V is the volume of the unit cell. According to previous study on the crystal structure of CHSA, the acquired values 1891.26 Å
3, respectively.
N has different values cause to different occupying situation of Mn
2+. There are three possible situations: (1) when Mn
2+ occupies Al
3+/Si
4+, N
1 is 72; (2) when Mn
2+ occupies Hf
4+, N
2 is 71; (3) when Mn
2+ occupies Ca
2+, N
3 is 36. After calculation, the values of
Rc in three situations are
Rc1 = 10.8 Å,
Rc2 = 10.1 Å and
Rc3 = 12.6 Å. According to the results, we find that
Rc1 ≈
Rc2 and they are smaller than
Rc3 which demonstrates that when Mn
2+ occupies Al
3+/Si
4+ and Hf
4+ it has smaller critical distance. The smaller critical distance leads to more chances for Ce
3+ to transfer energy to Mn
2+. This result leads to the two emission peaks (556 and 590 nm) of Mn
2+ in co-doped CHSA phosphor appear and the third peak at 670 nm obtains little energy from Ce
3+ and too weak and does not appearing in co-doped emission spectra.
 |
| Fig. 6 PL spectra of Ca3Hf2SiAl2O12:1%Ce3+,y%Mn2+ phosphors on Mn2+ doping concentration (y) (λex = 360 nm). | |
Temperature-dependent relative emission intensity under 400 nm excitation of CHSA:1%Ce3+,14%Mn2+ is indicated in Fig. 7. It can be clearly seen that with temperature increasing, the emission intensity decreases gradually and the emission band of Ce3+ goes from two apparent asymmetric broad peaks to one broad band definitely. Generally, the thermal quenching of emission intensity can be explained by a configurational coordinate diagram in which, through phonon interaction, the excited luminescence center is thermally activated through the crossing point between the excited state and the ground state. This non-radiative transition probability by thermal activation is strongly dependent on temperature resulting in the decrease of emission intensity.36,37 Due to the increasing phonon interaction and non-radiative transition with increasing temperature, the spectral overlap between the excitation band (Fig. 3b) and the first emission band (5d–2F5/2 emission band) increases. This results in more re-absorption of the first emission due to the 5d–2F5/2 transition and thus in a relative stronger decrease of the 458 nm with respect to the 486 nm emission band. That leads to two apparent asymmetric broad peaks to one broad band definitely with temperature increasing. Furthermore, the Mn2+ emission spectra also take on a slight blue shift with temperature increasing. A similar phenomenon has been found and studied in other Mn2+ ion doped phosphors.38 It was ascribed to the thermally active phonon-assisted tunnelling from the excited states of the low energy emission band to the excited states of the high-energy emission band in the configuration coordinate diagram. In order to better understand temperature dependence of the luminescence, the activation energy (Ea) was calculated using the Arrhenius equation39
where
I0 is the initial PL intensity of the phosphor at room temperature,
IT is the PL intensity at different temperatures,
c is a constant, Δ
E is the activation energy, and
k is the Boltzmann constant (8.62 × 10
−5 eV). Making this function to do logarithmic transformation can get
40
 |
| Fig. 7 Temperature dependence of Ca3Hf2SiAl2O12:1%Ce3+,14%Mn2+ PL properties. | |
According to the equation, the activation energy ΔE can be calculated by plotting ln[(I0/IT) − 1] against 1/kT, where a straight slope equals ΔE. As shown in Fig. 8, ΔE of Ce3+ emission was found to be 0.1879 eV and 0.1781 eV for Mn2+ emission.
 |
| Fig. 8 The Arrhenius fitting of the emission intensity of Ca3Hf2SiAl2O12:1%Ce3+,14%Mn2+ phosphor and the calculated Ea for thermal quenching at Ce3+ (a) and Mn2+ (b) emission. | |
The PL decay curves of CHSA:1%Ce3+,yMn2+ excited at 400 nm and monitored the main emission of the Ce3+ ions at 486 nm were measured, and the lifetimes are shown in Fig. 9. It can be seen that the decay curves of the 5d–4f transition of CHSA:1%Ce3+,yMn2+ shows a second order exponential decay, which can be fitted by the equation:41
I(t) = A1 exp(−t/τ1) + A2(−t/τ2) |
where
I is the luminescence intensity;
A1 and
A2 are constants;
t is time; and
τ1 and
τ2 are the lifetimes for the exponential components. Further, the average lifetime constant (
τ*) can be calculated as:
τ* = (A1τ12 + A2τ22)/(A1τ1 + A2τ2) |
 |
| Fig. 9 Decay curves of Ca3Hf2SiAl2O12:1%Ce3+,y%Mn2+ phosphors with different Mn2+ contents. | |
The calculated average lifetimes of CHSA:1%Ce3+,yMn2+ (y = 1%, 3%, 5%, 7%, 10%, 14%) are 43.6, 40.8, 36.4, 35.2, 31.0 and 28.1 ns, respectively. The decay time of CHSA:1%Ce3+ sample without the Mn2+ was determined to be 46.4 ns for the 5d–4f transition. However, when the Mn2+ was doped in the system of CHSA:1%Ce3+, the decay of Ce3+ ions becomes faster and faster. The decay time of the Ce3+ ions was found to decrease as the Mn2+ concentrations increases, which demonstrates that the energy transfer process occurs from sensitizer Ce3+ to activator Mn2+. Additional, the energy transfer efficiency from Ce3+ to Mn2+ in CHSA matrix can be determined using the calculation below:
where
τ0 and
τx stand for the lifetimes of the sensitizer Ce
3+ in the absence and the presence of activator Mn
2+, respectively. The energy transfer efficiency was calculated to be 6%, 12%, 21%, 24%, 33% and 39%. The energy transfer efficiency is found to increase with increasing Mn
2+ content. When the doped Mn
2+ concentration was 14%, the value of energy transfer efficiency is estimated to be 39%. So, it indicated that the Mn
2+ emission intensity was enhanced
via energy transfer from sensitizer Ce
3+, instead of the energy absorption by Mn
2+ ions themselves.
The variation of the Commission International de L'Eclairage (CIE) chromaticity coordinates and color temperature of the CHSA:1%Ce3+,yMn2+ phosphors with different doping contents of Mn2+ are calculated based on the corresponding PL spectrum upon 400 nm excitation summarized in Fig. 10 and Table 1. Increasingly, the color tune can be modulated from cyan (0.2303, 0.3265) to white (0.3350, 0.3388) with the increasing doping content of the Mn2+ ions, which is due to the variation of the emission intensity of Ce3+ and Mn2+ through the energy transfer from Ce3+ to Mn2+. The correlated color temperature can be adjusted from 12
763 K to 5379 K. The emission color is tunable in the visible region from blue to white by controlling Mn2+ doped contents which indicates that the series of CHSA:1%Ce3+,yMn2+ phosphors are promising candidates for color tunable luminescence material used for the n-UV w-LEDs.
 |
| Fig. 10 CIE chromaticity diagram and coordinate of Ca3Hf2SiAl2O12:1%Ce3+,y%Mn2+ (y = 0–14) phosphors. | |
Table 1 Comparison of the CIE chromaticity coordinates (x, y) for CHSA:1%Ce3+,yMn2+ phosphors excited at 400 nm
Ce3+ (x) and Mn2+ (y) content |
CIE coordinates (x, y) |
Color temperature (K) |
x = 1%, y = 0 |
(0.2303, 0.3265) |
12 763 K |
x = 1%, y = 1% |
(0.2593, 0.3302) |
10 005 K |
x = 1%, y = 3% |
(0.2735, 0.3431) |
8628 K |
x = 1%, y = 5% |
(0.2882, 0.3413) |
7768 K |
x = 1%, y = 7% |
(0.2994, 0.3332) |
7224 K |
x = 1%, y = 10% |
(0.3148, 0.3381) |
6345 K |
x = 1%, y = 14% |
(0.3350, 0.3388) |
5379 K |
4. Conclusions
In summary, a series of color-adjustment CHSA:Ce3+,Mn2+ phosphors were prepared through a conventional solid-state reaction. It was found that three different cation sites (Ca2+, Hf4+ and Al3+/Si4+) in the Ca3Hf2SiAl2O12 phase were occupied evenly by Ce3+ and Mn2+ ions. Different situation of Mn2+ occupying sites and energy transfer from Ce3+ to Mn2+ can appear with different Mn2+ content and the critical distance was calculated to be Rc1 = 10.8 Å, Rc2 = 10.1 Å and Rc3 = 12.6 Å after calculation of energy transfer from the Ce3+ to Mn2+ by using the concentration quenching method. Ca3Hf2SiAl2O12:Ce3+,Mn2+ phosphors exhibited a broad excitation band ranging from 300 to 450 nm and two broad asymmetric emission bands upon 400 nm excitation. The emission color of the obtained phosphors can be modulated from blue-green (0.2303, 0.3265) to white (0.3350, 0.3388) by controlling the doping content of the Mn2+ ions with the fixed Ce3+ content. The correlated color temperature can be adjusted from 12
763 K to 5379 K.
Acknowledgements
This work is supported by Specialized Research Fund for the Doctoral Program of Higher Education (no. 20120211130003), State Key Laboratory on Integrated Optoelectronics (No. IOSKL2013KF15).
References
- S. Ye, F. Xiao, Y. X. Pan, Y. Y. Ma and Q. Y. Zhang, Mater. Sci. Eng., R, 2010, 71, 1 CrossRef.
- A. Kitai, Luminescent Materials and Applications, John Wiley & Sons, Ltd, 2008, ISBN 978-0-470-05818-3 Search PubMed.
- W. B. Im, N. George, J. Kurzman, S. Brinkley, A. Mikhailovsky, J. Hu, B. F. Chmelka, S. P. DenBaars and R. Seshadri, Adv. Mater., 2011, 23, 2300 CrossRef CAS PubMed.
- Y. Shimomura, T. Honma, M. Shigeiwa, T. Akai, K. Okamoto and N. Kijima, J. Electrochem. Soc., 2007, 154, 35 CrossRef.
- A. A. Setlur, W. J. Heward, Y. Gao, A. M. Srivastava, R. G. Chandran and M. V. Shankar, Chem. Mater., 2006, 18, 3314 CrossRef CAS.
- J. K. Li, J. G. Li, S. H. Liu, X. D. Li, X. D. Sun and O. Sakkab, J. Mater. Chem. C, 2013, 1, 7614 RSC.
- J. M. Phillips, M. E. Coltrin, M. H. Crawford, A. J. Fischer, M. R. Krames, R. M. Mach, G. O. Mueller, Y. Ohno, L. E. S. Rohwer, J. A. Simmons and J. Y. Tsao, Laser Photonics Rev., 2007, 1(4), 307 CrossRef CAS.
- W. B. Im, S. Brinkley, J. Hu, A. Mikhailovsky, S. P. Denbaars and R. Seshadri, Chem. Mater., 2010, 22, 2849 Search PubMed.
- C. K. Chang and T. M. Chen, Appl. Phys. Lett., 2007, 90, 161901 CrossRef.
- C. M. Liu, Z. M. Qi, C. G. Ma, P. Dorenbos, D. J. Hou, S. Zhang, X. J. Kuang, J. H. Zhang and H. B. Liang, Chem. Mater., 2006, 18, 3709 Search PubMed.
- Z. G. Xia, J. Zhou and Z. Y. Mao, J. Mater. Chem. C, 2013, 1, 5917 RSC.
- C. Y. Liu, Z. G. Xia, Z. P. Lian, J. Zhou and Q. F. Yan, J. Mater. Chem. C, 2013, 1, 7139 RSC.
- D. G. Deng, H. Yu, Y. Q. Li, Y. J. Hua, G. H. Jia, S. L. Zhao, H. P. Wang, L. H. Huang, Y. Y. Li, C. X. Li and S. Q. Xu, J. Mater. Chem. C, 2013, 1, 3194 RSC.
- S. H. Miao, Z. G. Xia, M. S. Molokeev, M. Y. Chen, J. Zhang and Q. L. Liu, J. Mater. Chem. C, 2015, 3, 4616 RSC.
- H. K. Park, J. H. Oh, H. Kang, J. Zhang and Y. R. Do, ACS Appl. Mater. Interfaces, 2015, 7, 4549 CAS.
- W. B. Park, S. P. Singh, M. Kim and K. S. Sohn, Inorg. Chem., 2015, 54, 1829 CrossRef CAS PubMed.
- V. Bachmann, C. Ronda and A. Meijerink, Chem. Mater., 2009, 21, 2077 CrossRef CAS.
- H. K. Liu, L. B. Liao and Z. G. Xia, RSC Adv., 2014, 4, 7288 RSC.
- T. Ishigaki, A. Torisaka, K. Nomizu, P. Madhusudan, K. Uematsu, K. Toda and M. Satoac, Dalton Trans., 2013, 42, 4781 RSC.
- Y. C. Jia, Y. J. Huang, N. Guo, H. Qiao, Y. H. Zheng, W. Z. Lv, Q. Zhao and H. P. You, RSC Adv., 2012, 2, 2678 RSC.
- C. Bertail, S. Maron, V. Buissett, T. L. Mercier, T. Gacoin and J. P. Boilot, Chem. Mater., 2011, 23, 2961 CrossRef CAS.
- W. B. Dai, S. Ye, E. L. Li, P. Z. Zhuo and Q. Y. Zhang, J. Mater. Chem. C, 2015, 3, 8132 RSC.
- W. J. Tang and Z. Zhang, J. Mater. Chem. C, 2015, 3, 5339 RSC.
- Y. F. Liu, X. Zhang, Z. D. Hao, X. J. Wang and J. H. Zhang, Chem. Commun., 2011, 47, 10677 RSC.
- X. G. Zhang and M. L. Gong, Mater. Lett., 2011, 65, 1756 CrossRef CAS.
- G. G. Li, D. L. Geng, M. M. Shang, C. Peng, Z. Y. Cheng and J. Lin, J. Mater. Chem., 2011, 21, 13334 RSC.
- C. H. Huang and T. M. Chen, J. Phys. Chem. C, 2011, 115, 2349 CAS.
- I. O. Galuskina, E. V. Galuskin, K. Prusik, V. M. Gazeev, N. N. Pertsev and P. Dzierzanowski, Mineral. Mag., 2013, 7(6), 2857 CrossRef.
- I. O. Galuskina, E. V. Galuskin, P. Dzierżanowski, V. M. Gazeev, K. Prusik, N. Pertsev, A. Winiarski, A. E. Zadov and R. Wrzalik, Am. Mineral., 2010, 95, 1305 CrossRef CAS.
- H. S. Jang, Y. H. Won and D. Y. Jeon, Appl. Phys. B: Lasers Opt., 2009, 95, 715 CrossRef CAS.
- S. H. Miao, Z. Z. Xia, M. S. Molokeev, M. Y. Chen, J. Zhan and Q. Liu, J. Mater. Chem. C, 2015, 3, 4616 RSC.
- W. Y. Huang, F. Yoshimura, K. Ueda, Y. Shimomura, H. S. Sheu, T. S. Chan, C. Y. Chiang, W. Z. Zhou and R. S. Liu, Chem. Mater., 2014, 26(6), 2075 CrossRef CAS.
- P. Pust, V. Weiler, C. Hecht, A. Tücks, A. S. Wochnik, A. K. Henß, D. Wiechert, C. Scheu, P. J. Schmidt and W. Schnick, Nat. Mater., 2014, 13, 891 CrossRef CAS PubMed.
- Y. Q. Li, N. Hirosaki, R. J. Xie, T. Takeda and M. Mitomo, Chem. Mater., 2008, 20, 6704 CrossRef CAS.
- Y. Sato, H. Kato, M. Kobayashi, T. Masaki, D. H. Yoon and M. Kakinada, Angew. Chem., Int. Ed., 2014, 53, 7756 CrossRef CAS PubMed.
- J. F. Sun, Z. P. Lian, G. Q. Shen and D. Z. Shen, RSC Adv., 2013, 3, 18395 RSC.
- R. D. Shannon, Acta Crystallogr., Sect. A: Cryst. Phys., Diffr., Theor. Gen. Crystallogr., 1976, 32, 751 CrossRef.
- C. Y. Liu, Z. G. Xia, Z. P. Lian, J. Zhou and Q. F. Yan, J. Mater. Chem. C, 2013, 1, 7139 RSC.
- W. Z. Lv, Y. C. Jia, Q. Zhao, W. Lu, M. M. Jiao, B. q. Shao and H. P. You, J. Phys. Chem. C, 2014, 118, 4649 CAS.
- S. P. Lee, C. H. Huang, T. S. Chan and T. M. Chen, ACS Appl. Mater. Interfaces, 2014, 6(10), 7260 CAS.
- D. A. McKeown and A. C. Nobles, Phys. Rev. B: Condens. Matter Mater. Phys., 1996, 54, 291308 CrossRef.
|
This journal is © The Royal Society of Chemistry 2015 |
Click here to see how this site uses Cookies. View our privacy policy here.