DOI:
10.1039/C5RA20254J
(Paper)
RSC Adv., 2015,
5, 100369-100377
Thermophysical behaviour of matrix-grafted graphene/poly(ethylene tetrasulphide) nanocomposites†
Received
30th September 2015
, Accepted 13th November 2015
First published on 17th November 2015
Abstract
A novel approach was used to fabricate poly(ethylene tetrasulphide) (PETS)-modified graphene nanosheets. Accordingly, graphene oxide (GO) was modified with (3-chloropropyl)triethoxysilane (CPTES) to yield GO-Cl with the ability of participation in interfacial polymerization of 1,2-dichloromethane (EDC) and disodium tetrasulphide (Na2S4) and synthesis of graphene/PETS nanocomposites. Also, to investigate the effect of surface chemistry of the nanosheets on the properties of the nanocomposites, GO-Cl nanosheets were reduced by hydrazine monohydrate to obtain rGO-Cl. The success of modification and reduction of the nanosheets was confirmed by Fourier transform infrared spectroscopy (FT-IR), thermogravimetric analysis (TGA), X-ray powder diffraction (XRD), Raman spectroscopy, scanning electron microscopy (SEM), and transmission electron microscopy (TEM). Then, two series of nanocomposites containing different contents of GO-Cl and rGO-Cl were synthesized. Proton nuclear magnetic resonance (1H NMR) was used to determine the molecular weights of the polymers. Also, dispersion of the nanosheets in the polymeric matrix was studied by XRD and thermal stability and the thermophysical properties of the nanocomposites were investigated by TGA and differential scanning calorimetry (DSC) respectively. Results showed that incorporation of the nanosheets leads to lower molecular weights of the polymeric matrix whereas reduced nanosheets were dispersed more appropriately in the matrix. According to the TGA results, the dispersion of nanosheets and molecular weight of the matrix were prominent factors in the thermal stability of the nanocomposites. Also, all samples showed a glass transition temperature (Tg) less than 0 °C, a cold crystallization temperature (Tcc), and a subsequent melting point (Tm) which were affected by the content of nanosheets.
Introduction
Polysulfide polymers as adhesives and sealants are known as highly-resistant materials to solvents and chemicals and have excellent weathering resistance properties.1–4 They are commonly synthesized by condensation polymerization of dihalides such as 1,4-dibromo-2-butene,5 styrene dibromide,6 and 1,4-bis(chloromethyl)-benzene7 with sodium polysulphides. Polysulphide polymers with tetrasulphide linkages show a rubber-like behaviour8 whereas their low thermal stability is their main disadvantage.9 Thus, some research works have been performed to improve performance properties of these polymers with different nanoparticles such as clay nanoplatelets,10 titanium dioxide nanoparticles,11 carbon nanotubes,12 and graphene nanosheets.13
Among different nanoparticles, graphene as one-atom-thick planar nanosheet has gotten much attention due to its overriding mechanical, electrical, and thermal properties14,15 and is largely used in preparation of nanocomposites.16,17 There are few reports about polysulphide polymers/graphene nanocomposites13,18–20 in those graphene layers are used in pristine, oxidized and expanded state. Thus, no obvious results are reported about the effect surface functionalization on thermophysical properties of prepared nanocomposites.
Up to now, different strategies are used to graft polymers on nanoparticles, comprising “grafting to” approach, in which the end-functionalized chains react with a functionalized surface;21 “grafting from” approach, in which polymer chains grow from the surface22 and the “grafting through” method where polymerizable groups exist on the surface of nanoparticles.23 Among these strategies, the most applicable mechanism is “grafting from” approach where an appropriate amount of polymer chains are attached on surface without steric hindrance. In the case of condensation polymerization, if a monomer is attached on surface, “grafting from” approach may be used. However, regarding different methods of nanocomposites preparation, in situ polymerization24 is an effective method that easily is coupled with “grafting from” approach to reach a well-dispersed nanoparticles in polymeric matrix. As a result, appropriate dispersion of nanoparticles leads to improved properties of nanocomposites.25 In the case of layered nanoparticles, better thermal stability is originated from the ability of layered nanoparticles to obstruct the volatile gas produced by thermal decomposition. Newly formed radicals derived from the degradation of polymer are confined by platelets followed by a variety of bimolecular reactions. As the degradation progresses, the platelets form a barrier. In these system, better dispersion of nanoparticles results in supporting barrier formation and conclusively better thermal stability.26,27
To this end, graphene oxide (GO) nanosheets were modified with (3-chloropropyl)triethoxysilane (CPTES) to obtain polymerizable graphene nanolayers (GO-Cl) in current work. Then, to change surface properties, GO-Cl nanosheets were reduced chemically by hydrazine monohydrate to remove remained oxygen-containing groups (rGO-Cl). GO-Cl and rGO-Cl nanosheets as polymerizable nanofillers with different contents were used to synthesize poly(ethylene tetrasulphide) (PETS)/graphene nanocomposites. Fourier transform infrared spectroscopy (FT-IR) and Raman spectroscopy were used to characterize different bands in the products. Proton nuclear magnetic resonance (1H NMR) was used to characterize the structure of synthesized polysulphide polymers and also, calculate their molecular weight. Thermophysical properties and thermal stability of samples were investigated by differential scanning calorimetry (DSC) and thermogravimetric analysis (TGA) respectively. X-ray powder diffraction (XRD), scanning electron microscopy (SEM) and transmission electron microscopy (TEM) were used to structural study.
Experimental section
Materials
GO was prepared via modified Hummers' method as described previously.28 (3-Chloropropyl)triethoxysilane (Aldrich, 95%, CPTES), ethanol (Merck, 99.9%), ammonia (Mojallali, aqueous solution, 25%), n-hexane (Mojallai, 99%), acetone (Mojallali, extra pure), hydrazine monohydrate (Sigma-Aldrich, N2H4 64–65%, 98%), sodium hydroxide (Mojallali, 97%, NaOH), sulphur (Merck, 99%, S), 1,2-dichloroethane (Sigma-Aldrich, 99.8%, EDC), and hydrochloric acid (Mojallali, aqueous solution, 37%) were used as received.
Modification of GO by CPTES
CPTES grafting onto the surface was carried out through the hydroxyl functional groups.29 GO (2.0 g) was dispersed in ethanol (100 mL) and ultrasonically agitated for 1 h to reach a homogeneous dispersion. Then, ammonia (30 mL) was added and stirring was continued at 40 °C for 3 h. CPTES/ethanol solution (7 mL/50 mL) was added dropwise and stirring was continued at 40 °C overnight. The obtained suspension was precipitated in n-hexane (500 mL) and then centrifuged at 10![[thin space (1/6-em)]](https://www.rsc.org/images/entities/char_2009.gif) 000 rpm for 30 min. Purification was carried out in acetone (20 mL) several times. After precipitation of the purified product in n-hexane (200 mL) and drying in vacuum oven at 60 °C overnight, the CPTES-functionalized GO nanoplatelets (GO-Cl) were obtained.
000 rpm for 30 min. Purification was carried out in acetone (20 mL) several times. After precipitation of the purified product in n-hexane (200 mL) and drying in vacuum oven at 60 °C overnight, the CPTES-functionalized GO nanoplatelets (GO-Cl) were obtained.
Chemical reduction of GO-Cl by hydrazine monohydrate
GO-Cl (1.0 g) was dispersed in mixture of distilled water/ethanol (50/50, 75 mL) by ultrasonication (30 min) and stirred for 24 h. Hydrazine monohydrate (10 mL) was added dropwise and reaction media was refluxed for 6 h. Finally, reduced GO-Cl (rGO-Cl) was obtained after washing three times with distilled water, centrifugation at 10000 rpm and drying in vacuum at 60 °C.
Synthesis of disodium tetrasulphide (Na2S4)
Sodium hydroxide (16 g, 0.40 mol) was dissolved in distilled water (400 mL) and heated to the boiling point of media where it was refluxed. Sulphur (25 g, 0.78 mol) was added to the solution and stirring was continued until sulphur was completely dissolved. After 3 h, reaction media turned from light yellow to dark brown. Then, solution was cooled and unreacted sulphur was filtered to obtain aqueous Na2S4. Eqn (1) shows the mechanism for synthesis of Na2S4.| | |
6NaOH + 9S → 2Na2S4 + Na2SO3 + 3H2O
| (1) |
Synthesis of GO-Cl and rGO-Cl/poly(ethylene tetrasulphide) nanocomposites
To prepare neat poly(ethylene tetrasulphide) (PETS), a fresh solution of Na2S4 (58 mL) in four-necked round-bottom flask was placed in an oil bath thermostated at 70 °C. EDC (22 mL) was added dropwise and reaction was performed at 70 °C for 3 h. Then, product was filtered and washed by distilled water and HCl. Obtained product was washed several times with the same procedure to remove the inorganic salts. Finally, yellowish polymer was dried by vacuum at 60 °C. The reaction mechanism for preparation of polysulphide polymer is stated by eqn (2).| |
 | (2) |
A same procedure was used to prepare nanocomposites with 0.1, 0.3 and 0.5 wt% of GO-Cl and rGO-Cl with respect to EDC. However, according to TGA results of GO-Cl and rGO-Cl, the contents of nanosheets were calculated based on char content at 600 °C. Conclusively, 0.026, 0.080, and 0.132 g of GO-Cl and 0.017, 0.052, 0.087 g of rGO-Cl were used to prepare PGC1, PGC3, PGC5, PrGC1, PrGC3, and PrGC5 respectively. Also, nanosheets were dispersed in media before monomer addition by ultrasonication for 30 min.
Results and discussion
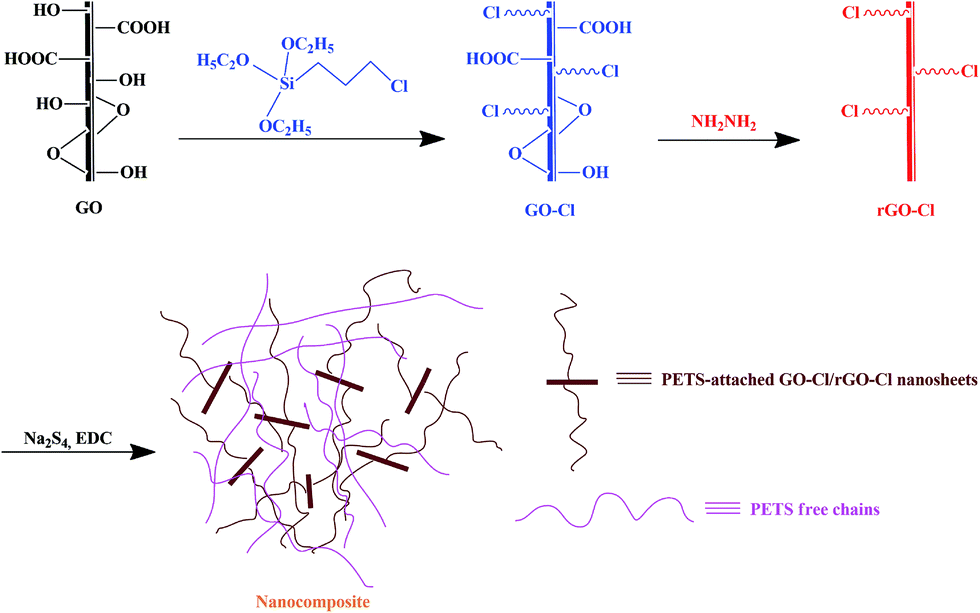
GO nanosheets were modified with CPTES and then, reduced by hydrazine monohydrate. GO-Cl and rGO-Cl nanosheets were used as polymerizable nanosheets to prepare graphene/PETS nanocomposites. Scheme 1 shows the synthetic route for preparation of nanocomposites.
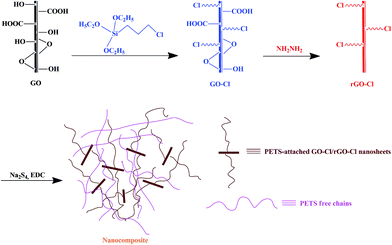 |
| | Scheme 1 Synthetic route of preparation of nanocomposites. | |
Synthesis of GO-Cl and rGO-Cl
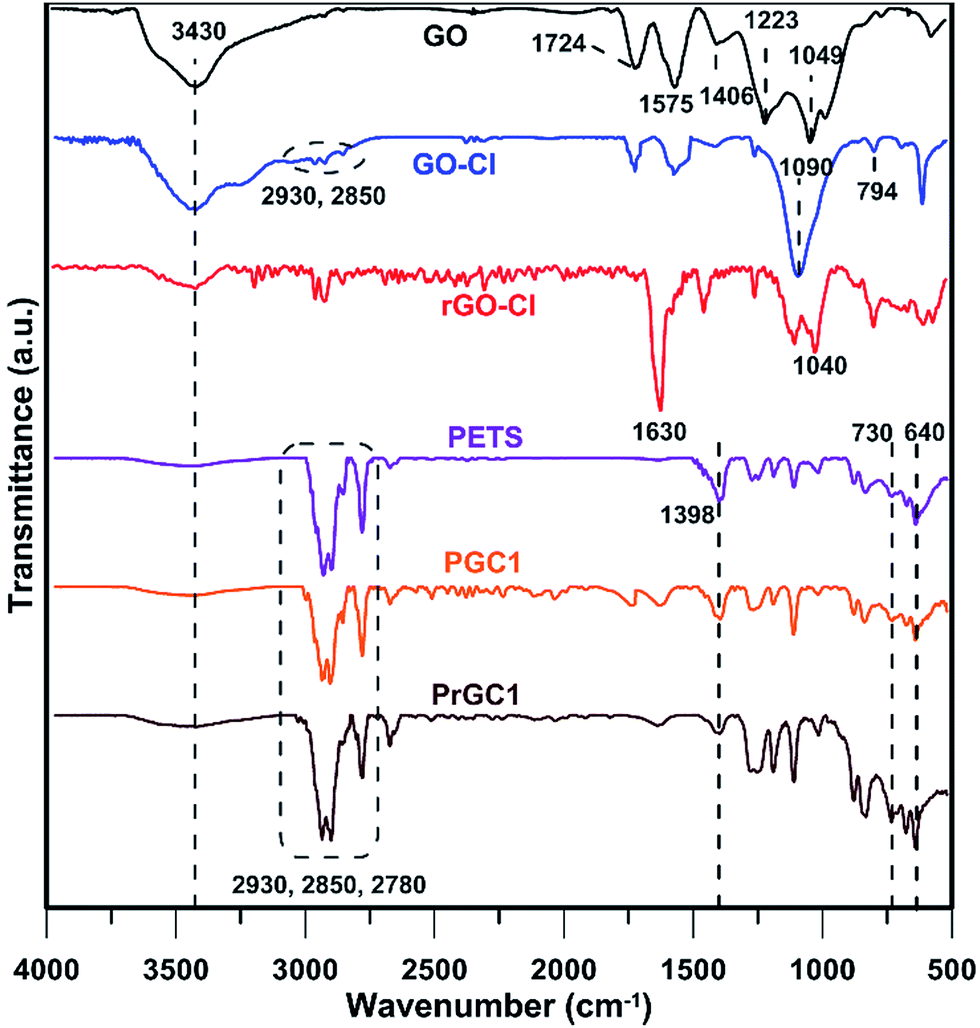
The synthesis of GO-Cl and rGO-Cl were monitored by means of FT-IR spectroscopy (Fig. 1). In all spectra, the characteristic peak at 3430 cm−1 can be assigned to the moisture absorbed by sample or KBr powder.30 GO shows oxygen-containing groups with characteristic peaks at 1049 cm−1 (C–O–C stretching vibrations),31 1223 cm−1 (C–OH stretching vibrations),32 1406 cm−1 (O–H deformation of the C–OH groups), and 1724 cm−1 (C![[double bond, length as m-dash]](https://www.rsc.org/images/entities/char_e001.gif) O stretching vibrations of the –COOH groups)33 whereas stretching vibrations of aromatic CC bonds are seen at 1575 cm−1.34 After modification of GO with CPTES, the peak at 1090 cm−1 is ascribed to the bending vibration of Si–O–C.35 The characteristic absorption of C–H stretching for CH2 groups appears at 2850 and 2930 cm−1,36 and also the characteristic peak at 794 cm−1 is assigned to C–Cl bonds of CPTES.37 Reduction by hydrazine leads to shift the peak of CO stretching vibration to a lower position and coincides with the CC stretching vibration at 1630 cm−1.38,39 Also, characteristic peak at 1040 cm−1 appears due to the C–N stretching of hydrazino alcohols.40 These results clearly show that chemical reduction of GO-Cl is performed successfully.
O stretching vibrations of the –COOH groups)33 whereas stretching vibrations of aromatic CC bonds are seen at 1575 cm−1.34 After modification of GO with CPTES, the peak at 1090 cm−1 is ascribed to the bending vibration of Si–O–C.35 The characteristic absorption of C–H stretching for CH2 groups appears at 2850 and 2930 cm−1,36 and also the characteristic peak at 794 cm−1 is assigned to C–Cl bonds of CPTES.37 Reduction by hydrazine leads to shift the peak of CO stretching vibration to a lower position and coincides with the CC stretching vibration at 1630 cm−1.38,39 Also, characteristic peak at 1040 cm−1 appears due to the C–N stretching of hydrazino alcohols.40 These results clearly show that chemical reduction of GO-Cl is performed successfully.
 |
| | Fig. 1 FTIR spectra of GO, GO-Cl, rGO-Cl, PETS, PGC1, and PrGC1. | |
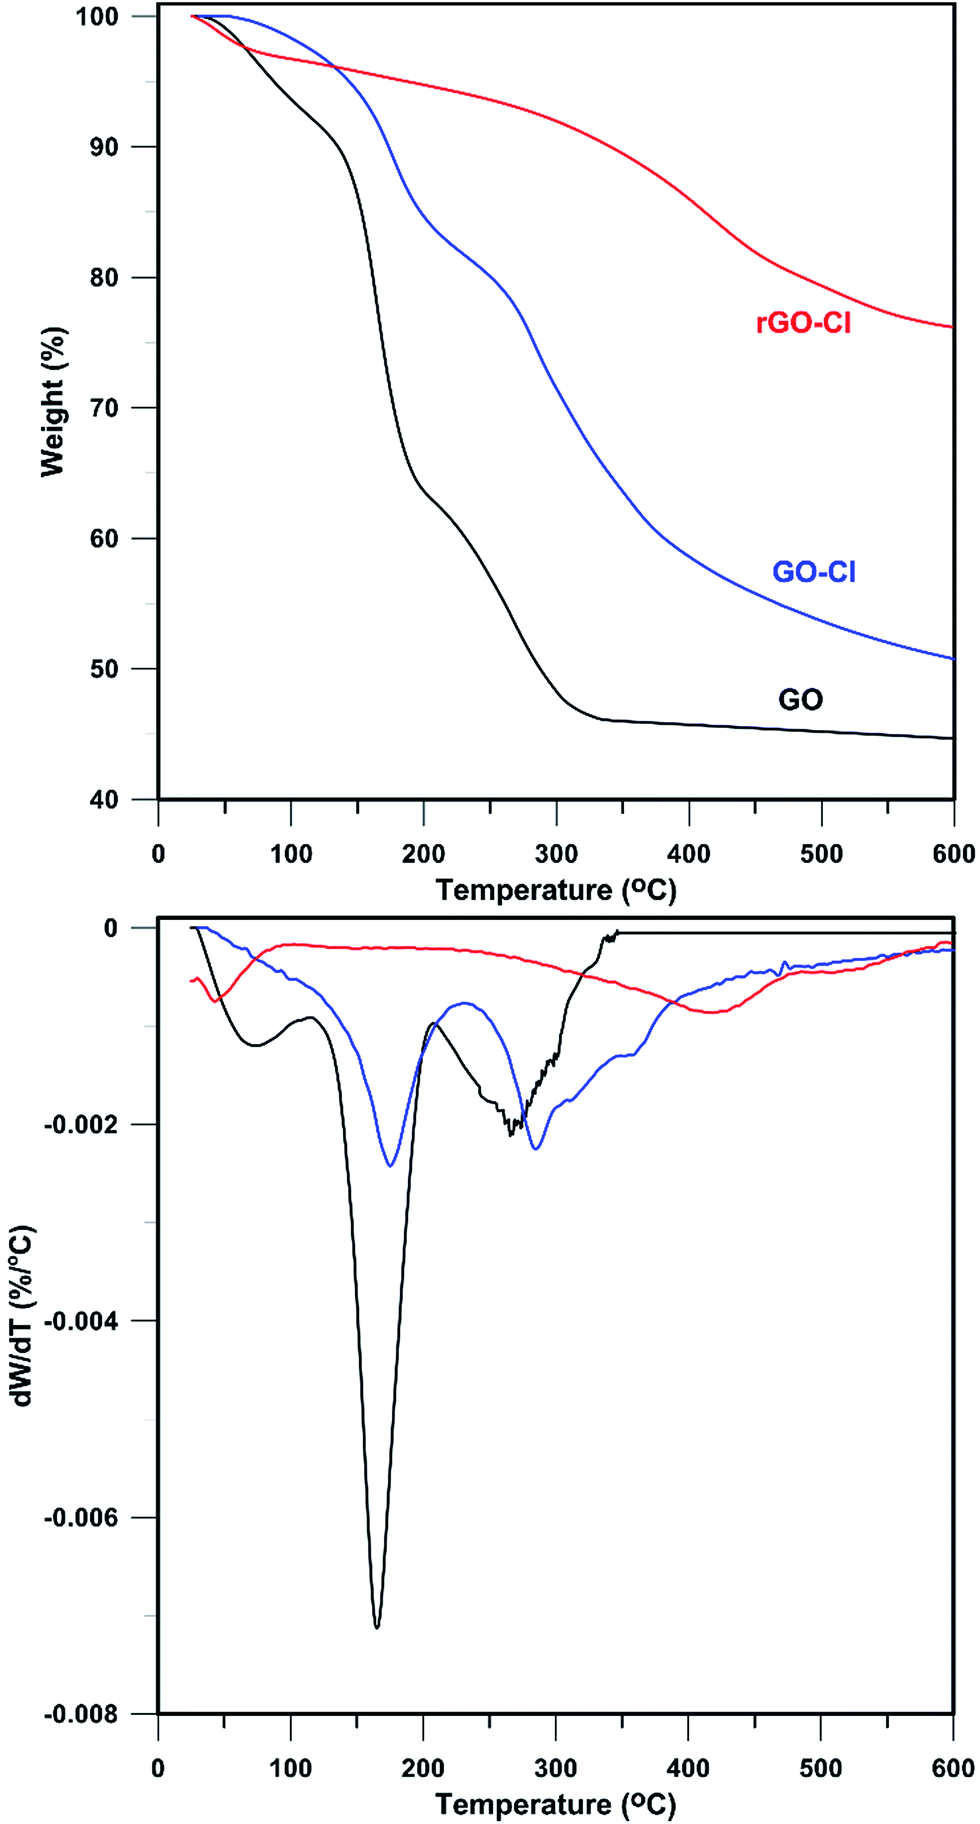
For further proving success of functionalization and reduction processes, samples were analysed by TGA (Fig. 2). The mass loss of all samples around 100 °C is ascribed to the loss of moisture and adsorbed water molecules.41 π-Stacked structure of GO results in storing some water molecules and mass loss of about 7.3 wt% until 110 °C.42 Also, GO shows two main degradation stages between 110 and 600 °C. A major weight loss between 110 and 210 °C with weight loss of ∼30 wt% related to CO, CO2, and H2O release from the most labile functional groups43 and a slower mass loss between 210 and 600 °C related to degradation of more stable oxygen functionalities with weight loss of ∼18 wt%.44
 |
| | Fig. 2 TGA and DTG curves of GO, GO-Cl, and rGO-Cl. | |
By substitution of nonpolar C–Cl containing CPTES with polar oxygen-containing groups in GO-Cl, the extent of absorbed water decreased dramatically. However, a quite different decomposition pattern was observed after functionalization of GO with CPTES. This can be explained by loss of the most oxygen-containing functional groups during the reaction between hydroxyl functionalities of GO and CPTES. The weight loss of GO-Cl between 110 and 230 °C was 16.0 wt% that shows a slightly higher temperature of degradation and lower mass loss with respect to GO. Also, a weight loss of 30.9 wt% in 230–600 °C can be related to degradation of modifier and remaining oxygen-containing groups. This stage of degradation initiates at higher temperatures due to reaction of functional groups with CPTES. After chemical reduction of GO-Cl with hydrazine monohydrate, the amount of water molecules stored in π-stacked structure is reduced dramatically and mass loss of ∼3.4 wt% is observed. Also, an insignificant weight loss of ∼2.5 wt% in 110–230 °C shows that reduction has been performed successfully whereas decomposition was carried out slowly. The last stage of degradation with a slower trend and Td,max of 418.3 °C showed a weight loss of 17.9 wt%. This shows that hydrazine significantly reduces oxygen-containing moieties and leads to higher thermal stability while this degradation can be assigned to CPTES molecules attached onto the surface of nanosheets.
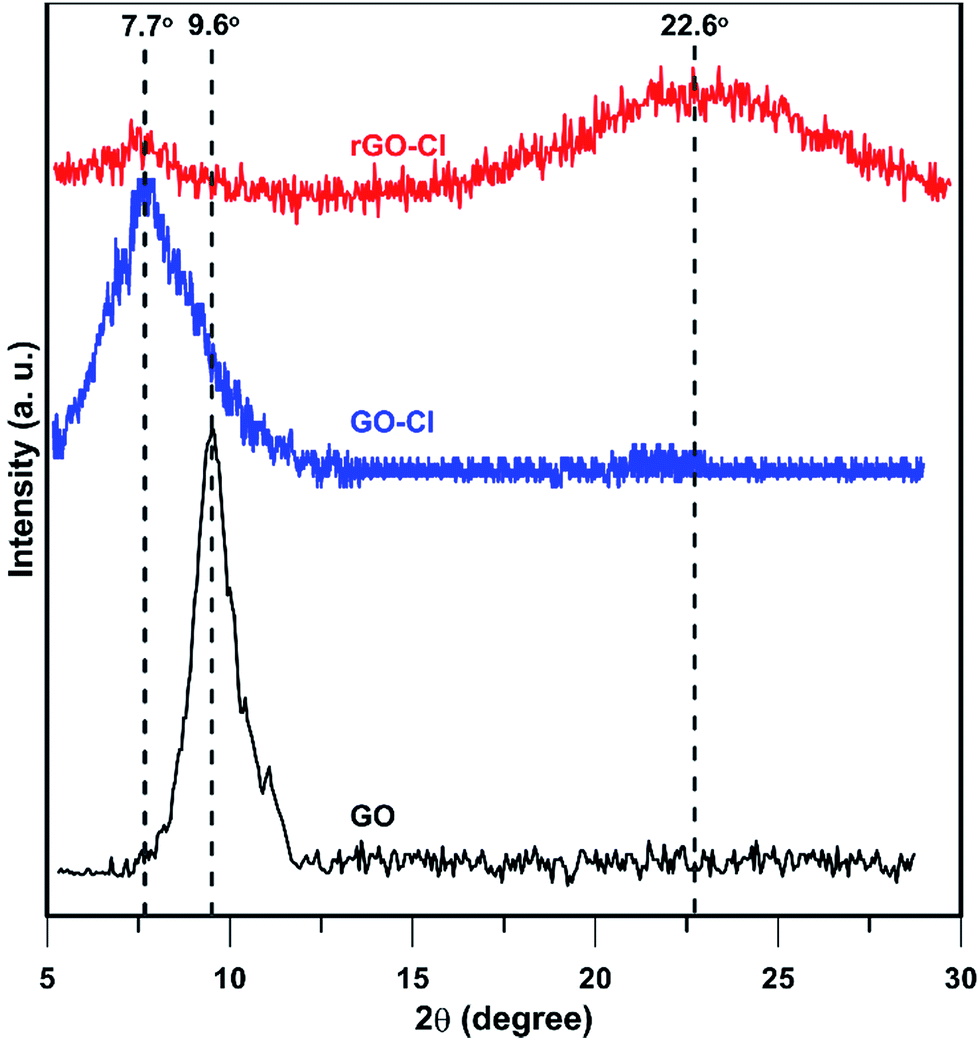
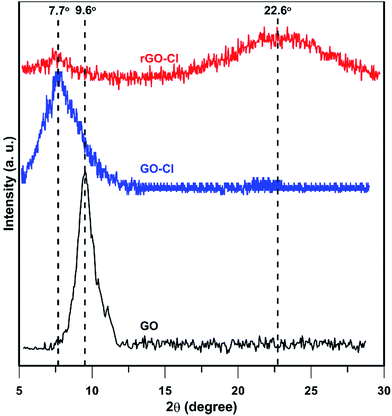
XRD patterns of GO, GO-Cl, and rGO-Cl are shown in Fig. 3. GO shows a basal reflection (002) peak at 2θ = 9.6° (d-spacing = 0.93 nm). After modification with CPTES, the 002 reflection peak shifts to the lower angle at 2θ = 7.7° (d-spacing = 1.32 nm), revealing that the d-spacing increases due to the intercalation of nanolayers functionalized by CPTES molecules.45 XRD pattern of rGO-Cl shows that the reflection peak at 2θ = 7.7° remains unchanged whereas a broad peak at 2θ = 22.6° appears related to reduction of oxygen-containing groups at the surface of GO.46
 |
| | Fig. 3 XRD patterns of GO, GO-Cl, and rGO-Cl. | |
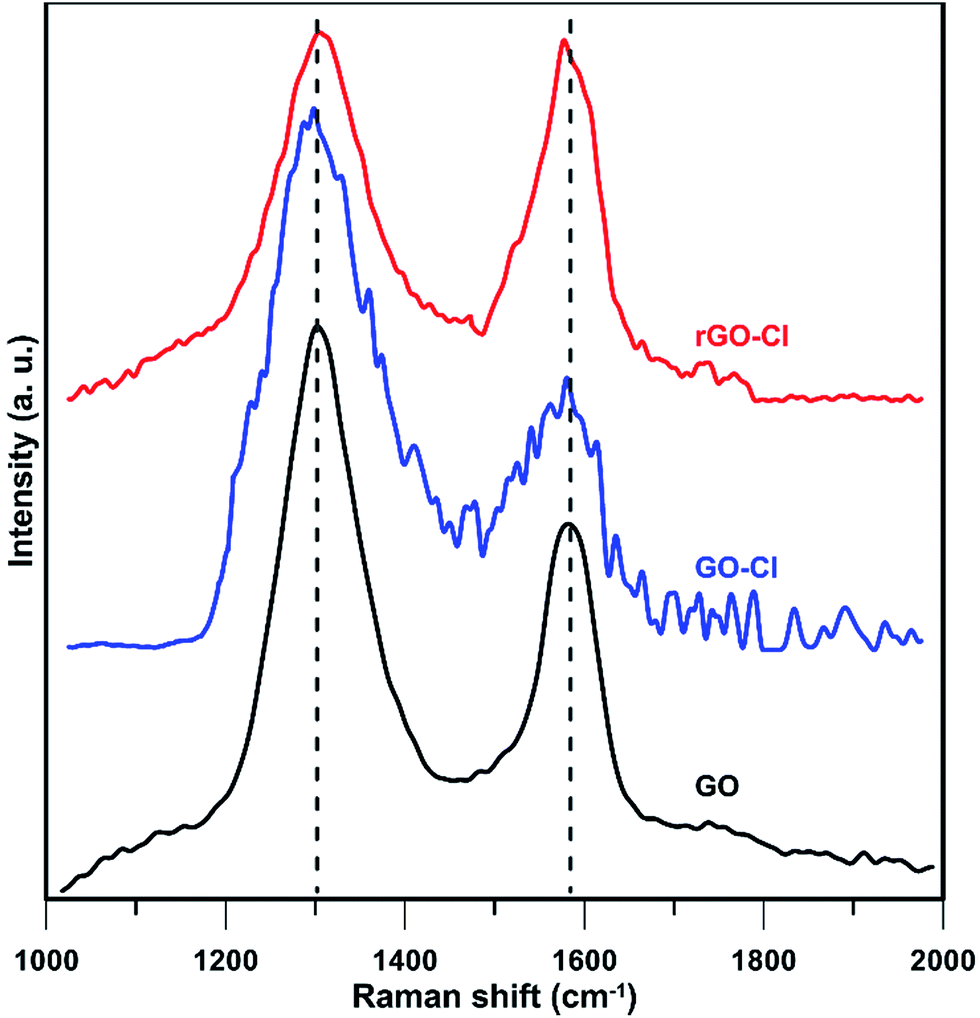
Ordered and disordered crystal structure of carbon in GO, GO-Cl, and rGO-Cl was studied by Raman spectroscopy (Fig. 4). GO spectrum shows two characteristic peaks between 1000 and 2000 cm−1; disorder or D-mode at 1303 cm−1 and tangential G-mode 1582 cm−1. D-mode (breathing mode of κ-point phonons of A1g symmetry) is assigned to the defects in graphene layers and the edge effect of graphene crystallites. G-mode is due to first order scattering of E2g phonon of sp2 carbon atoms.47 Intensity ratio of D and G bands (ID/IG) measures the defective disorders at the surface and determines disruptions originated from modification.48 ID/IG value is obtained 1.53 with predominant D band for GO that shows high disorder structure.49 ID/IG is inversely proportional to the crystallite size (La) according to eqn (3):17
| | |
La = (2.4 × 10⁻¹⁰) × λlaser4(ID/IG)−1
| (3) |
where,
λlaser is the laser excitation wavelength. Therefore, higher crystallite size is achieved for fewer defects and lower
ID/
IG values. According to
eqn (3),
La is calculated 59.6 nm for GO. Reaction of CPTES with GO does not change the Raman spectrum of GO-Cl except
ID/
IG increases to 2.11 and
La decreases to 43.2 nm. This could be the main evidence of successful modification of GO with CPTES. After treatment with hydrazine monohydrate, G band moves to lower Raman shift of 1580 cm
−1,
ID/
IG value decreases to 1.02, and
La increases to 89.3 nm due to reduction effect of hydrazine monohydrate.
50
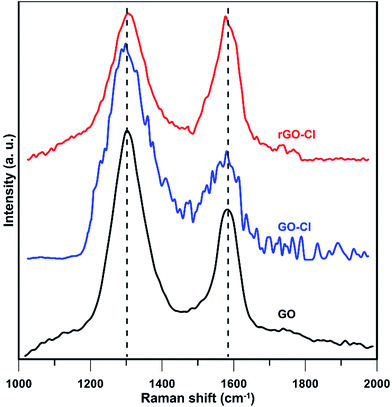 |
| | Fig. 4 Raman spectra of GO, GO-Cl, and rGO-Cl. | |
To study the morphology of samples, SEM and TEM analyses were used. As shown in Fig. 5A and B, the lamella structure of GO is crumpled and wrinkled. Nanosheets are folded and it is possible to distinguish the edges of individual sheets. After modification process (Fig. 5C and D), congeries of attached CPTES molecules appear at the surface of the nanosheets. Treatment of GO-Cl with hydrazine monohydrate results in disappearance of folded structure and re-stacking of nanosheets. However, the edges of individual sheets are still distinguishable with some congeries of attached CPTES (Fig. 5E and F).
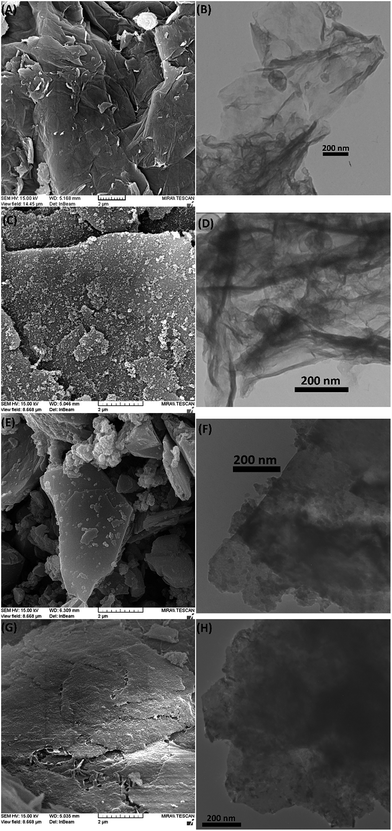 |
| | Fig. 5 SEM and TEM images of GO (A and B), GO-Cl (C and D), rGO-Cl (E and F) and PETS-attached nanosheets of PrGC1 (G and H). | |
Synthesis of GO and rGO/polysulphide nanocomposites
FT-IR spectra of PETS, PGC1, and PrGC1 are depicted in Fig. 1. In all spectra, the characteristic peaks at 2780, 2850, and 2930 cm−1 are ascribed to the stretching vibration of CH2 groups in the backbone of polymers.51 Also, peak at 1398 cm−1 is related to scissoring mode and peak at 730 cm−1 is assigned to the bending vibration of CH2 groups.52 Characteristic peak of C–S stretching is seen at 640 cm−1.53 Furthermore, existing the peaks related to graphene layers even in its oxidized or reduced state shows that nanocomposites are produced successfully.
1H NMR analysis was carried out in DMSO for PETS, PGC1, and PrGC1 after separation of free chains from polymer-grafted nanosheets (Fig. S1†). The characteristic signals of all samples are same except their peaks area. Signals at 2.50 and 3.36 ppm are related to DMSO and water respectively. Protons of –CH2S4– appears at 3.75 ppm and a weak signal at 2.66 is assigned to the –S4H end groups.54 Molecular weight of polymers can be calculated by eqn (4) according to the peak area of –CH2S4– (A(–CH2S4–)) and –S4H (A(–S4H–)) as shown in Table 1.
| |
 | (4) |
Table 1 Calculation of molecular weight of PETS, PGC1 and PrGC1
| Sample |
A(–CH2S4–) |
A(–S4H) |
Mn (g mol−1) |
| PETS |
152.308 |
0.943 |
12728 |
| PGC1 |
105.867 |
0.894 |
9367 |
| PrGC1 |
98.042 |
0.903 |
8598 |
Results show that adding GO-Cl and rGO-Cl nanosheets leads to decrease in molecular weight whereas rGO-Cl causes more decrement in molecular weight. Lower molecular weight of PGC1 and PrGC1 may be ascribed to the reduction of reaction rate due to depression of chains' diffusion and hindrance effect of nanosheets.55 Also, GO-Cl can be dispersed in aqueous media better than rGO-Cl which causes less hindrance effect of nanosheets and higher molecular weight of PGC1 compared with PrGC1.
To show how polymerization affects the surface morphology of nanosheets, free PETS chains were removed by dissolution of PrGC1 in DMSO and separation of PETS-attached nanosheets by centrifugation at 10000 rpm. Fig. 5G and H show the SEM and TEM images of PETS-attached nanosheets. According to results, a continuous PETS coating on the surface of nanosheets is appeared in SEM image whereas more opaque surface in TEM image is another prove for attaching PETS on the surface.
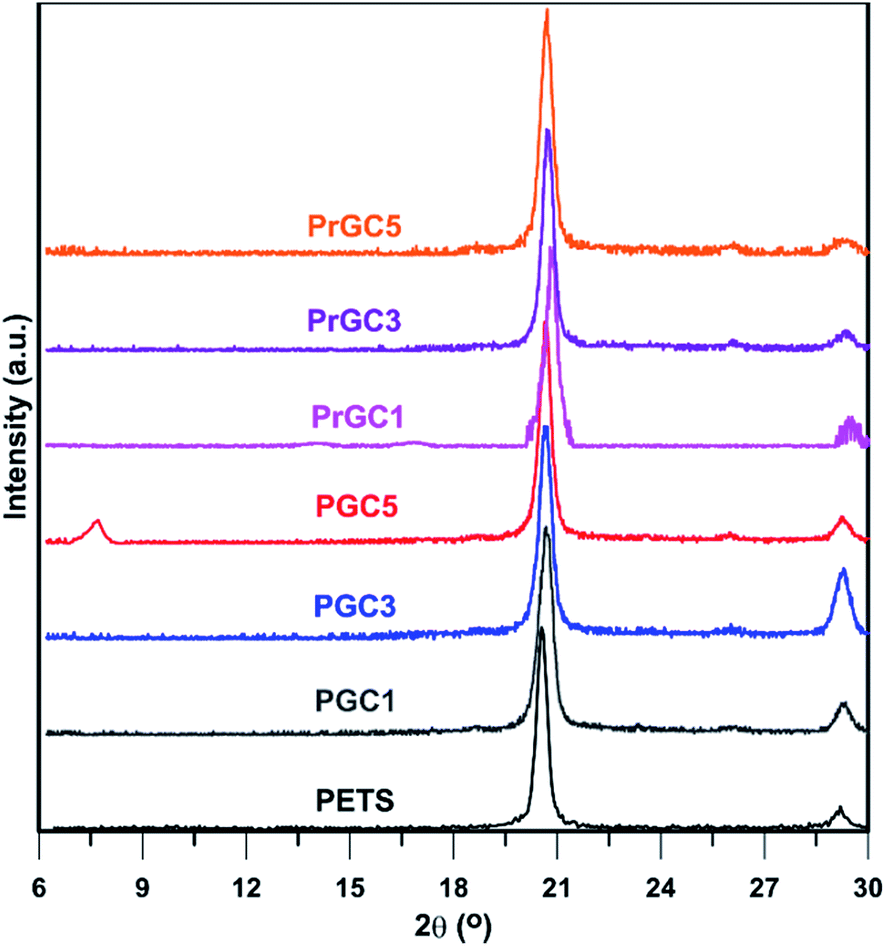
XRD analysis was used to study the dispersion of nanosheets in matrices. Fig. 6 shows the XRD patterns of neat polysulphide polymer (PETS) and GO-Cl and also, rGO-Cl-containing nanocomposites. All samples show a sharp peak at 20.7° and a peak at 29.3° originates from semi-crystalline structure of the synthesized polysulphides.18 These peaks appear due to the crystalline –C–C– fractions in the structure whereas amorphous fractions in the structure of polysulphide polymers are the dominate structure and induce the elastomeric behaviour.13 Thus, it can be concluded that the presence of GO-Cl and rGO-Cl nanosheets did not affect the formation of crystalline fractions. Morphology of layered nanofillers/polymer nanocomposites is commonly characterized as immiscible, intercalated, partially exfoliated, or exfoliated.56 The particular form depends on the nanoplatelets content, the chemical nature of the surface, and the synthetic method. In general, an exfoliated system is more feasible with low nanofiller contents while an intercalated structure is frequently observed in nanocomposites with higher nanoparticle contents. Accordingly, in nanocomposites with different content of GO-Cl, only nanocomposite with 0.5 wt% of nanosheets shows a weak peak around 7.7°. However, in samples with lower content of GO-Cl, no obvious peak related to nanosheets structure can be observed. This shows that PGC5 contains intercalated structure originates from the less tendency of nonpolar polysulphide polymer to relatively polar GO-Cl nanosheets. Also, participation of nanosheets in polymerization process increases their interactions with polymer matrix. Therefore, in lower contents of GO-Cl, probably an exfoliated or partially exfoliated morphology is achieved. Also, in rGO-Cl containing nanocomposites, no obvious peak related to rGO-Cl nanosheets can be seen. This phenomenon is ascribed to the less polarity of rGO-Cl nanosheets with respect to GO-Cl nanosheets that results in better interaction between polymeric matrix and nanosheets. Additionally, these nanosheets can participate in polymerization process which results in better interaction between nanosheets and polymer matrix. Conclusively, in all studied contents of rGO-Cl, probably an exfoliated or partially exfoliated morphology is achieved.
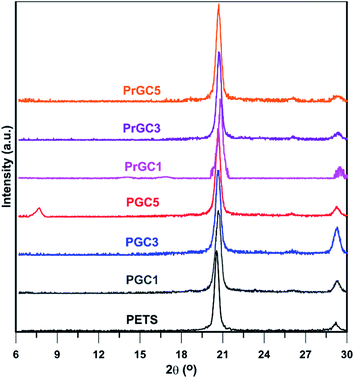 |
| | Fig. 6 XRD patterns of PETS and also, GO-Cl and rGO-Cl/PETS nanocomposites. | |
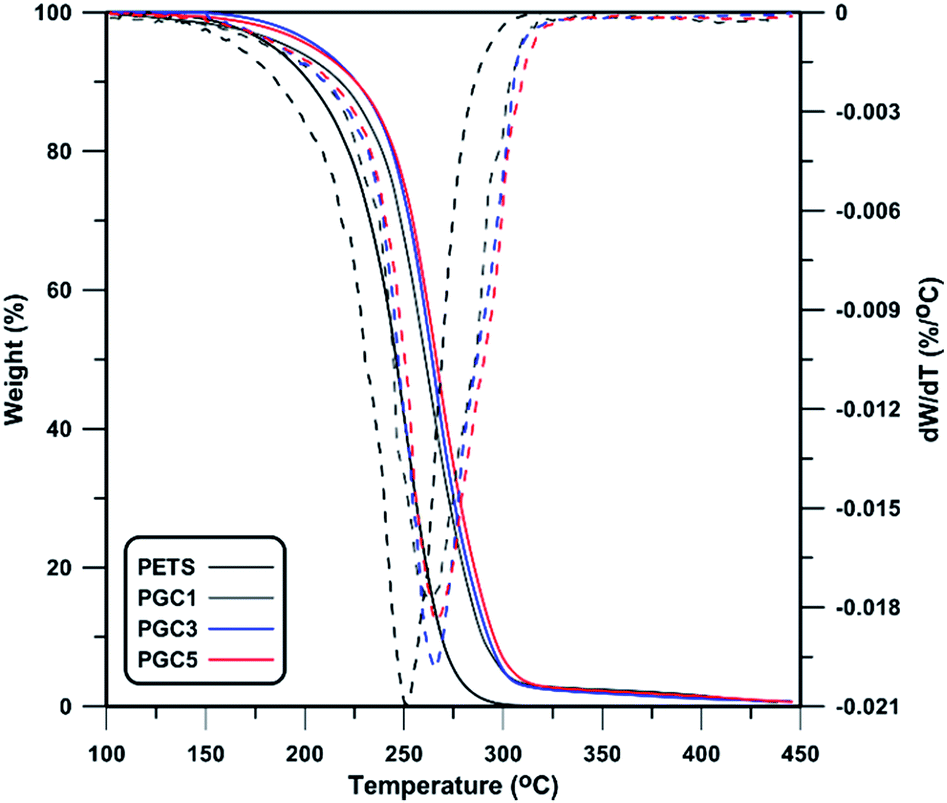
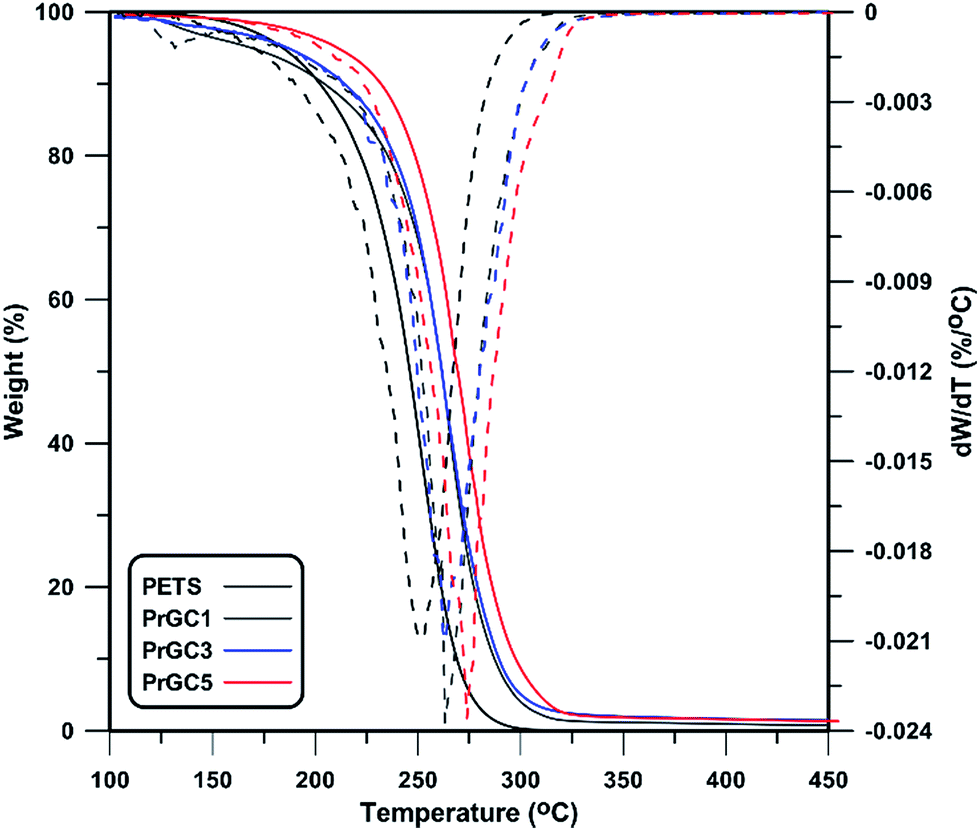
As described in previous sections, CPTES-modified graphene nanosheets contain –C–Cl groups that are polymerizable moieties at the surface and participate in polymerization. Thus, some chains can be attached at the surface of nanosheets as confirmed by SEM and TEM images in Fig. 5. This helps nanosheets to have better interaction with PETS matrix and conclusively better thermal stability of nanocomposites. As shown in Fig. 7 and 8, TGA technique was used to study thermal stability of prepared nanocomposites. Also, some thermal properties of nanocomposites are summarized in Table 2. According to the results, thermal stability of all the nanocomposites is higher than the neat PETS. PETS contains aliphatic C–C and C–S bands with low thermal stability. This leads to degradation of backbone in low temperature of 251.7 °C. By adding different contents of GO-Cl and rGO-Cl, T0.1 (temperature of 10 wt% of mass loss) increases while 0.5 wt% of rGO-Cl shows the highest improvement of T0.1. However, in lower contents, GO-Cl shows better thermal performance with respect to rGO-Cl. Considering molecular weight of matrix and thermal stability of the nanosheets, higher molecular weight of polymers results in higher thermal stability57 whereas GO-Cl nanosheets are decomposed in lower temperature as shown in Fig. 2. Also, as confirmed by 1H NMR results, polymer matrix of GO-Cl containing nanocomposites has higher molecular weight with respect to rGO-Cl containing ones. Thus, in lower contents of nanosheets, higher molecular weight of matrix results in better thermal stability of GO-Cl containing nanocomposites. However, when 0.5 wt% of nanosheets was used, thermal stability of nanosheets plays the main role and prevents the degradation of nanocomposites in lower temperatures. Considering T0.5 (temperature of 50 wt% of mass loss) and Td,max (peak temperature of DGT thermogram) as parameters showing thermal stability, trends as T0.1 as are seen. Also, higher content of nanosheets results in noticeable improvements in thermal stability of nanocomposites compared to neat polymer, expressed by a shift in the degradation temperature to higher one. The origin of this noticeable increase in decomposition temperature is assigned to ability of layered nanoparticles to obstruct the volatile gas produced by thermal decomposition. According to “barrier model”,58 thermal decomposition commences from the surface of the nanocomposites and leads to an increase in the content of nanosheets and formation of a protective layer by nanosheets. Also, nanoconfinement presents a more specific description of the phenomenon. According to this theory, newly formed radicals derived from degradation of polymer are nanoconfined by graphene platelets followed by a variety of bimolecular reactions.59 As degradation progresses, graphenes migrate gradually to the surface and form a barrier due decrease in surface free energy. Additionally, carbonaceous nanoparticles like carbon nanotubes and graphene act as radical scavengers and their surfaces' defects react with produced radicals from decomposition process.60,61 This further prevents more degradation of matrix and subsequently higher thermal stability is achieved.
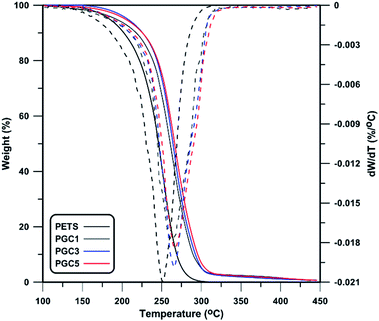 |
| | Fig. 7 TGA and DTG thermograms for GO-Cl/PETS nanocomposites. | |
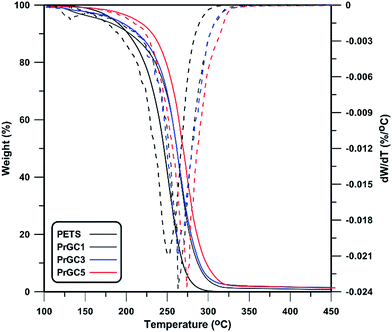 |
| | Fig. 8 TGA and DTG thermograms for rGO-Cl/PETS nanocomposites. | |
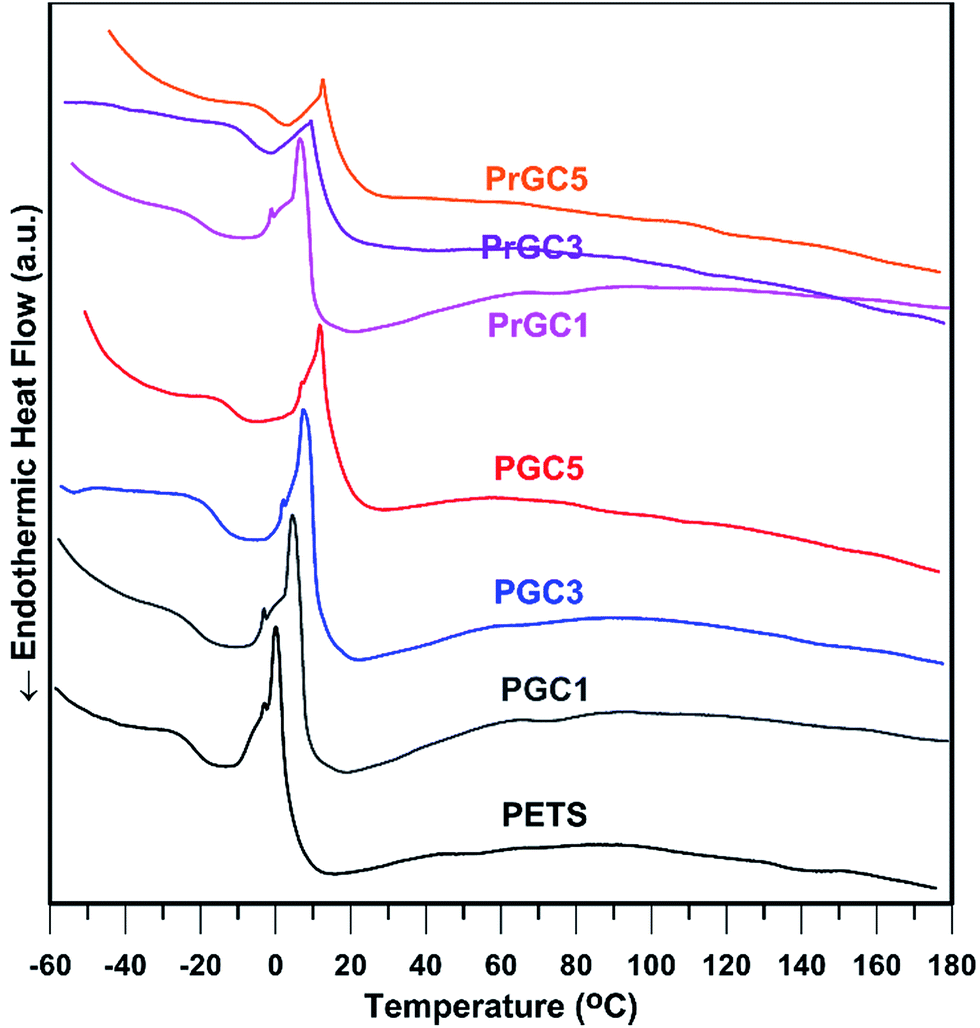
Table 2 Thermophysical properties of GO-Cl and rGO-Cl/PETS nanocomposites
| Sample |
TGA |
DTG |
DSC |
| T0.1 (°C) |
T0.5 (°C) |
Td,max |
Tg (°C) |
Tcc (°C) |
Tm (°C) |
| PETS |
201.4 |
246.0 |
251.7 |
−25.2 |
0.2 |
12.4 |
| PGC1 |
217.2 |
260.1 |
263.0 |
−23.2 |
4.3 |
15.4 |
| PGC3 |
225.6 |
263.2 |
265.2 |
−19.1 |
7.8 |
20.0 |
| PGC5 |
225.1 |
266.0 |
265.9 |
−14.0 |
11.9 |
26.1 |
| PrGC1 |
204.1 |
261.8 |
263.2 |
−20.6 |
6.3 |
17.0 |
| PrGC3 |
213.8 |
261.4 |
263.7 |
−10.4 |
9.9 |
22.6 |
| PrGC5 |
231.8 |
269.2 |
273.9 |
−4.8 |
12.4 |
27.5 |
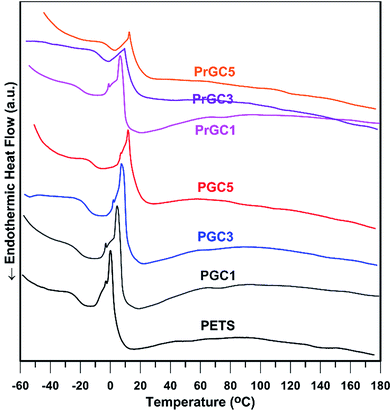
Thermal transitions of all samples were studied by DSC under nitrogen atmosphere as shown in Fig. 9. Also, summarized results are shown in Table 2. Each sample was initially heated from ambient temperature to 150 °C in order to remove residual volatile components and thermal history. Then, all samples were cooled to −80 °C at the cooling rate of 10 °C min−1, followed by heating from −80 to 190 °C at the same heating rate. According to the results, all samples exhibit transition temperatures typically observed for PETS; a glass transition temperature (Tg), a cold crystallization (Tcc) and subsequent melting transition (Tm). However, according to Allahbakhsh et al.18 PTES only showed a Tm at 77.8 °C that does not meet our results. To ensure that which thermal behaviour could be more accurate, PETS, PGC1 and PrGC1 were subjected to XRD analysis after thermal annealing (10 min at 60 °C and cooling down to ambient temperature) to study their crystal structure (Fig. 10). XRD results depicted that after annealing, all samples show a broad peak around 21.7° with a slightly sharp climax. Conclusively, after annealing of samples, amorphous structure is more predominant structure whereas a little crystalline structure exists due to cooling of samples down to ambient temperature.62 Thus, no distinct Tm is expected in higher temperatures. The effect of chain confinement due to nanosheets steric hindrance was evaluated by comparing Tg values of neat polysulphide polymer and nanocomposites. Also, all samples show Tg less than 0 °C whereas adding more nanosheets results in higher Tg values due to confinement effect of nanosheets. The rigid two-dimensional platelets exert a confinement on steric mobility of chains, and hence the motions of molecule segments, which cause higher Tg values. Also, when rGO-Cl is used as nanofiller, more increment of Tg is achieved. This is ascribed to the better interaction of rGO-Cl and higher steric hindrance to chain mobility with respect to GO-Cl as previously confirmed by TGA and XRD results. The exothermic peak just above Tg indicates cold crystallization, which is a kinetic effect resulting from incomplete crystallization of polymer chains as they are cooled below Tg.62 By heating above Tg, polymer chains regain sufficient mobility to complete crystallization that is known as cold crystallization.63 However, due to backbone structure of PETS, soft C–S and S–S linkages do not let polymeric chains form stable crystalline structure and subsequent melting of crystals is happened. Loading of modified graphene nanosheets confines mobility of chains; thus, higher temperatures are needed to cold crystallization of PETS chains. Conclusively, adding more nanosheets and their interactions with matrix are important factors in increasing Tcc whereas PrGC5 shows higher Tcc value. Also, as confirmed by XRD results after annealing (Fig. 10), formed crystals are unstable and immediately fuses. Therefore, cold crystallization coincides on melting of crystals as depicted in DSC thermograms. Also, Tm shows a trend as Tcc as and higher content of nanosheets and their surface chemistry play the main roles.
 |
| | Fig. 9 DSC thermograms for neat PETS and prepared nanocomposites. | |
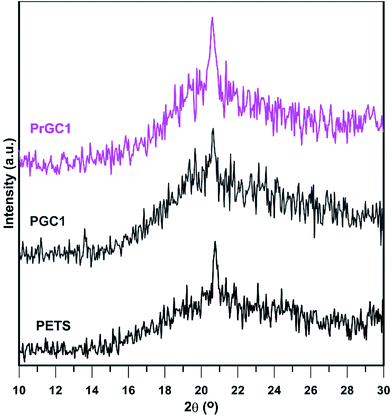 |
| | Fig. 10 XRD patterns of PETS, PGC1 and PrGC1 after annealing. | |
Conclusions
CPTES was grafted onto surface of GO to fabricate nanosheets able to participate in interfacial polymerization of EDC and Na2S4 (GO-Cl). GO-Cl nanosheets were reduced by hydrazine monohydrate (rGO-Cl) to study the effect of surface chemistry on polymerization kinetics and properties of synthesized nanocomposites. Different analysis methods were utilized to prove the success of modification and reduction processes such as FT-IR, TGA, XRD, and Raman. Conclusively, 17.9 wt% of CPTES was grafted onto surface that was visualized by a set of congeries in SEM and TEM images. 1H NMR results show that adding GO-Cl and rGO-Cl nanosheets leads to decrease in molecular weight whereas rGO-Cl causes more decrement in molecular weight due to depression of chains' diffusion and hindrance effect of nanosheets. Also, presence of GO-Cl and rGO-Cl nanosheets did not affect the formation of crystalline ethylene fractions of polysulphide polymers. Also, only nanocomposite with 0.5 wt% of GO-Cl nanosheets showed a weak peak in XRD related to nanosheets. This showed that PGC5 contain intercalated structure whereas all rGO-Cl containing nanocomposites probably had an exfoliated or partially exfoliated morphology. TGA results showed that thermal stabilities of all the nanocomposites are higher than the neat PETS whereas, the improvement of thermal stability was related to the molecular weight of matrix and thermal stability of the nanosheets. Accordingly, higher molecular weight of polymers resulted in better thermal stability while rGO-Cl containing nanocomposites due to higher stability of nanosheets showed higher thermal stability in higher loading of nanosheets. According to the DSC results, all samples exhibit the transition temperatures typically observed for PETS; a glass transition temperature (Tg), a cold crystallization (Tcc) and subsequent melting transition (Tm). However, XRD analysis after thermal annealing depicted that amorphous structure is more predominant structure which resulted in no distinct Tm at higher temperatures. All samples showed Tg less than 0 °C whereas adding more nanosheets resulted in higher Tg values due to confinement effect of nanosheets. Also, when rGO-Cl is used as nanofiller, more increment of Tg was achieved due to the better interaction of rGO-Cl and higher steric hindrance to chain mobility with respect to GO-Cl. PETS and prepared nanocomposites showed cold crystallization just above Tg whereas due to backbone structure of PETS, soft C–S and S–S linkages did not let polymeric chains to form stable crystalline structure and subsequent melting of crystals was happened. Also, adding more nanosheets and their interactions with matrix played the main roles in increasing Tcc and Tm.
References
- U. Lafont, H. van Zeijl and S. van der Zwaag, ACS Appl. Mater. Interfaces, 2012, 4, 6280 CAS.
- P. K. Guchhait, M. Rahaman, L. Nayak and T. K. Chaki, Int. Polym. Process., 2012, 27, 461 CrossRef CAS.
- D. Meili, Z. Weifang, H. Weiguo and L. Xiao, Mater. Sci. Forum, 2011, 689, 455 CrossRef.
- H. J. Kim, Y. H. Son, B. J. Han, J. E. Jung and S. K. Park, J. Korea. Inst. Struct. Maint. Insp., 2013, 17, 74 Search PubMed.
- S. Sundarrajan, M. Surianarayanan and K. S. V. Srinivasan, J. Polym. Sci., Part A: Polym. Chem., 2005, 43, 638 CrossRef CAS.
- L. Ramakrishnan and K. Sivaprakasam, J. Polym. Res., 2009, 16, 623 CrossRef CAS.
- M. Sheydaei, M. Kalaee, A. Allahbakhsh, E. O. Moradi-e-rufchahi, M. Samar, G. Moosavi and N. Sedaghat, Des. Monomers Polym., 2013, 16, 191 CrossRef CAS.
- A. V. Tobolsky, R. B. Beevers and G. D. T. Owen, J. Colloid Sci., 1963, 18, 353 CrossRef.
- T. C. P. Lee, Rapra Rev. Rep., 1999, 9, 9 Search PubMed.
- H. Zou, W. Xu, Q. Zhang and Q. Fu, J. Appl. Polym. Sci., 2006, 99, 1724 CrossRef CAS.
- S. Bahadur and C. Sunkara, Wear, 2005, 258, 1411 CrossRef CAS.
- S.-C. Han, M.-S. Song, H. Lee, H.-S. Kim, H.-J. Ahn and J.-Y. Lee, J. Electrochem. Soc., 2003, 150, A889 CrossRef CAS.
- A. H. Haghighi, M. Sheydaei, A. Allahbakhsh, M. Ghatarband and F. S. Hosseini, J. Therm. Anal. Calorim., 2014, 117, 525 CrossRef CAS.
- M. Nikdel, M. Salami-Kalajahi and M. Salami Hosseini, RSC Adv., 2014, 4, 16743 RSC.
- H. Roghani-Mamaqani, V. Haddadi-Asl, K. Khezri, M. Salami-Kalajahi and M. Najafi, Polym. Eng. Sci., 2015, 55, 1720 CAS.
- H. Roghani-Mamaqani, V. Haddadi-Asl, K. Khezri and M. Salami-Kalajahi, RSC Adv., 2014, 4, 24439 RSC.
- H. Roghani-Mamaqani, V. Haddadi-Asl, K. Khezri and M. Salami-Kalajahi, Polym. Int., 2014, 63, 1912 CrossRef CAS.
- A. Allahbakhsh, M. Sheydaei, S. Mazinani and M. R. Kalaee, High Perform. Polym., 2013, 25, 576 CrossRef.
- B. Pana, J. Zhao, Y. Zhang and Y. Zhang, J. Macromol. Sci., Phys., 2012, 51, 1218 CrossRef.
- C.-Y. Chang, S.-P. Ju, J.-W. Chang, S.-C. Huang and H.-W. Yang, RSC Adv., 2014, 4, 26074 RSC.
- N. Vanparijs, S. Maji, B. Louage, L. Voorhaar, D. Laplace, Q. Zhang, Y. Shi, W. E. Hennink, R. Hoogenboom and B. G. De Geest, Polym. Chem., 2015, 6, 5602 RSC.
- P. Panahian, M. Salami-Kalajahi and M. Salami Hosseini, J. Polym. Res., 2014, 21, 455 CrossRef.
- M. Sarsabili, M. Parvini, M. Salami-Kalajahi and P. Ganjeh-Anzabi, Adv. Polym. Technol., 2013, 32, 21372 CrossRef.
- M. Sarsabili, M. Parvini, M. Salami-Kalajahi and A. Asfadeh, Iran. Polym. J., 2013, 22, 155 CrossRef CAS.
- M. M. Bernal, M. Martin-Gallego, I. Molenberg, I. Huynen, M. A. L. Manchado and R. Verdejo, RSC Adv., 2014, 4, 7911 RSC.
- L. Hatami, V. Haddadi-Asl, L. Ahmadian-Alam, H. Roghani-Mamaqani and M. Salami-Kalajahi, Int. J. Chem. Kinet., 2013, 45, 221 CrossRef CAS.
- M. Shabanian, N. Kang, J. Liu, U. Wagenknecht, G. Heinrich and D.-Y. Wang, RSC Adv., 2014, 4, 23420 RSC.
- F. Samadaei, M. Salami-Kalajahi, H. Roghani-Mamaqani and M. Banaei, RSC Adv., 2015, 5, 71835 RSC.
- N. Amirshaqaqi, M. Salami-Kalajahi and M. Mahdavian, J. Sol-Gel Sci. Technol., 2014, 69, 513 CrossRef CAS.
- M. Banaei and M. Salami-Kalajahi, Colloid Polym. Sci., 2015, 293, 1553 CAS.
- H. Roghani-Mamaqani, V. Haddadi-Asl, K. Khezri, E. Zeinali and M. Salami-Kalajahi, J. Polym. Res., 2014, 21, 333 CrossRef.
- Z. Tang, L. Zhang, C. Zeng, T. Lin and B. Guo, Soft Matter, 2012, 8, 9214 RSC.
- M. Torkpur-Biglarianzadeh and M. Salami-Kalajahi, RSC Adv., 2015, 5, 29653 RSC.
- M. Salami-Kalajahi, V. Haddadi-Asl, F. Behboodi-Sadabad, S. Rahimi-Razin and H. Roghani-Mamaqani, Polym. Compos., 2012, 33, 215 CrossRef CAS.
- N. Amirshaqaqi, M. Salami-Kalajahi and M. Mahdavian, Iran. Polym. J., 2014, 23, 699 CrossRef CAS.
- N. Amirshaqaqi, M. Salami-Kalajahi and M. Mahdavian, Corros. Sci., 2014, 87, 392 CrossRef CAS.
- S. Moqadam and M. Salami-Kalajahi, Halogenated sunflower oil as a precursor for synthesis of polysulfide polymer, 2015 DOI:10.1515/epoly-2015-0152.
- S. Park, J. An, J. R. Potts, A. Velamakanni, S. Murali and R. S. Ruoff, Carbon, 2011, 49, 3019 CrossRef CAS.
- G. Goncalves, P. A. A. P. Marques, C. M. Granadeiro, H. I. S. Nogueira, M. K. Singh and J. Grácio, Chem. Mater., 2009, 21, 4796 CrossRef CAS.
- Y. Jia-lin, C. Gui-jiao, C. Jun, Y. Wei, X. Bang-hu and Y. Ming-bo, New Carbon Mater., 2012, 27, 370 CrossRef.
- P. Panahian, M. Salami-Kalajahi and M. Salami Hosseini, Ind. Eng. Chem. Res., 2014, 53, 8079 CrossRef CAS.
- Z. Sun, V. Nicolosi, D. Rickard, S. D. Bergin, D. Aherne and J. N. Coleman, J. Phys. Chem. C, 2008, 112, 20264 Search PubMed.
- S. Stankovich, D. A. Dikin, R. D. Piner, K. A. Kohlhaas, A. Kleinhammes and Y. Jia, Carbon, 2007, 45, 1558 CrossRef CAS.
- J. Shen, Y. Hu, M. Shi, X. Lu, C. Qin and C. Li, Chem. Mater., 2009, 21, 3514 CrossRef CAS.
- H. Roghani-Mamaqani, V. Haddadi-Asl, K. Khezri, M. Salami-Kalajahi, M. Najafi, M. Sobani and S.-A. Mirshafiei-Langari, Iran. Polym. J., 2015, 24, 51 CrossRef CAS.
- N. H. Kim, T. Kuilab and J. H. Lee, J. Mater. Chem. A, 2013, 1, 1349 CAS.
- S. Rahimi-Razin, V. Haddadi-Asl, M. Salami-Kalajahi, F. Behboodi-Sadabad and H. Roghani-Mamaqani, J. Iran. Chem. Soc., 2012, 9, 877 CrossRef CAS.
- M. Salami-Kalajahi, V. Haddadi-Asl, F. Behboodi-Sadabad, S. Rahimi-Razin and H. Roghani-Mamaqani, Polym. Compos., 2012, 33, 215 CrossRef CAS.
- K. N. Kudin, B. Ozbas, H. C. Schniepp, R. K. Prud'homme, I. A. Aksay and R. Car, Nano Lett., 2008, 8, 36–41 CrossRef CAS PubMed.
- M. Nikdel, M. Salami-Kalajahi and M. Salami Hosseini, Colloid Polym. Sci., 2014, 292, 2599 CAS.
- M. R. Kalaee, M. H. N. Famili, M. Mortezaei and M. Zeeb, J. Sulfur Chem., 2010, 31, 247 CrossRef CAS.
- M. R. Kalaee, H. Mahdavi and M. H. N. Famili, J. Sulfur Chem., 2014, 35, 373 CrossRef CAS.
- D. W. Jenkins and S. M. Hudson, Macromolecules, 2002, 35, 3413 CrossRef CAS.
- D. S. Argyropoulos, Y. Hou, R. Ganesaratnam, D. N. Harpp and K. Koda, Holzforschung, 2005, 59, 124 CrossRef CAS.
- M. Salami-Kalajahi, V. Haddadi-Asl, S. Rahimi-Razin, F. Behboodi-Sadabad, H. Roghani-Mamaqani and M. Hemmati, Chem. Eng. J., 2011, 174, 368 CrossRef CAS.
- H. Roghani-Mamaqani, V. Haddadi-Asl and M. Salami-Kalajahi, Polym. Rev., 2012, 52, 142 CrossRef CAS.
- M. Salami-Kalajahi, V. Haddadi-Asl, S. Rahimi-Razin, F. Behboodi-Sadabad, H. Roghani-Mamaqani and M. Najafi, Int. J. Polym. Mater. Polym. Biomater., 2013, 62, 336 CrossRef CAS.
- K. Khezri, V. Haddadi-Asl, H. Roghani-Mamaqani and M. Salami-Kalajahi, J. Polym. Eng., 2012, 32, 235 CAS.
- S. Rahimi-Razin, M. Salami-Kalajahi, V. Haddadi-Asl and H. Roghani-Mamaqani, J. Polym. Res., 2012, 19, 9954 CrossRef.
- M. Salami-Kalajahi, V. Haddadi-Asl, F. Behboodi-Sadabad, S. Rahimi-Razin, H. Roghani-Mamaqani and M. Hemmati, Nano, 2012, 7, 1250003 CrossRef.
- S. Rahimi-Razin, V. Haddadi-Asl, M. Salami-Kalajahi, F. Behboodi-Sadabad and H. Roghani-Mamaqani, Int. J. Chem. Kinet., 2012, 44, 555 CrossRef CAS.
- W. Zhao, P. Fonsny, P. FitzGerald, G. G. Warr and S. Perrier, Polym. Chem., 2013, 4, 2140 RSC.
- C. C. Neikirk, J. W. Chung and R. D. Priestley, RSC Adv., 2013, 3, 16686 RSC.
Footnote |
| † Electronic supplementary information (ESI) available: Instrumentation, 1H NMR data. See DOI: 10.1039/c5ra20254j |
|
| This journal is © The Royal Society of Chemistry 2015 |
Click here to see how this site uses Cookies. View our privacy policy here.