 Open Access Article
Enhanced and homogeneous oxygen availability during incubation of microfluidic droplets†
Lisa
Mahler‡
ad,
Miguel
Tovar‡
ad,
Thomas
Weber
a,
Susanne
Brandes
bd,
Martin Michael
Rudolph
a,
Josef
Ehgartner
c,
Torsten
Mayr
c,
Marc Thilo
Figge
bd,
Martin
Roth
*a and
Emerson
Zang
*a
aBio Pilot Plant, Leibniz Institute for Natural Product Research and Infection Biology, Hans Knöll Institute, 07745 Jena, Germany. E-mail: emerson.zang@leibniz-hki.de; martin.roth@leibniz-hki.de
bApplied Systems Biology, Leibniz Institute for Natural Product Research and Infection Biology, Hans Knöll Institute, 07745 Jena, Germany
cInstitute of Analytical Chemistry and Food Chemistry, Graz University of Technology, 8010 Graz, Austria
dFaculty of Biology and Pharmacy, Friedrich Schiller University, 07743 Jena, Germany
First published on 18th November 2015
Abstract
Droplet microfluidic-based cell screening has the potential to surpass time- and cost efficiency of established screening platforms by several orders of magnitude, but so far lacks sufficient and homogeneous oxygen supply for large droplet numbers (>106), which is a key parameter affecting metabolism and growth of encapsulated cells. Here, we describe and validate an approach based on continuous carrier oil recirculation that ensures enhanced and homogeneous oxygen availability during mid and long-term incubation of picoliter droplets retained in a 3D-printed storage device. Using biotechnologically relevant microorganisms, we demonstrate that improved oxygen transfer results in three to eleven-fold increased biomass and highly elevated protein production with minimal inter-droplet variation. In fact, obtained yields are comparable to those achieved in conventional cultivation devices, so that screening strategies commonly applied in microtiter plates or shaking flasks can now be scaled down to pL-droplets, which offer highly enhanced throughput. In contrast to mere single-cell screening, this approach allows monoclonal cell and metabolite accumulation inside droplets resulting in elevated read-out signals and reduced variability associated to stochasticity in gene expression. Additionally, the range of screening strategies is broadened, since screening for increased biomass yields or mining for microbial natural products from complex environmental samples can now be targeted with pL-droplets. This development substantially improves the robustness and versatility of droplet-based cell assays, further consolidating pL-droplets as a powerful ultrahigh-throughput experimentation platform.
Introduction
Miniaturization of reaction volumes is a primary goal in biotechnological screening applications, enabling both reduced expenses on consumables and maximization of sample throughput.1 pL-droplet-based microfluidics allows a ∼106-fold reduction in reaction volume compared to 96-well plates (MTP) and features essential unit operations such as reagent addition, mixing, interrogation and sorting of droplets at rates above 1000 Hz.2–4 While there has been considerable progress in transferring MTP-based cell screening assays to droplet based protocols,5,6 implementation of appropriate droplet incubation methods has been mostly neglected. Although stable incubation of microfluidic emulsions for up to several weeks was enabled by engineering novel surfactants,7,8 oxygen supply of droplets has not been a research focus so far. Yet, this is particularly relevant in the context of cell-based assays, since oxygen availability drastically affects the physiological state of cells.9,10 Their genotypic distinctiveness is likely to be perturbed by phenotypic noise if oxygen cannot be provided sufficiently and homogeneously among all samples.11 In most cell-based applications, droplets are incubated as a non-agitated bulk,2,12–19 where oxygen supply solely relies on the superior solubility and diffusivity of gases in perfluorinated carbons (PFCs),20 which often compose the continuous phase of the emulsion. However, the continuous phase rapidly drains due to density differences, leaving only a thin PFC-layer of ∼10 nm between droplets8 that barely contributes to oxygen transport. Dissolved oxygen inside droplets is consumed within minutes as a consequence of cellular metabolic activity (ESI†) and is only replenished by diffusion from the boundaries of the droplet population towards the center of the emulsion. This process mainly takes place in the emulsion's aqueous phase (with lower diffusivity), thereby rapidly causing a gradient of dissolved oxygen across the bulk of droplets as well as low oxygen availability for droplets located in the center of the bulk (Fig. 1b, left). Notably, only a few studies have explicitly discussed restricted oxygen availability during cell-based assays (e.g.18,21–24) and existing solutions such as droplet-holding PDMS chips25 and thin-layer emulsion storage complicate handling and are limited in throughput and level of control.Here, we introduce an incubation system that readily controls oxygen supply and enhances gas transfer for millions of pL-droplets simultaneously. We validate our system by measuring the oxygen concentration inside droplets and comparing it to standard off-chip droplet incubation. As a result of enhanced oxygen transfer, biomass yield and recombinant protein expression in droplets are drastically increased, reaching levels similar to cultivation in MTP and shaking flask, while inter-droplet variations are reduced.
Results
Working principle of dynamic droplet incubation
The incubation system is based on continuously flowing perfluorinated oil HFE7500 (continuous phase) through a droplet population collected in a 3D printed incubator (Fig. 1a and S1†). Generated droplets are guided into the droplet incubation device, which has been previously filled with oil. Droplets enter the incubator through one of the lower inlets and accumulate in the upper section of the incubator due to the density difference between aqueous (∼1 g mL−1) and oil phase (∼1.7 g mL−1). Once filling is completed, droplets can be incubated either statically or dynamically. During dynamic droplet incubation (DDI) a constant top-to-bottom flow of perfluorinated oil through the densely packed droplet population in the incubation device is applied. In response to the interplay of drag and buoyancy, droplets are mixed, while retained in the incubator (Movie S1†). Furthermore, the average inter-droplet distance is increased, which is observed by an expanded volume fraction occupied by the bulk of droplets (Fig. 1b, right). Contrasting to DDI and as a negative control mimicking current standard off-chip droplet incubation approaches, the device also allows storage of emulsions without oil circulation – in the following referred to as static droplet incubation (SDI).Dynamic droplet incubation increases the oxygen transfer rate
To estimate the influence of DDI and SDI on oxygen transfer into droplets, we monitored the dissolved oxygen concentration (DO) inside pL-droplets during cell cultivation by means of nanosensor-based, oxygen-sensitive NIR-luminescence measurements (Fig. 2 and S3†). The DO is determined by the oxygen transfer rate (OTR) into the droplets and the oxygen uptake rate (OUR) of droplet-confined cells. Two distinct droplet populations, incubated either dynamically or statically, were generated from the same E. coli preculture to ensure equal initial oxygen consumption rates. Both droplet populations were inoculated at high cell densities (OD 1 ≈ 170 cells per droplet) to allow for similar initial oxygen consumption rates amongst all droplets.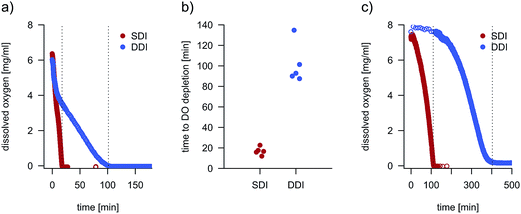 | ||
| Fig. 2 (a) Dissolved oxygen concentration (DO) over time during DDI and SDI in droplets containing E. coli cells. Droplets were oxygenated prior to the first measurement. Dotted lines mark the time points when the dissolved oxygen concentration falls below the detection limit. Further replicates are shown in Fig. S3.† (b) Comparison of time points when the DO reaches the detection limit in five replicate measurements of DO over time. The mean of dissolved oxygen depletion time for SDI (17 min, CV 22.8%) was tested as significantly lower than the mean for DDI (101.3 min, CV 19.1%) with a one sided Welch test (α = 0.05, p = 0.0002319). (c) Depletion of dissolved oxygen in statically and dynamically incubated droplets inoculated with less than 1 cell per droplet in average. | ||
For SDI, the lower DO detection limit was reached within 17 minutes, indicating that the oxygen transfer rate was much lower than the initial bacterial oxygen uptake rate. On the contrary, droplets incubated dynamically showed only a mild decline in dissolved oxygen, indicating a higher oxygen transfer rate in comparison to SDI. Since cell replication gradually increases the oxygen uptake rate, DDI also reached the lower detection limit, but only after 100 min. However, superior oxygen transfer is subsequently maintained with DDI. Using the dynamic method26 and a recirculation flow rate of 130 μL min−1, the OTR of the system was estimated to 5.5 mmol L−1 h−1 (Fig. S8†). With increased oil flow rates, the OTR reached nearly 20 mmol L−1 h−1, attaining the order of magnitude reported for microtiter plates or shake flasks.27
To mimic widely applied single-cell experimentation, droplets were also inoculated at lower cell densities (<1 cell per droplet, ESI†). Despite relatively large droplet volumes used in this study (170 pL), statically incubated droplets entered hypoxic conditions after approximately 110 minutes of incubation (Fig. 2c) – a timescale exceeded by far in most single-cell screening set-ups. In contrast, dynamically treated droplets with single-cell inoculation did not reach the lower detection limit until more than 400 minutes, and an elevated OTR compared to static conditions is assumed to occur hereafter.
By monitoring the droplet volume over time, we confirmed that DDI does not increase droplet fusion or breakage, even at high flow rates of the perfluorinated oil (Fig. S4†). Yet, oil recirculation fosters evaporation and causes a decrease in the average droplet volume. By fully enclosing the experimental setup into a chamber with 100% relative humidity, the droplet shrinkage was considerably diminished, enabling long-term droplet incubation.
Dynamic droplet incubation enhances cell growth
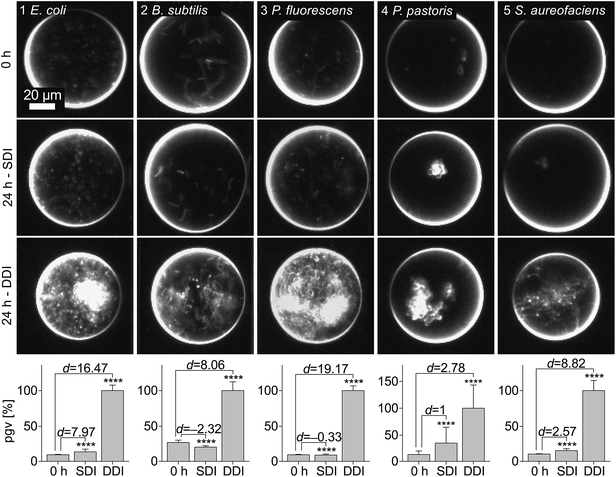
To validate our findings and assess the benefits of an enhanced oxygen transfer, we quantified the biomass production of Escherichia coli, Bacillus subtilis, Pseudomonas fluorescens, Pichia pastoris and Streptomyces aureofaciens in droplets by means of triggered imaging19 under darkfield illumination. The average gray value within the droplet borders (droplet gray value) was determined and subsequently correlated to cell density (Fig. S6†). To compare DDI and SDI, droplet populations (5 × 10⁶ droplets) were generated with the same cell or spore density. The biomass yield was evaluated after 24 h incubation (Fig. 3). Interestingly, both B. subtilis and the obligatory aerobic bacterium P. fluorescens exhibited growth only under DDI, evidencing the disadvantages of standard off-chip droplet incubation and concomitant low oxygen availability. Moreover, the enhanced oxygen availability during DDI resulted in significantly higher biomass production of all microorganisms, with yields three to eleven times higher than in statically incubated droplets and remarkably similar to those obtained with standard microbial cultivation methods. These findings are supported by a further experiment, in which we monitored cell density of E. coli over time in pL-droplets, MTPs and shaking flasks (Fig. 4). While cell densities in dynamically incubated droplets, MTPs and shaking flasks reached similar levels after 24 h (∼OD600 30), growth did not exceed ∼OD600 5 with static incubation. Thus, we conclude that dynamic incubation allows oxygen supply in droplets comparable to that in commonly applied cultivation and screening platforms.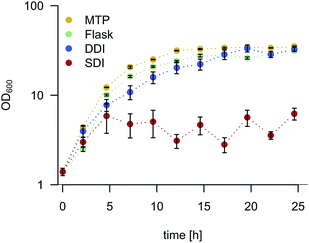 | ||
| Fig. 4 E. coli growth kinetics in cultures grown in MTP, shaking flask, and in droplets with DDI and SDI. A minimum of 1800 droplets were re-injected and analyzed per time point for SDI and DDI. Gray values were transformed into absorbance values via calibration (Fig. S5 and S6†). Error bars indicate one standard deviation. | ||
Dynamic droplet incubation ensures homogeneous oxygen availability
To compare the homogeneity of oxygen transfer during DDI and SDI, incubated droplet populations were continuously re-injected and analyzed for biomass. The droplets were sequentially grouped into fractions reflecting their position in the incubator (Fig. 5). For each fraction, statistic descriptors were calculated to assess differences within a droplet population. The fractions of the dynamically incubated population revealed high biomass yields at low variations, while on average lower yields and considerably higher variations were observed for SDI. Interestingly, the average biomass and corresponding standard deviation of the SDI fractions correlated with their position on the vertical axis of the incubator: the uppermost fraction and the lowest fractions in the incubator showed a significantly higher average in biomass with pronounced deviations among the droplets compared to the middle fractions. This inhomogeneity is explained by the increased oxygen availability at the boundaries between droplet bulk and perfluorinated oil. Clearly, DDI improves the homogeneity of oxygen distribution compared to SDI, since continuous mixing eliminates such boundary effects.Dynamic droplet incubation enhances protein yields
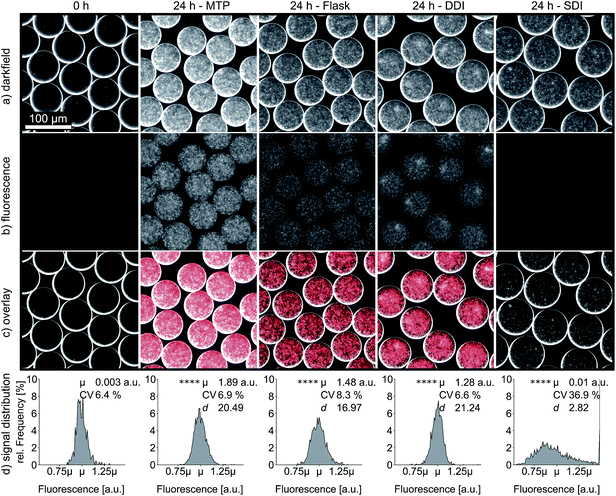
Improved oxygen transfer and homogeneity through DDI is also reflected in the expression of heterologous proteins, which is of fundamental interest for most screening applications with biotechnological background. Therefore, we investigated the expression of the fluorescent reporter protein mCherry by E. coli cells encapsulated in droplets. In this experiment, oxygen is not only required for effective cell propagation and protein synthesis, but also for post-translational maturation of mCherry to become fluorescent.28 We measured the emission intensity per droplet after 24 h of DDI and SDI, as well as for droplets that were generated from MTP and shaking flask cultures. The average fluorescence signal after dynamic incubation was 130-fold higher than the signal obtained after static incubation. Moreover, the fluorescence signal of dynamically incubated droplets reached similar intensities as droplets generated from MTP and shaking flask (Fig. 6). Again, the markedly reduced coefficient of variation for dynamically incubated droplets supports the previously observed superior homogeneity of oxygen availability during DDI. In a second experiment, we confirmed that DDI also leads to enhanced total yield of other recombinant proteins, in this case a camelid antibody fragment, independent of improved maturation (Fig. S7†).Continuous carrier oil circulation versus emulsion shaking
Since shaking is widely applied in small-scale cultivation to increase oxygen transfer, we additionally tested droplet incubation in shaken Eppendorf reaction tubes. Compared to non-agitated droplets, shaking enhanced the oxygen transfer, as indicated by a 3-fold elevated mCherry fluorescence of encapsulated E. coli cells (Fig. S11†). This is only slightly lower than the 4-fold signal increase obtained with DDI. The shear stress generated by shaking at 800 rpm (Thermomixer 5436, Eppendorf, Germany) did not significantly increase emulsion polydispersity within 24 h, although accumulation of much larger droplets was noticed on the emulsion surface (Fig. S9 and Table S4†). More importantly, shaken emulsions suffered from increased evaporation, observed as a loss in droplet volume two times higher than with DDI after one day. Therefore, shaking proved to be progressively detrimental to the emulsion quality, most likely as a consequence of direct contact between the emulsion and gas phase. Our incubation strategy has in contrast no gas-droplet interphase, thus allowing reduced evaporation and minimized emulsion failure while providing superior oxygenation. Although emulsion shaking provides an alternative to counteract limited and inhomogenous oxygen availability found in static droplet incubation, it is only usable for short term applications which do not require delicate and accurate emulsion handling.Discussion
So far, droplets have been statically stored in a wide variety of vessels, such as reaction tubes, syringes or droplet-holding chips, among others. None of these approaches has been established across different research groups as they not only lack reproducibility, but also suffer from poor handling properties and/or throughput limitations. These drawbacks are exacerbated when droplets are used for cell-based assays, where such incubation methods provide inadequate oxygen availability. Herein, we introduced dynamic droplet incubation, a method that allows enhanced and homogeneous oxygen transfer during mid and long-term incubation of an entire pL-droplet population. We hypothesize that during DDI (i) each droplet is predominantly surrounded by larger amounts of continuous phase which is constantly replenished with oxygen during recirculation and (ii) flow-induced convection enhances the oxygen mass transfer into the droplets. This strategy is easy to apply, maintains flexibility in droplet volume and is not limited to the number of incubated droplets. Using bacteria and yeasts with biotechnological relevance, we demonstrated that DDI results in higher biomass production with minimized inter-droplet variation. In fact, cell growth and recombinant protein production were shown to be, for the first time in droplets, comparable to larger-scaled standard cultivation devices as MTPs and shaking flasks. DDI allows droplet incubation during extensive time periods, with minimal emulsion failure and low evaporation. As an integrative part of the microfluidic flow path, our incubation device supports implementation of gapless assay protocols, avoiding manual droplet recovery from external vessels and ultimately facilitating process automation.We propose DDI to implement cultivation starting from single cells in droplets as a strategy to increase the biological activity per droplet irrespective of its size29 and level out the variability introduced by stochasticity in gene expression (intrinsic and extrinsic noise30–32) during screening assays. Furthermore, it can be expected that DDI drastically reduces the occurrence of false positives and negatives in many droplet-based cell assays, for which appropriate oxygen supply was neglected.12,13,16,17,29,33 Increased biomass production under aerobic conditions can serve as an alternative selection criterion, allowing strain optimization towards higher yields34 which was not achievable with previous incubation strategies. Besides, cultivation in droplets facilitates natural product mining to access yet untapped sources of biological activity.30,35–39 Various stages of growth accompanied by distinct metabolic profiles can be targeted, and demanding samples that include spores or other dormant cell types become amenable for investigation.40,41 This concept may be extended by cultivation of microbial communities in droplets to elicit valuable metabolic pathways that require inter-species crosstalk for derepression.42–46 Remarkably, DDI can alternatively be implemented with gas mixtures other than air, e.g. using nitrogen for the cultivation of anaerobic bacteria or 5% carbon dioxide for the propagation of mammalian cells. Different gases dissolved in the continuous phase may also serve as reactants or as inert gases for the chemical synthesis of complex compounds47,48 or materials.49,50
In conclusion, droplet-based screening platforms are now complemented with control over gas transfer – a previously unaddressed but highly relevant aspect in numerous droplet applications. The similarity between the obtained results in droplets with established experimentation techniques and the ease of use of our strategy will foster the adoption of picoliter droplets by a broader scientific community outside of microfluidics labs. With this contribution, droplet microfluidics is further tailored to ultimately supersede microtiter plates as the new state-of-the-art in assay miniaturization.
Experimental procedures
Incubator device fabrication and operation
The droplet incubator (Fig. S1†) was designed in-house and 3D-printed by i.materialise (Belgium) in transparent resin. The inner volume can hold 2.5 mL of fluid and was filled with ∼1 mL of droplets (corresponding to more than 5 million droplets of 170 pL). For fluidic access, flanged PTFE-tubing was fastened to the three inlets of the hollow body via threaded 10–32′′-connectors. After filling with droplets, the connection towards the microfluidic chip was closed (6) and the connection towards a peristaltic pump (Watson-Marlow, UK) was opened (7), creating a closed loop. For dynamic droplet incubation (Fig. 1a and b, right), the pump (3) maintained a continuous top-to-bottom flow of perfluorinated oil through the incubator, with an influx of oil through the top inlet and an efflux of oil through a bottom outlet. The closed loop comprised an oil reservoir between the peristaltic pump and the droplet incubator, which served as a gas exchange unit and a bubble trap. To avoid stagnant space during dynamic incubation and ensure complete removal of droplets upon reinjection, the transition between the upper inlet and the cylindrical body of the inner volume is conically shaped. If not stated otherwise, the oil flow during DDI was set to 130 μL min−1. For static droplet incubation, carrier oil circulation was suspended.Measurement of dissolved oxygen concentration within incubated droplets
For non-invasive monitoring of dissolved oxygen, pre-calibrated OXNANO sensor particles (PyroScience GmbH, Germany) loaded with an oxygen-sensitive and biocompatible dye (ex/em = 620 nm/770 nm) were co-encapsulated with E. coli cells suspended in a 10-fold diluted stock suspension for droplet generation. Excitation and detection of oxygen-dependent NIR-emission was performed with a Piccolo2 oxygen meter (PyroScience GmbH, Germany). All droplets present in the beam path at time of measurement contributed to the averaged signal. A two-point calibration of the oxygen measurement was performed prior to experimentation by sparging a nanoparticle suspension inside the droplet incubator with nitrogen and air, respectively. Prior to the first measurement, droplets were incubated for 5 minutes at 415 μL min−1 oil recirculation flow rate for re-oxygenation. The dynamic range of oxygen measurement is specified to ∼0.01–23.0 mg L−1 with a resolution of ∼0.005 mg L−1 at 1% O2 and ∼0.025 mg L−1 at 20% O2. All measurements were performed at 28 °C.Triggered imaging for cell density determination
Droplets were re-injected into a straight-channel chip, spaced with perfluorinated oil and detected in-flow with a photodiode, exploiting total internal light reflection at the phase boundary. The signal was amplified and transformed into a TTL signal to trigger a single image of each droplet.19 Stacks of droplet images were analyzed using a custom FIJI algorithm to detect droplet boundaries and determine the mean gray value as a measure of cell density.Statistical analyses
The open source software R was used for statistical analyses.51 Mean values were compared pairwise with a Welch corrected ANOVA to account for heteroscedasticity. Post hoc tests were performed with the packages multcomp and sandwich, using the Tukey test for every possible mean comparison or Dunnett's method for comparing means to a reference mean. Both methods for multiple comparisons of means were combined with a heteroscedastic consistent covariance estimation that accounted for heterogeneous variances and unbalanced group sizes.52Acknowledgements
The authors thank Annelie Pohle, Karin Martin and Karin Burmeister for excellent technical assistance and Hannah Pugh for proofreading. This work has been supported by MikroInfra, a project funded by the Thueringian Ministry of Education, Science and Culture (FKZ: 13008-715) and the European Fonds for Structural Development (CCI-Code 2007DE161PO001), and the Jena School for Microbial Communication (JSMC) which is funded by the German Excellence Initiative.References
- O. Gefen and N. Q. Balaban, Trends Biotechnol., 2008, 26, 345–347 CrossRef CAS PubMed.
- B. Kintses, L. van Vliet, D. S. R. A. Devenish and F. Hollfelder, Curr. Opin. Chem. Biol., 2010, 14, 548–555 CrossRef CAS PubMed.
- T. M. Tran, F. Lan, C. S. Thompson and A. R. Abate, J. Phys. D: Appl. Phys., 2013, 46, 114004–114020 CrossRef.
- S. Vyawahare, A. D. Griffiths and C. A. Merten, Chem. Biol., 2010, 17, 1052–1065 CrossRef CAS PubMed.
- M. T. Guo, A. Rotem, J. A. Heyman and D. A. Weitz, Lab Chip, 2012, 12, 2146–2155 RSC.
- A. Rakszewska, J. Tel, V. Chokkalingam and W. T. S. Huck, NPG Asia Mater., 2014, 6, e133 CrossRef CAS.
- J. Baret, Lab Chip, 2012, 12, 422–433 RSC.
- C. Holtze, A. C. Rowat, J. J. Agresti, J. B. Hutchison, F. E. Angilè, C. H. J. Schmitz, S. Köster, H. Duan, K. J. Humphry, R. A. Scanga, J. S. Johnson, D. Pisignano and D. A. Weitz, Lab Chip, 2008, 8, 1632–1639 RSC.
- M. D. Brennan, M. Rexius-Hall, L. J. Elgass and D. T. Eddington, Lab Chip, 2014, 14, 4305–4318 RSC.
- H. F. Zimmermann, T. Anderlei, J. Buchs and M. Binder, Appl. Microbiol. Biotechnol., 2006, 72, 1157–1160 CrossRef CAS PubMed.
- C. Dusny and A. Schmid, Environ. Microbiol., 2015, 17, 1839–1856 CrossRef PubMed.
- T. Beneyton, F. Coldren, J. C. Baret, A. D. Griffiths and V. Taly, Analyst, 2014, 139, 3314–3323 RSC.
- J. Clausell-Tormos, D. Lieber, J. C. Baret, A. El-Harrak, O. J. Miller, L. Frenz, J. Blouwolff, K. J. Humphry, S. Koster, H. Duan, C. Holtze, D. A. Weitz, A. D. Griffiths and C. A. Merten, Chem. Biol., 2008, 15, 427–437 CrossRef CAS PubMed.
- H. N. Joensson, M. Uhlen and H. Andersson Svahn, Lab Chip, 2011, 11, 1305–1310 RSC.
- L. Mazutis, J. Gilbert, W. L. Ung, D. A. Weitz, A. D. Griffiths and J. A. Heyman, Nat. Protoc., 2013, 8, 870–891 CrossRef CAS PubMed.
- M. Najah, R. Calbrix, I. Mahendra-Wijaya, T. Beneyton, A. Griffiths and A. Drevelle, Chem. Biol., 2014, 21, 1722–1732 CrossRef CAS PubMed.
- S. L. Sjostrom, Y. Bai, M. Huang, Z. Liu, J. Nielsen, H. N. Joensson and H. Andersson Svahn, Lab Chip, 2014, 14, 806–813 RSC.
- B. L. Wang, A. Ghaderi, H. Zhou, J. Agresti, D. A. Weitz, R. F. Gerald and G. Stephanopoulos, Nat. Biotechnol., 2014, 32, 473 CrossRef CAS PubMed.
- E. Zang, S. Brandes, M. Tovar, K. Martin, F. Mech, P. Horbert, T. Henkel, M. T. Figge and M. Roth, Lab Chip, 2013, 13, 3707–3713 RSC.
- N. S. Faithfull and J. G. Weers, Vox Sang., 1998, 74(suppl 2), 243–248 CrossRef CAS PubMed.
- L. Baraban, F. Bertholle, M. L. Salverda, N. Bremond, P. Panizza, J. Baudry, J. A. de Visser and J. Bibette, Lab Chip, 2011, 11, 4057–4062 RSC.
- L. Boitard, D. Cottinet, N. Bremond, J. Baudry and J. Bibette, Eng. Life Sci., 2015, 15, 318–326 CrossRef CAS.
- A. Huebner, D. Bratton, G. Whyte, M. Yang, A. J. Demello, C. Abell and F. Hollfelder, Lab Chip, 2009, 9, 692–698 RSC.
- S. Jakiela, T. S. Kaminski, O. Cybulski, D. B. Weibel and P. Garstecki, Angew. Chem., Int. Ed. Engl., 2013, 52, 8908–8911 CrossRef CAS PubMed.
- P. Abbyad, R. Dangla, A. Alexandrou and C. N. Baroud, Lab Chip, 2011, 11, 813–821 RSC.
- L. S. Michael and F. Kargi, Bioprocess engineering: basic concepts, Prentice-Hall, Englewood Cliffs, NJ, Upper Saddle River, NJ, 2002 Search PubMed.
- R. Hermann, M. Lehmann and J. Buchs, Biotechnol. Bioeng., 2003, 81, 178–186 CrossRef CAS PubMed.
- X. Shu, N. C. Shaner, C. A. Yarbrough, R. Y. Tsien and S. J. Remington, Biochemistry, 2006, 45, 9639–9647 CrossRef CAS PubMed.
- B. Kintses, C. Hein, M. Mohamed, M. Fischlechner, F. Courtois, C. Lainé and F. Hollfelder, Chem. Biol., 2012, 19, 1001–1009 CrossRef CAS PubMed.
- J. Q. Boedicker, M. E. Vincent and R. F. Ismagilov, Angew. Chem., Int. Ed. Engl., 2009, 48, 5908–5911 CrossRef CAS PubMed.
- M. B. Elowitz, A. J. Levine, E. D. Siggia and P. S. Swain, Science, 2002, 297, 1183–1186 CrossRef CAS PubMed.
- B. M. Martins and J. C. Locke, Curr. Opin. Microbiol., 2015, 24, 104–112 CrossRef CAS PubMed.
- A. Theberge, F. Courtois, Y. Schaerli, M. Fischlechner, C. Abell, F. Hollfelder and W. S. Huck, Angew. Chem., Int. Ed. Engl., 2010, 49, 5846–5868 CrossRef CAS PubMed.
- H. Bachmann, M. Fischlechner, I. Rabbers, N. Barfa, F. B. dos Santos, D. Molenaar and B. Teusink, Proc. Natl. Acad. Sci. U. S. A., 2013, 110, 14302–14307 CrossRef CAS PubMed.
- H. B. Bode, in Insect Biotechnology, ed. A. Vilcinskas, Springer, Netherlands, 2011, pp. 77–93 Search PubMed.
- L. Ma, J. Kim, R. Hatzenpichler, M. A. Karymov, N. Hubert, I. M. Hanan, E. B. Chang and R. F. Ismagilov, Proc. Natl. Acad. Sci. U. S. A., 2014, 111, 9768–9773 CrossRef CAS PubMed.
- S. J. Pidot, S. Coyne, F. Kloss and C. Hertweck, Int. J. Med. Microbiol., 2014, 304, 14–22 CrossRef CAS PubMed.
- J. Piel, Annu. Rev. Microbiol., 2011, 65, 431–453 CrossRef CAS PubMed.
- J. J. Zhang and B. S. Moore, eLife, 2015, 4, e06453 Search PubMed.
- J. T. Lennon and S. E. Jones, Nat. Rev. Microbiol., 2011, 9, 119–130 CrossRef CAS PubMed.
- E. Zang, M. Tovar, K. Martin and M. Roth, in Micro-Segmented Flow, ed. M. J. Köhler and B. P. Cahill, Springer-Verlag, Berlin, Heidelberg, 2014, pp. 231–265 Search PubMed.
- S. Bertrand, N. Bohni, S. Schnee, O. Schumpp, K. Gindro and J. L. Wolfender, Biotechnol. Adv., 2014, 32, 1180–1204 CrossRef CAS PubMed.
- J. Park, A. Kerner, M. A. Burns and X. N. Lin, PLoS One, 2011, 6, e17019 CAS.
- V. V. Phelan, W. T. Liu, K. Pogliano and P. C. Dorrestein, Nat. Chem. Biol., 2011, 8, 26–35 CrossRef PubMed.
- E. A. Shank and R. Kolter, Curr. Opin. Microbiol., 2009, 12, 205–214 CrossRef CAS PubMed.
- M. Weitz, A. Muckl, K. Kapsner, R. Berg, A. Meyer and F. C. Simmel, J. Am. Chem. Soc., 2014, 136, 72–75 CrossRef CAS PubMed.
- A. Buitrago Santanilla, E. L. Regalado, T. Pereira, M. Shevlin, K. Bateman, L. Campeau, J. Schneeweis, S. Berritt, Z. Shi, P. Nantermet, Y. Liu, R. Helmy, C. J. Welch, P. Vachal, I. W. Davies, T. Cernak and S. D. Dreher, Science, 2015, 347, 49–53 CrossRef CAS PubMed.
- A. B. Theberge, E. Mayot, A. El Harrak, F. Kleinschmidt, W. T. S. Huck and A. D. Griffiths, Lab Chip, 2012, 12, 1320–1326 RSC.
- A. J. Demello, Nature, 2006, 442, 394–402 CrossRef CAS PubMed.
- R. Seemann, M. Brinkmann, T. Pfohl and S. Herminghaus, Rep. Prog. Phys., 2012, 75, 016601–016640 CrossRef PubMed.
- R Development Core Team, R: A Language and Environment for Statistical Computing 2008, Vienna, Austria.
- E. Herberich, J. Sikorski and T. Hothorn, PLoS One, 2010, 5, e9788 Search PubMed.
Footnotes |
| † Electronic supplementary information (ESI) available. See DOI: 10.1039/c5ra20118g |
| ‡ Authors contributed equally. |
| This journal is © The Royal Society of Chemistry 2015 |


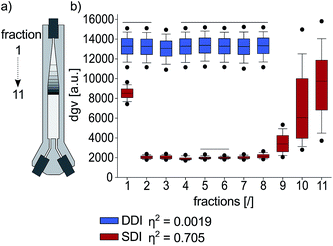
![[thin space (1/6-em)]](https://www.rsc.org/images/entities/char_2009.gif) 000 droplets. (b) Droplet population fractions after DDI (hatched) or SDI, with dots representing the 5th and 95th percentiles. Solid lines above boxplots indicate no significant difference between the covered fractions. Means for droplet gray values (dgv) of fractions were compared with Welch corrected ANOVA and Tukey's test (both
000 droplets. (b) Droplet population fractions after DDI (hatched) or SDI, with dots representing the 5th and 95th percentiles. Solid lines above boxplots indicate no significant difference between the covered fractions. Means for droplet gray values (dgv) of fractions were compared with Welch corrected ANOVA and Tukey's test (both 