Potential urine biomarkers from a high throughput metabolomics study of severe sepsis in a large Asian cohort

Qun Liang*a, Han Liub, Tianyu Zhanga, Yan Jianga, Haitao Xinga and Ai-hua Zhang*a
aICU Center, First Affiliated Hospital, School of Pharmacy, Heilongjiang University of Chinese Medicine, Heping Road 24, Xiangfang District, Harbin 150040, China. E-mail: qunliang1970@163.com; zhanghuaomics2@163.com; Fax: +86-451-86053141; Tel: +86-451-86053141
bSimon Fraser University (SFU), Burnaby, British Columbia, Canada

Received 25th September 2015 , Accepted 16th November 2015

First published on 17th November 2015


Abstract

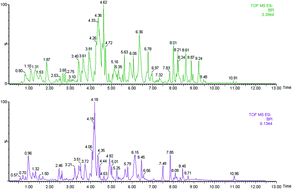
Severe sepsis (SS) is a main cause of death in hospitalized patients worldwide. There is an urgent need for accurate biomarkers for early diagnosis of SS. Metabolomics technologies allow high-throughput screening of metabolite biomarkers. Non-targeted mass spectrometry (MS) was used to characterize sensitive and economical peripheral biomarker(s) associated with the urine metabolome from SS patients. In this study, urine samples were obtained from controls and age-matched patients with SS. Metabolic differences among SS and control subjects were identified based on orthogonal signal correction-partial least squares discriminant analysis. Sphingosine, 5-methylcytidine, 3-dehydrocarnitine, 4-acetamido-2-aminobutanoic acid and phenyllactic acid in the SS subjects were significantly different from the control subjects. The receiver operating characteristic curve of the differential expression of these metabolites was also performed to demonstrate the utility of these biomarkers for diagnosis of SS. Three metabolites comprising sphingosine, 5-methylcytidine and 3-dehydrocarnitine were selected as candidate biomarkers and validation in separate and independent patient cohorts. Mass-spectrometry urine profiling proved to be an efficient and convenient tool for diagnosis and screening of SS in a high-risk population.


Introduction

Severe sepsis (SS) is a major cause of morbidity and mortality in neonates.1–3 Currently, the early diagnosis of this disease is scientifically challenging.4 Early recognition of SS and appropriate treatment increase survival rate; thus, developing new diagnostic tools may improve patients' outcomes. There is much enthusiasm and interest in SS biomarkers, particularly because sepsis is a highly lethal condition, its diagnosis is challenging. An ideal biomarker should rise rapidly and should have a good diagnostic window. Until now, efforts to stratify SS patients were hampered by the lack of specific biomarkers. Therefore, novel diagnostic technologies are urgently needed to diagnose SS at its early stage. In this regard, metabolomic analysis seems to be a promising method for determining metabolic variations correlated with SS.5,6 Metabolomic approach has the potential to discover metabolic profiles that could be used for diagnosis.7,8 Recently, this new science has gained an important role in the translational research of diagnostics.9 Urine is an easy, inexpensive, safe, and noninvasive biofluid and due to its potential to mirror systemic health conditions, urine metabolomics is considered a potential tool to monitor general disease status.10 Recently, research has identified a wide diversity of biomolecules in urine that can provide information for identifying potential biomarkers.11–13

SS is a major life-threatening condition in critically ill patients and it is well known that early recognition of SS improves patient outcome.14 Early strategies to diagnose, manage and predict outcome of sepsis are essential to further improve morbidity and mortality of sepsis. Langley and co-workers had used the integrative “omic” analysis for distinguishes human sepsis.15 Metabolomics is an emerging component of the systems biology approach for the discovery of clinically relevant biomarkers and potential therapeutic targets.16–18 Therefore, the identification of new diagnostic tools remains a priority for increasing the survival rate of SS patients. To explore urine biomarkers of SS, we applied mass-spectrometry metabolomics in positive ion mode to investigate the total complement of all low-molecular-weight molecules from SS patients and healthy volunteers, followed by multivariate data analysis. In this study, we have evaluated whether a combined MS-based metabolomics approach could be used for diagnosis evaluation of SS patients.

Experimental

Chemicals

Methanol (HPLC grade) and acetonitrile (HPLC grade) were provided by Fisher (USA). Distilled water was purified by Milli Q system (Millipore, Billerica, USA). Leucine enkephalin was provided by Sigma-Aldrich (St. Louis, MO, USA). Formic acid (HPLC grade) was purchased from J&K Chemical Ltd (Beijing, China).

Ethics statement and patient enrollment

The study was complied with the provisions of the Good Clinical Practice Guidelines and the Declaration of Helsinki. All patients and healthy volunteers were recruited from the emergency departments, First Affiliated Hospital, Heilongjiang University of Chinese Medicine. The detailed clinical characteristics of the study subjects are ESI Table 1. Urine samples from SS subjects on day 1 of enrollment were selected for metabolomic profiling.

Urine collection and preparation

Four hundred microliters of acetonitrile were added to 100 μL of urine and then vortexed for 1 min, and centrifuged for 10 min at a speed of 10[thin space (1/6-em)]000 rpm (4 °C). After that, 400 μL of supernatant was transferred in a freeze-dryer. Finally, the dried supernatant was dissolved with 100 mL water/acetonitrile (4[thin space (1/6-em)]:[thin space (1/6-em)]1, v/v) solution at 4 °C, and then the supernatant filtered through a 0.22 μm membrane. The urine was stored at −80 °C until analysis. Urine samples were thawed at room temperature before analysis.

UPLC chromatography

Urine samples were analyzed by ACQUITY fast ultra-high-performance liquid chromatography (UPLC)™ BEH column (2.1 × 100 mm, 1.7 μm, Waters corp., Milford, USA). The column was maintained at 40 °C. The injected sample volume was 3 μL for each run. The flow rate of the mobile phase was 0.4 mL min−1. Mobile phases were acetonitrile/water (50[thin space (1/6-em)]:[thin space (1/6-em)]50 v/v) containing 0.1% formic acid (solvent A) and acetonitrile/water (95[thin space (1/6-em)]:[thin space (1/6-em)]5 v/v) containing 0.1% formic acid (solvent B). Gradient elution was performed with the following solvent system: (A) 0.1% formic acid–water, (B) acetonitrile. The gradient was as follows: 1–10% A at 0–3.0 min, 10–30% A at 3.0–8.0 min, 30–50% A at 8.0–10.0 min, 50–90% A at 10.0–11.0 min, 90% A at 11.0–13.0 min.

Mass spectrometry

MS experiments were performed on a quadrupole-time-of-flight mass spectrometer (Waters corp., Milford, USA), and sample analysis was carried out under in positive ion mode. The mass scanning range was 100–1000 m/z in the full scan mode and the capillary temperature was 300 °C. The source temperature was 110 °C, and desolvation gas temperature was 350 °C. Nitrogen was used as cone and desolvation gas. The flow rates of cone gas and desolvation gas were set at 50 L h−1 and 450 L h−1. Capillary, cone and extraction cone voltages were set at 3.0 kV, 25 V and 5.0 V.

Metabolomics data pretreatment and analysis

Data acquisition and handling were performed by Masslynx 4.1 (Waters corp., Milford, USA). The peak finding, filtering, and alignment were performed by MarkerLynx application manager (Waters corp., Milford, USA). The MS matrix was then introduced to EZinfo 2.0 software for orthogonal signal correction-partial least squares discriminant analysis (OPLS-DA). From a supervised analysis it is possible to obtain the set of VIPs, “important variables on the projection”, the metabolite variables that contribute to the characterization of groups. Metabolites were identified by automated comparison of the ion features that included retention time, m/z, adducts, and fragments. Compound annotation was performed by comparing the MS/MS spectra and retention time of commercially available standard compounds.

Statistical analysis

Areas under curve (AUC) of receiver operating characteristic (ROC) curves were performed to determine the important metabolites using GraphPad Prism Version 5.00 (GraphPad Software, San Diego, California, USA). T test analysis of covariance was performed using SPSS software (version 19.0; SPSS, Inc., Chicago, IL).

Results

Typical base peak intensity chromatograms

In this study, the urine samples were analyzed by UPLC-MS. The separation conditions of urine samples were optimized. Typical base peak intensity (BPI) chromatogram of biosamples from the controls and SS cases in positive ion mode was shown in Fig. 1. More marked variations can be seen in the patient group than in the control group. The utilization of multivariate data analysis could enlarge metabolite identification.
image file: c5ra19875e-f1.tif
Fig. 1 Typical base peak chromatograms of control subjects (up) and SS patients (down) by UPLC-MS.

Urine metabolic phenotype of SS patients

Using the LC/MS analysis protocol and subsequent processes, we found 3279 retention time-exact mass pairs remaining in each sample profile. The variables were exported into EZinfo software for multivariate data analysis to detect metabolites, and the resulting data were analyzed using OPLS-DA classification model. The OPLS-DA model was generated with the first principal components (t1) to discriminate between groups (SS versus controls) reflecting a high goodness of fit and predictability as indicated by an R2Y value of 0.92 and a Q2 value of 0.83, respectively (Fig. 2). The controls were homogenously located in the right side of the plot, while SS samples were distributed in the left side. Interestingly, there were significant differences between the first component (P[1]) scores of controls and SS groups, which demonstrated that the OPLS-DA model was valid for positive ion mode.
image file: c5ra19875e-f2.tif
Fig. 2 Score plot of the OPLS-DA model of the UPLC-MS data from patients (red) and controls (green) group.

Abnormal metabolites associated with SS

We employed an additional multivariate statistical approach termed VIP-plot to select metabolites that contributed to this group behavior observed by OPLS-DA. VIP was used as an important parameter to select the interesting variables biomarkers for SS relative to the control group. Higher values of VIP indicate metabolites that are more important to the classification. Variables with VIP value greater than 11 were considered as great value. A T test was performed in variables with significant differences between SS cases and control individuals (P < 0.01) were retained. VIP-plot of SS patients vs. control individuals was shown in Fig. 3. Therefore, a total of 5 discriminate variables as interesting biomarker candidates were found in SS relative to the control group. Five variables were highlighted in VIP-plot (VIP > 11 and P < 0.001). Elemental composition was calculated using the Masslynx 4.1 software. And then, it was finally confirmed by comparison with standard sample. Eventually, 5 metabolites were tentatively identified as potential biomarkers including kynurenic acid, hippuric acid, glycine, 3-methyluridine, and acetylcysteine for early diagnosis of SS cases and were listed in ESI Table 2. These results suggested that combining UPLC-MS and multivariate data analysis techniques can be used for a comprehensive urine metabolomics analysis and screening biomarkers for the early diagnosis of SS cases.
image file: c5ra19875e-f3.tif
Fig. 3 VIP-plot for selection of interesting variables for patients with SS and age-matched healthy controls.

Potential usefulness of biomarkers

Coupling ROC curves to its AUC is a widely used method to estimate the diagnostic potential of a classifier in clinical applications. To assess the feasibility of diagnosis, we performed ROC analysis model selection in multiple-cross validation runs as described in the ‘Methods’ section. In all biomarkers, 3 potential biomarkers were up-regulated in urine of SS cases and 3 potential biomarkers were down-regulated. In order to characterize these potential biomarkers in early stage of SS, ROC analysis was performed. ESI Table 3 shows the detailed sensitivity, specificity levels and 95% confidence interval of the five identified potential urine biomarkers for SS early prediction. The values of AUC range from 0.800 to 0.985 indicated the potential capacity of these metabolites for distinguishing SS patients from normal control subjects. As a single biomarker in urine, kynurenic acid had a sensitivity of 96.2% and a specificity of 97.0% for early predicting SS. To demonstrate the utility of urine biomarkers for the early diagnosis of SS, 2 metabolites (AUC > 0.95) (kynurenic acid and glycine) were selected to form a biomarker group, indicates high predictive ability for SS patients.

Discussion

SS is a main cause of death among hospitalized patients worldwide.19 It is hoped that identifying the effect of SS on the metabolite composition of urine will improve both diagnosis and treatment. Urine testing is inexpensive, and easy to use and rapidly advancing in recent years. The collection of urine could reduce the discomfort for patients, particularly if repeated sampling is necessary. For the discovery of new biomarkers, various high-throughput omics technologies facilitate comprehensive screening of SS-specific biomarkers, especially metabolomics.20 Previous studies have demonstrated altered metabolites in plasma samples of SS patients.21–25 However, the sample size from many of them is relatively small and the metabolites are relatively limited. However, to our knowledge, in-depth study of the relationship between metabolite profile and SS is still needed.

LC/MS-based metabolomics protocols and discriminant analysis was used to construct a panel of urine metabolites that are altered in SS. Indeed, a growing number of studies have used MS-based metabolomics as a method of discovering biomarkers for diagnosing SS; however, these studies have largely used study groups of limited size and invasive sampling methods. UPLC-MS combined with multivariate data analysis approach could be an advanced tool to help us find metabolites with classifying of sample groups. We identified several metabolites specific for SS as the top 6 ranking biochemical markers in the VIP plot (see Table 1). Within our experiment, the metabolites obtained included kynurenic acid, hippuric acid, glycine, 3-methyluridine, and acetylcysteine. Furthermore, a panel of two candidate markers was found to differentiate the SS in urine, may serve as a diagnostic tool for SS detection.

Accurate diagnosis of SS may facilitate effective prevention and treatment of SS disease. In our work, an integrated UPLC with MS approach has been developed for performing global metabolomics analysis in human urine and identified potential biomarkers for the early diagnosis of SS. In an attempt to discover potential biomarkers that distinguish SS cases, multivariate statistical approaches were performed, which resulted in lists of potential biomarkers. Two urine biomarkers (kynurenic acid and glycine) yielded satisfactory accuracy, sensitivity, and specificity in distinguishing SS patients from the controls. ROC models yielded >95% accuracy of classifications, which suggested that the urine metabolic phenotype of SS patients was significantly different from that of normal controls. Those 2 metabolites combinations also indicated the possibility of evidence for potential prediction of SS. Our research provided highlights the potential advantages of the application of urine metabolomics in real clinical diagnostics.

Our findings have defined a panel of molecules whose levels are altered in the urine of SS patients. However, we have to consider some limitations in our study. First, we should consider the influence of drugs on the metabolites and drug-induced changes in metabolism. Further studies may need to be conducted to see if medication treatments are potentially confounding factors. Despite these limitations, we believe that the results reflect alterations in metabolites that are related to the pathomechanisms of SS. Future study in this field will be needed to determine how biomarker profiles differing disease characteristics and how the profiles change in response to treatment or with progression of disease.

Conclusions

In this study, we attempted to confirm and establish promising SS-specific urine metabolites. Urine is a readily available biofluid that may contain metabolites of interest for diagnosis of diseases. This study employed UPLC/MS technology to profile the metabolites in the urine of a cohort of SS patients and of individual controls. Metabolome data were subjected to multivariate analysis in order to discriminate between groups of SS patients and healthy controls, and then some key-compounds were identified as possible markers of SS. UPLC/MS-based urine metabolite profiling showed SS to be associated with a profound abnormality in metabolic phenotype. OPLS-DA model yielded class separation for SS cases and controls. Kynurenic acid, hippuric acid, glycine, 3-methyluridine, and acetylcysteine in the urine, of the SS cases were significantly different from the control subjects. ROC analysis revealed kynurenic acid and glycine are potent discriminators of the between SS and control groups. These findings suggest the potential of LC/MS-based metabolomics as a method to identify urine biomarkers for SS, which could be confirmed by future translational research with human patients.

Conflict of interest

The authors declare no competing financial interests.

Acknowledgements

This work was supported by grants from the Natural Science Foundation of Heilongjiang Province of China (H2015038), Youth Innovative Talent Program of Heilongjiang Province of China (UNPYSCT-2015118), Key Program of Natural Science Foundation of State (No. 81302905, 81470196).

References

  1. K. A. Stringer, J. G. Younger, C. McHugh, L. Yeomans, M. A. Finkel, M. A. Puskarich, A. E. Jones, J. Trexel and A. Karnovsky, Whole Blood Reveals More Metabolic Detail of the Human Metabolome than Serum as Measured by 1H-NMR Spectroscopy: Implications for Sepsis Metabolomics, Shock, 2015, 44(3), 200–208 CrossRef CAS PubMed.
  2. B. Mickiewicz, P. Tam, C. N. Jenne, C. Leger, J. Wong, B. W. Winston, C. Doig, P. Kubes and H. J. Vogel, Alberta Sepsis Network. Integration of metabolic and inflammatory mediator profiles as a potential prognostic approach for septic shock in the intensive care unit, Crit. Care, 2015, 19, 11 CrossRef PubMed.
  3. L. Su, H. Li, A. Xie, D. Liu, W. Rao, L. Lan, X. Li, F. Li, K. Xiao, H. Wang, P. Yan, X. Li and L. Xie, Dynamic changes in amino acid concentration profiles in patients with sepsis, PLoS One, 2015, 10(4), e0121933 Search PubMed.
  4. K. R. Walley, Biomarkers in sepsis, Curr. Infect. Dis. Rep., 2013, 15(5), 413–420 CrossRef PubMed.
  5. V. Fanos, P. Caboni, G. Corsello, M. Stronati, D. Gazzolo, A. Noto, M. Lussu, A. Dessì, M. Giuffrè, S. Lacerenza, F. Serraino, F. Garofoli, L. D. Serpero, B. Liori, R. Carboni and L. Atzori, Urinary (1)H-NMR and GC-MS metabolomics predicts early and late onset neonatal sepsis, Early Hum. Dev., 2014, 90, S78–S83 CrossRef CAS PubMed.
  6. A. Dessì, G. Corsello, M. Stronati, D. Gazzolo, P. Caboni, R. Carboni and V. Fanos, New diagnostic possibilities in systemic neonatal infections: metabolomics, Early Hum. Dev., 2014, 90, S19–S21 CrossRef.
  7. Q. Liang, C. Wang and B. Li, Metabolomics of alcoholic liver disease: a clinical discovery study, RSC Adv., 2015, 5, 80381–80387 RSC.
  8. I. Rowe, M. Chiaravalli, V. Mannella, V. Ulisse, G. Quilici, M. Pema, X. W. Song, H. Xu, S. Mari, F. Qian, Y. Pei, G. Musco and A. Boletta, Defective glucose metabolism in polycystic kidney disease identifies a new therapeutic strategy, Nat. Med., 2013, 19(4), 488–493 CrossRef CAS PubMed.
  9. T. J. Wang, M. G. Larson, R. S. Vasan, S. Cheng, E. P. Rhee, E. McCabe, G. D. Lewis, C. S. Fox, P. F. Jacques, C. Fernandez, C. J. O'Donnell, S. A. Carr, V. K. Mootha, J. C. Florez, A. Souza, O. Melander, C. B. Clish and R. E. Gerszten, Metabolite profiles and the risk of developing diabetes, Nat. Med., 2011, 17(4), 448–453 CrossRef CAS PubMed.
  10. Y. Zhang, Y. Dai, J. Wen, W. Zhang, A. Grenz, H. Sun, L. Tao, G. Lu, D. C. Alexander, M. V. Milburn, L. Carter-Dawson, D. E. Lewis, W. Zhang, H. K. Eltzschig, R. E. Kellems, M. R. Blackburn, H. S. Juneja and Y. Xia, Detrimental effects of adenosine signaling in sickle cell disease, Nat. Med., 2011, 17(1), 79–86 CrossRef CAS PubMed.
  11. L. Guo, M. V. Milburn, J. A. Ryals, S. C. Lonergan, M. W. Mitchell, J. E. Wulff, D. C. Alexander, A. M. Evans, B. Bridgewater, L. Miller, M. L. Gonzalez-Garay and C. T. Caskey, Plasma metabolomic profiles enhance precision medicine for volunteers of normal health, Proc. Natl. Acad. Sci. U. S. A., 2015, pii, 201508425 Search PubMed.
  12. T. J. Wang, M. G. Larson, R. S. Vasan, S. Cheng, E. P. Rhee, E. McCabe, G. D. Lewis, C. S. Fox, P. F. Jacques, C. Fernandez, C. J. O'Donnell, S. A. Carr, V. K. Mootha, J. C. Florez, A. Souza, O. Melander, C. B. Clish and R. E. Gerszten, Metabolite profiles and the risk of developing diabetes, Nat. Med., 2011, 17(4), 448–453 CrossRef CAS PubMed.
  13. R. M. Onjiko, S. A. Moody and P. Nemes, Single-cell mass spectrometry reveals small molecules that affect cell fates in the 16-cell embryo, Proc. Natl. Acad. Sci. U. S. A., 2015, 112(21), 6545–6550 CrossRef CAS PubMed.
  14. X. Liu, H. Ren and D. Peng, Sepsis biomarkers: an omics perspective, Front. Med., 2014, 8(1), 58–67 CrossRef PubMed.
  15. R. J. Langley, J. L. Tipper, S. Bruse, R. M. Baron, E. L. Tsalik, J. Huntley, A. J. Rogers, R. J. Jaramillo, D. O'Donnell, W. M. Mega, M. Keaton, E. Kensicki, L. Gazourian, L. E. Fredenburgh, A. F. Massaro, R. M. Otero, V. G. Fowler Jr, E. P. Rivers, C. W. Woods, S. F. Kingsmore, M. L. Sopori, M. A. Perrella, A. M. Choi and K. S. Harrod, Integrative “omic” analysis of experimental bacteremia identifies a metabolic signature that distinguishes human sepsis from systemic inflammatory response syndromes, Am. J. Respir. Crit. Care Med., 2014, 190(4), 445–455 CrossRef CAS PubMed.
  16. A. Janzer, N. J. German, K. N. Gonzalez-Herrera, J. M. Asara, M. C. Haigis and K. Struhl, Metformin and phenformin deplete tricarboxylic acid cycle and glycolytic intermediates during cell transformation and NTPs in cancer stem cells, Proc. Natl. Acad. Sci. U. S. A., 2014, 111(29), 10574–10579 CrossRef CAS PubMed.
  17. A. H. Zhang, et al., Ultraperformance liquid chromatography-mass spectrometry based comprehensive metabolomics combined with pattern recognition and network analysis methods for characterization of metabolites and metabolic pathways from biological data sets, Anal. Chem., 2013, 85, 7606–7612 CrossRef CAS PubMed.
  18. A. H. Zhang, H. Sun and X. J. Wang, Recent advances in metabolomics in neurological disease, and future perspectives, Anal. Bioanal. Chem., 2013, 405, 8143–8150 CrossRef CAS PubMed.
  19. R. J. Langley, E. L. Tsalik, J. C. van Velkinburgh, S. W. Glickman, B. J. Rice, C. Wang, B. Chen, L. Carin, A. Suarez, R. P. Mohney, D. H. Freeman, M. Wang, J. You, J. Wulff, J. W. Thompson, M. A. Moseley, S. Reisinger, B. T. Edmonds, B. Grinnell, D. R. Nelson, D. L. Dinwiddie, N. A. Miller, C. J. Saunders, S. S. Soden, A. J. Rogers, L. Gazourian, L. E. Fredenburgh, A. F. Massaro, R. M. Baron, A. M. Choi, G. R. Corey, G. S. Ginsburg, C. B. Cairns, R. M. Otero, V. G. Fowler Jr, E. P. Rivers, C. W. Woods and S. F. Kingsmore, An integrated clinico-metabolomic model improves prediction of death in sepsis, Sci. Transl. Med., 2013, 5, 195ra95 Search PubMed.
  20. B. J. Blaise, A. Gouel-Chéron, B. Floccard, G. Monneret and B. Allaouchiche, Metabolic phenotyping of traumatized patients reveals a susceptibility to sepsis, Anal. Chem., 2013, 85, 10850–10855 CrossRef CAS PubMed.
  21. B. Mickiewicz, G. E. Duggan, B. W. Winston, C. Doig, P. Kubes and H. J. Vogel, Alberta Sepsis Network. Metabolic profiling of serum samples by 1H nuclear magnetic resonance spectroscopy as a potential diagnostic approach for septic shock, Crit. Care Med., 2014, 42(5), 1140–1149 CrossRef CAS PubMed.
  22. B. Mickiewicz, G. C. Thompson, J. Blackwood, C. N. Jenne, B. W. Winston, H. J. Vogel and A. R. Joffe, Alberta Sepsis Network. Development of metabolic and inflammatory mediator biomarker phenotyping for early diagnosis and triage of pediatric sepsis, Crit. Care, 2015, 19, 320 CrossRef PubMed.
  23. K. Kamisoglu, B. Haimovich, S. E. Calvano, S. M. Coyle, S. A. Corbett, R. J. Langley, S. F. Kingsmore and I. P. Androulakis, Human metabolic response to systemic inflammation: assessment of the concordance between experimental endotoxemia and clinical cases of sepsis/SIRS, Crit. Care, 2015, 19, 71 CrossRef PubMed.
  24. S. M. Steelman, P. Johnson, A. Jackson, J. Schulze and B. P. Chowdhary, Serum metabolomics identifies citrulline as a predictor of adverse outcomes in an equine model of gut-derived sepsis, Physiol. Genomics, 2014, 46(10), 339–347 CrossRef CAS PubMed.
  25. D. E. Leaf, A. Raed, M. W. Donnino, A. A. Ginde and S. S. Waikar, Randomized controlled trial of calcitriol in severe sepsis, Am. J. Respir. Crit. Care Med., 2014, 190(5), 533–541 CrossRef CAS PubMed.

Footnote

Electronic supplementary information (ESI) available. See DOI: 10.1039/c5ra19875e

This journal is © The Royal Society of Chemistry 2015
Click here to see how this site uses Cookies. View our privacy policy here.