I. V. Ananyev*a,
I. S. Bushmarinova,
I. E. Ushakovab,
A. I. Aitkulovaa and
K. A. Lyssenkoa
aA. N. Nesmeyanov Institute of Organoelement Chemistry, Russian Academy of Sciences, 28 Vavilova str., 119991 Moscow, Russian Federation. E-mail: i.ananyev@gmail.com; Fax: +7 499 135 50 85
bHigher Chemical College, Russian Academy of Sciences, 125047 Moscow, Russian Federation
First published on 9th November 2015
Short strong hydrogen bonds within crystals of sodium and potassium hydrofumarates were investigated by means of high-resolution and multitemperature X-ray diffraction studies. Various parameters, including geometry data, displacement parameters and cation–anion interaction energy, are considered to discuss hydrogen atom disorder. The influence of cation–anion interactions, being mainly electrostatic in nature, on the H-bond peculiarities is discussed. Equations interlinking the distance and energy of metal-oxygen interactions are introduced for carboxylates of sodium and potassium.
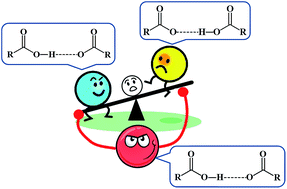
However, such the simple proton transfer model has to be sophisticated in any particular case since the symmetry of DWP and corresponding depths of potential minima are governed both by the nature of D and A atoms and their environment. Even in case of chemically equivalent groups containing H-bonded atoms the weak non-covalent interaction can still dictate the relative stability of a particular molecular graph to a large extent.6
The clear observations of weak interactions role can be in principle done by simple diffraction studies of a single crystal and consequent crystal packing analysis. However quantitative data can be vital to study peculiarities of a hydrogen bond DWP.7 The topological analysis of charge density function ρ(r) derived e.g. from multipole refinement against high resolution X-ray diffraction (XRD) data in most cases provides unambiguous determination of any binding interaction in crystal;8 furthermore this technique allows one to estimate energy of any weak interaction8,9 that can be helpful to construct a model of an asymmetric DWP.
Nevertheless, the analysis of the charge density topology at a particular temperature gives only incomplete “thermodynamic” picture and provides no information about dynamic features of a structure such as possible proton transfer. On contrary atomic displacement parameters (ADPs), which are also obtained within XRD studies, are more helpful in this respect since they do not only depend on vibrational characteristic, being in ideal case mean-square displacement amplitudes of atomic motion, but also absorb any shortcomings of structure model such as unresolved disorder which is an intrinsic consequence of atomic places superposition.10 For an H atom involved in a H-bond one can consider three possibilities: it may be always located only at one position and, hence, be not disordered; it may be statically, temperature-independently disordered over two positions without any motion between them if donor and acceptor fragments are similar enough; in case of proton transfer it may be disordered dynamically, i.e. two positions may repopulate with temperature. Clearly, to establish one of the possibilities a temperature evolution of both geometry and ADPs should be examined.7
Various studies based on both mentioned experimental XRD techniques were carried out to analyze peculiarities of SSHB potential as a function of different types of weak non-covalent interactions such as van der Waals contacts6 and even other H-bonds.11 At the same time the influence of stronger and less directional ionic interactions has not been yet considered (to our knowledge) though their interplay with SSHB is worth discussing since it clearly can be presented in various biological systems containing s-metal cations (see ref. 12, for instance). Taking it into account the hydrofumarates of sodium (1) and potassium (2) were chosen as convenient model subjects for the present investigation. This choice allowed to directly comparing influence of interionic interactions on DWP in relation to the cation nature since crystals of both salts (1) do not have atoms in special position that could lead to an additional symmetry-imposed disorder and (2) are characterized by similar crystal packing motifs, being infinite chains of anions bonded by SSHB between carboxylate groups, common for such salts according to the Cambridge Structural Database (CSD).13 The current contribution presents an analysis of various XRD-based parameters of DWP in 1 and 2 such as geometric characteristics (O⋯O separation, proton peak location, bond distribution within carboxylate groups, metal⋯O distances), dynamic parameters (variation of ADPs and their temperature evolution) and ρ(r) features (cation–anion interaction energy); in addition, benefits and limitations of these parameters are also discussed in the context of a possible disorder of the H atom involved in SSHB.
The multipole refinement of ρ(r) functions for 1 and 2 was carried out against high-resolution XRD data (resolution 0.4 and 0.43 Å respectively) measured at 100 K within the Hansen–Coppens formalism15 using the XD program package16 with the core and valence electron density derived from wave functions fitted to a relativistic Dirac–Fock solution. The several refinement procedure for both 1 and 2 were used varying monopole parameter for the alkali metal from 0.1 to 0.3 (0.1 step) and the O(1)–H(1) distance (from 1.02 to 1.08 Å with 0.2 step). The refinement results (especially topological parameters of the ρ(r) function and alkali metal atomic charges) were found to be nearly independent on the monopole population for the alkali metal and O(1)–H(1) distances. In the final version of refinement the C–H and O–H bond distances were normalized to the DFT calculated values (∼1.08 and 1.05 Å, respectively in 1 and 1.08 and 1.06 Å, respectively in 2). Calculation of crystal structures of 1 and 2 were performed with CRYSTAL09 software package17 within density functional theory approach. The combination of PBE0 (ref. 18) functional with Grimme correction for dispersion interaction19 (PBE0-D2) and POB-TZVP basis set specially designed for solid-state calculations20 was used for geometry optimization. Cell parameters were approximated to 0 K using multitemperature X-ray diffraction data and were kept fixed during the optimization. The multipole refinement was carried out against F and converged to R = 0.0215, Rw = 0.0304 and GOF = 0.9223 for 3493 merged reflections with I > 3σ(I) (2θ < 120°) for 1 and R = 0.0163, Rw = 0.0229 and GOF = 0.8494 for 5742 merged reflections with I > 3σ(I) (2θ < 110°). The total electron density function was positive everywhere in both cases, and the maximum peaks of residual electron density located in the vicinity of the alkali metal atom was not more than 0.19 and 0.38 e Å−3 for 1 and 2 respectively. The topological analysis of the experimental ρ(r) function was carried out using the WINXPRO program package.21 The potential energy density v(r) was evaluated through the Kirzhnits' approximation22 for the kinetic energy density function g(r). Accordingly, the g(r) function is described as (3/10) (3π2)2/3[ρ(r)]5/3 + (1/72)|∇ρ(r)|2/ρ(r) + 1/6∇2ρ(r), what in conjunction with the local virial theorem (2g(r) + ν(r) = 1/4∇2ρ(r)) leads to the expression for v(r) and makes possible to estimate the electron energy density he(r).
Fig. 2 Coordination polyhedra of sodium and potassium cations in 1 (a) and 2 (b) respectively. Atoms are represented by probability ellipsoids of atomic displacements (p = 50%). |
O⋯O, Å | O–H–O, deg | O(1)–H(1), Å | H(1)⋯O(4), Å | |
---|---|---|---|---|
1 | 2.5060(7) | 177.8(19) | 1.008(16) | 1.498(16) |
2 | 2.4832(4) | 173.8(17) | 1.17(2) | 1.32(2) |
C(1)–O(1), Å | C(4)–O(4), Å | C(1)–O(2), Å | C(4)–O(3), Å | |
---|---|---|---|---|
1 | 1.3174(3) | 1.2866(3) | 1.2246(3) | 1.2462(3) |
2 | 1.2979(4) | 1.2951(4) | 1.2375(4) | 1.2378(4) |
Fig. 4 Residual electron density maps for 1 (a) and 2 (b) plotted without the contribution of the H(1) atom by OLEX2.25 Green surfaces denotes positive electron density at the ∼0.32 e Å−3 level. |
Interaction | d,a Å | ρ(r),b e Å−3 | ∇2ρ(r),b e Å−5 | he(r),c a.u. | v(r),c a.u. | Eint,d kcal mol−1 | Typee |
---|---|---|---|---|---|---|---|
a Metal–oxygen separations.b Values in corresponding bcp of ρ(r).c Estimations of energy densities according to Kirzhnitz model and local virial theorem.d Interaction energy Eint estimated as −0.5v(r).e Qualitative strength of a diatomic interaction (‘s’ – strong, ‘w’ – weak). | |||||||
Sodium hydrofumarate 1 | |||||||
Na(1)–O(1) | 2.3690(2) | 0.09 | 2.7 | 0.007 | −0.0144 | 4.5 | s |
Na(1)–O(2) | 2.3687(2) | 0.10 | 2.7 | 0.007 | −0.0144 | 4.5 | s |
Na(1)–O(3) | 2.4048(2) | 0.09 | 2.4 | 0.006 | −0.0124 | 3.9 | s |
Na(1)–O(3) | 2.4064(2) | 0.10 | 2.3 | 0.005 | −0.0124 | 3.9 | s |
Na(1)–O(4) | 2.3883(2) | 0.10 | 2.5 | 0.006 | −0.0133 | 4.2 | s |
Na(1)–O(4) | 2.5625(2) | 0.05 | 1.5 | 0.005 | −0.0067 | 2.1 | w |
Potassium hydrofumarate 2 | |||||||
K(1)–O(1) | 2.8063(3) | 0.08 | 1.6 | 0.004 | −0.0090 | 2.8 | w |
K(1)–O(2) | 2.8851(3) | 0.07 | 1.3 | 0.003 | −0.0071 | 2.2 | w |
K(1)–O(2) | 2.6762(3) | 0.11 | 2.2 | 0.004 | −0.0136 | 4.3 | s |
K(1)–O(3) | 2.7330(3) | 0.10 | 1.9 | 0.004 | −0.0108 | 3.4 | s |
K(1)–O(3) | 2.6734(3) | 0.11 | 2.2 | 0.005 | −0.0141 | 4.4 | s |
K(1)–O(4) | 2.9139(3) | 0.06 | 1.2 | 0.003 | −0.0065 | 2.0 | w |
K(1)–O(4) | 2.8621(3) | 0.07 | 1.3 | 0.003 | −0.0072 | 2.3 | w |
The coordinate bonds between counter-ions can be qualitatively divided into “strong” and “weak” ones according to M–O distances (Table 2). Thus, there is only one “weak” cation–anion interaction in 1 with the Na–O separation being 2.5659(6) Å while the Na–O distances in case of five other coordinate bonds are significantly shorter and lie in the narrow range from 2.3691(6) to 2.4087(6) Å. The larger coordination number of potassium in 2 leads to different distribution of cation–anion interactions: only three coordinate bonds can be considered as “strong” (corresponding K–O distances are in the range 2.6772(8)–2.7357(9) Å) and four K–O bonds are much weaker (2.8086(8)–2.9160(9) Å). Analyzing the influence of the cation nature on the SSHB one can note that in both cases the COOH group of the anionic chain forms less number of interionic interactions than the COO group, at that in 1 this qualitative difference is larger than in 2 (“weak” and “strong” Na–O bonds in 1 and “strong” K–O bond in 2). Such features of the carboxylate groups environment can explain the distinctions of the H-bond DWP in 1 and 2 and corresponding disorder in 2 since they must correlate with charge transfer peculiarities and the H-bond strength.
In order to unambiguously determine and quantitatively estimate such effects of crystal packing the topological analysis of the ρ(r) functions derived from high-resolution XRD studies was performed to estimate interionic interactions energy. One should note that the disorder of the H(1) atom may significantly affect the topology of the pseudostatic ρ(r) in the H-bond area, that additionally confuses the investigation.26 However following trends, observed for interionic interactions being to some extent distant from the H-bond, are the same in terms of both geometric and charge density analysis.
According to the geometry analysis and the search of (3, −1) bond critical points (bcp) of the experimental ρ(r) function the supramolecular environment of the carboxylate groups involved in the SSHB is composed by cation-anion and anion–anion interactions in both compounds. The anion–anion interactions (stacking, O⋯O and C–H⋯O in both 1 and 2) were found to be much weaker (see Table S3 in ESI†) than cation–anion ones. This implies that the major charge transfer influencing a DWP of the SSHB comes from a metal ion.
The topological analysis of the experimental ρ(r) function also revealed six and seven coordinate bonds in 1 and 2 respectively (Table 2). All these interactions correspond to the closed-shell type (∇2ρ(r) and electron energy density he(r) values in corresponding bcp are positive), that is expected for ionic bonds and means mainly electrostatic nature and corresponding significant separation of charge between bonded atoms. The energy of such interactions (Eint) was estimated using widely known semi-quantitative correlation of potential energy density v(r) in corresponding bcp.9 Apart from the refinement technique (see Experimental part) the Eint values are rather similar in 1 and 2 for metal–oxygen distances corresponding to bonds of the same qualtitative strength (“weak” or “strong”). The summary Eint value on the cation is only slightly smaller in 2 (21.7 vs. 23.1 kcal mol−1 in 1). This implies that the major difference of cation–anion bonding between 1 and 2 comes from different numbers of “weak” and “strong” interatomic interactions, which confirms simple geometric consideration given above. Note that the dependences of the Eint values on corresponding distances d can be fine fitted (with R2 > 0.9911) by power functions in both salts (in 1 Eint = 18670d−9.656, in 2 Eint = 35321d−9.149, see also Appendix A1 in ESI†), at that for the potassium cation this approximation was found to reasonably fit previously published values for potassium hydrophtalate crystals with the same coordination number of the cation.27 It not only confirms goodness of such energy estimations for coordinate bonds of such type but also indicates negligible variation of such estimations from different experiments and different samples.
Since the interionic interactions can influence the conjugation within carboxylate groups and corresponding charge distribution, the energies of M–O interactions were analyzed not only for the O(1) and O(4) atoms directly involved in the SSHB but also for the whole carboxylate groups. The total energies of cation–anion diatomic interactions for a carboxylate group are in agreement with the structural data (Table 2): the value for the formal anionic C(4)O(3)O(4) group (ECOO) is higher than that for the C(1)O(1)O(2) one (ECOOH) in both 1 and 2 and the difference between ECOO and ECOOH is significantly higher in 1 (∼5.0 vs. ∼3.0 kcal mol−1 in 2, Table 3). In the same manner the O(1) and O(4) atoms are more “similar” in terms of cation–anion interactions in the potassium salt: the difference between EO(1) and EO(4) values is smaller in 2 on 0.3 kcal mol−1 as compared with 1 (Table 3). The higher strength of the COO⋯cation bonding clearly causes formal accumulation of charge induced by charge transfer from the cation.
Evidently the cation nature is the main factor governing the H(1) atom position: the larger number of “weak” cation–anion interactions in 2 gives more channels of possible charger transfer from cation and hence evens out the charge density probabilities on the C(1)O(1)O(2) and C(4)O(3)O(4) groups. In turn, equalizing the charges of proton's donor and its acceptor leads in a limiting case to a symmetric H-bond with the same depths of energy minimums in case of DWP. In terms of XRD data it implies equalization of probability density function of a hydrogen atom in two positions and corresponding disorder.
In order to analyze the SSHB dynamics in both salts and investigate the H(1) atom disorder in more detail four additional XRD datasets were collected within the 150–300 K temperature range with 50 K step size. In general all the structure peculiarities do not depend on temperature significantly; in particular the interionic interactions become only slightly weaker upon heating and retain their qualitative difference in strengths (see Table S4†). Energy estimations according to the power fits given above shows that at 300 K the difference between ECOO and ECOOH is again pronouncedly larger in 1 (on 1.5 kcal mol−1, Table 3). Note, however, that the difference between EO(1) and EO(4) values in 1 becomes at 300 K nearly the same with such value for 2 at 100 K (Table 3).
The weaker bonding of the cation in 2 (at 300 K 21.4 vs. 23.1 kcal mol−1 in 1) is in agreement with the larger lengthening observed for the O(1)⋯O(4) distance of the SSHB in this salt upon heating up to 300 K (0.015 Å) as compared to the corresponding lengthening in the case of the SSHB in 1 (0.007 Å). Despite that in both salts the location of the H(1) atom changes only insignificantly upon heating as compared to XRD data at 100 K discussed above: even at 300 K it is in the same manner closer to the O(1) atom in 1 (O(1)–H(1) 1.02(2) Å, H(1)⋯O(4) 1.49(2) Å) and more centered between the oxygen atoms in 2 (O(1)–H(1) 1.17(3) Å, H(1)⋯O(4) 1.33(3)). Such static behavior can imply the absence of the proton transfer in both 1 and 2 in spite of the proposed disorder of the H(1) atom in the latter.
The analysis of ADP temperature evolution has revealed that potentials in which cation and anion vibrates are quite similar for 1 and 2. Both in 1 and 2 eigenvectors of ADP matrixes corresponding to maximal eigenvalues (λ1) for all non-hydrogen atoms are directed in nearly the same way at any temperature: the most displacements of oxygen and carbon atoms are nearly perpendicular to the planes of carboxylate groups and carbon skeleton while these vectors for metal ions are directed perpendicular to the H-bond line. Corresponding λ1 eigenvalues linearly increase on same values upon heating, at that they are very close in magnitude for the equivalent atoms at 100 K as well as at 300 K (see Tables 4 and S5, Fig. 5 and S1†). It is noteworthy that maximal ADP eigenvalues for carbon atoms are always smaller than those for oxygen ones; the ADP eigenvalues of the latter are very similar to the λ1 value of the metal cations within the whole temperature range (Fig. 5 and S1; Table S5†). It probably implies that the low-frequency displacements of oxygen atoms (such as torsion vibrations of carboxylate groups) correlate with displacements of the metal cation. The independence of this complex motion on the cation nature together with similarity of ADPs for other non-hydrogen atoms indicates similar vibration potentials of both crystal structures, which is in line with the values of total cation–anion interactions energy given above and allows calling 1 and 2 “isovibrational”.
T, K | O(1) | O(4) | Alkali metal | C(1) | ||||
---|---|---|---|---|---|---|---|---|
1 | 2 | 1 | 2 | 1 | 2 | 1 | 2 | |
100 | 0.0179 | 0.0178 | 0.0142 | 0.0164 | 0.0135 | 0.0145 | 0.0108 | 0.0117 |
300 | 0.0466 | 0.0447 | 0.0382 | 0.0395 | 0.0368 | 0.0377 | 0.0244 | 0.0251 |
Diff | 0.0287 | 0.0269 | 0.024 | 0.0231 | 0.0233 | 0.0232 | 0.0136 | 0.0134 |
The only meaningful distinctions between motion parameters in 1 and 2 are observed for the H-bonding area. While the equivalent ADP of non-hydrogen atoms (Ueq – one third of the trace of the harmonic ADP matrix) in 1 and 2 increase linearly upon heating, that is expected for any ordered structure, the temperature dependencies of the isotropic displacement parameter for the H(1) atom (Uiso) are of different nature in 1 and 2. In particular, in 1 the Uiso value upon heating increases similarly to that trend for both the equivalent ADPs (Fig. 6) and maximum eigenvalues of displacement matrixes of non-hydrogen atoms (Fig. 5) and becomes at 300 K (0.064(7) Å2) closer to the Uiso value of H(1) atom in 2 at 100 K (0.084(9) Å2). In 2 it is almost constant within the whole measured temperature range if one takes into account the standard uncertainty values. Note that the uncertainty values for the components of harmonic displacement matrixes and Ueq values of non-hydrogen atoms are always significantly less than 0.0005 Å2. In other words, while in 1 the difference between the Uiso and Ueq values can be explained by the large vibrational amplitude of the H(1) atom along the H-bond corresponding to the flat minimum on PES and increasing with the temperature increase, in 2 the Uiso value can be also determined by the unresolved static disorder: the superposition of atomic places with constant populations which is ascribed by the one ADP parameter. Indeed, the temperature-imposed proton transfer has to lead to a redistribution of atomic places populations that should provide a more complex curve of the Uiso temperature dependence and a pronounced shift of the effective position of the H(1) atom.
Fig. 6 Temperature dependence of mean-square displacement amplitudes (MSDA) of displacements for some heavy atoms (Ueq values) and the H(1) atom involved in SSHB (Uiso values) in 1 (a) and 2 (b). |
The temperature-independent Uiso value can in principle be observed for the SSHB with a very low barrier when the proton begins to shuttle over the barrier at low temperatures (<100 K in 2) and is delocalized between two positions at high temperatures.7 However, in this case the effective position of the H(1) atom might be found closer to the middle of the O(1)⋯O(4) separation. Although it is not observable within the measured temperature range one cannot exclude such process as well as features of quantum-mechanic tunneling effects.3,28 The results of XRD investigations of 2 and its deuterated analogue at lower temperatures which might give insight into this problem will be published elsewhere.
Analyzing various descriptors considered above one can note that the Uiso value of the H(1) atom together with geometric characteristics, such as C(4)O(4), C(1)O(1) O(1)H(1) and H(1)O(4) distances, indicate the H(1) atom disorder in the whole temperature range in 2. On the contrary, only one equilibrium position of the H(1) atom can be expected using geometric criteria in 1 that is in line with temperature evolution of its Uiso value. Taking into account nearly the same strength of H-bonds in 1 and 2, the rather close Uiso values for both salts (at 300 K in 1 and at 100 K in 2) could serve as a possible indication of the temperature-imposed H(1) atom disordering in 1, however in 1 the temperature dependence of the Uiso value is similar to the evolution of maximum eigenvalue of the O(1) and O(4) displacement matrixes that clearly demonstrates a significant contribution of others low-frequencies vibrations (such as carboxylate groups torsions) into the parameter of H(1) atom motion. While the cation–anion interactions cause similar potential of cation's motion apart from its nature, in both salts they do affect the SSHB potential to different extent. Given that the different charge accumulation on the proton donor and acceptor fragments can be the only reason of the variation of H(1) atom position in 1 and 2, the difference between cation–anion interaction energies calculated for the whole carboxylate group seems to be more demonstrative since the difference between EO(1) and EO(4) values in 1 at 300 K becomes nearly the same as in 2 estimated at 100 K (Table 3). In its turn, it implies the influence of charge distribution within carboxylate group on the DWP of SSHB and on the possible disorder of the H atom.
Taking into account that the energy estimations and geometric characteristics can both be helpful to elucidate the disorder of hydrogen atom involved in SSHB we have tried to verify given above power fits approximating energy/distance relation and simultaneously to confirm declared importance of ECOO/ECOOH difference for the DWP analysis using two examples from the CSD: sodium hydrogen trans-1-propene-1,3-dicarboxylate (refcode CARVAS) and potassium hydrogen diformiate (refcode KHDFRM05). Of course, this sample is very narrow and cannot be considered as a representative one, however it fully coincides with the data discussed above especially in the sense of the correlation between energy difference and geometric characteristics. Thus, in the CARVAS structure the hydrogen atom involved in the SSHB (O⋯O 2.484 Å) was refined at 0.884 Å from one oxygen atom (CO 1.303 Å) and at 1.604 Å from the another (CO 1.285 Å), which implies ordering of the hydrogen atom. The sodium cation (coordination number = 6) forms four interactions with the COO group and only two ones with the COOH group (see Table S6†); the corresponding ECOO/ECOOH difference calculated according to power fits is 3.7 kcal mol−1, while the EO(4)/EO(1) difference (with the corresponding labeling of oxygen atoms) is only 0.3 kcal mol−1 that is even smaller than in the disordered crystal of 2 at 300 K (Table 3). On the contrary, in KHDFRM05 the lengths of CO bond involved in the SSHB (O⋯O 2.442 Å) are very close to each other (1.281 and 1.279 Å) and the hydrogen atom is closer to the middle of the O⋯O separation (O–H 1.173 and 1.269 Å). Although the coordination number of the potassium ion is formally eight in this case the energy estimations (Table S6†) are in line with the possible hydrogen atom disorder: EO(4)/EO(1) difference in this case is 3.0 kcal mol−1 while the ECOO/ECOOH one is 3.4 kcal mol−1 that is slightly larger than this value for the disordered crystal of 2 at 100 K and smaller than this value for the ordered crystal of 1 at 300 K (Table 3).
We consider it useful to summarize the peculiarities of each derived parameter and to provide several additional comments. While the hydrogen atom position refined against XRD data should be always analyzed with caution, the inequality of the participating C–O bonds can serve as sign of the H-atom ordering within SSHB between hydrodicarboxylate anions even when their difference is only a few hundredths Å. On the other hand, one should keep in mind that the C–O bond lengthening can be also caused by other interactions with oxygen atoms, though the influence even of rather strong interactions with alkali metal ions is lower. Isotropic ADP of the hydrogen atom involved in SSHB can also serve as a disorder indicator, particularly when evaluated at different temperatures. However, it can also increase due to unrelated low-frequency vibrations. We suggest the Uiso values of <0.04 Å2 at 100 K and <0.07 Å2 at room temperature as the indication of the H-atom ordering (for protium) for the SSHBs with O⋯O separation less than 2.5 Å.
Another useful metric is the difference in energy between cation–anion interaction involving the H-donor and H-acceptor fragments. Our work demonstrates the strong influence of the charge distribution within the carboxylate group on the DWP of SSHB; here we present a numeric approximation for the alkali metal—carboxylate group interaction energy using the M–O distance for a given metal type as a predictor.
Sufficient difference in the total M–O interaction energy between carboxylate fragments participating in the SSHB leads to hydrogen ordering. We suggest ECOO − ECOOH < 3 kcal mol−1 as a cutoff value of the DWP asymmetry indicating the H-atom disorder. Such estimations of the cation–anion interaction energy can be used to forecast a hydrogen atom disorder and to tune possible proton transfer in related compounds by varying the cation nature. Similar approach can also be adapted to other structural tasks in which the analysis of M⋯O interactions plays crucial role, example being incomplete isomorphous replacement in crystals of alkali metals carboxylates.
Footnote |
† Electronic supplementary information (ESI) available: XD cif-files, crystallographic data, routine refinement details, structural information, charge density topological features for weak interactions, deformation density plots, temperature evolution of metal–oxygen distances, corresponding energies and atomic displacement parameters. CCDC 1427273–1427282. For ESI and crystallographic data in CIF or other electronic format see DOI: 10.1039/c5ra19870d |
This journal is © The Royal Society of Chemistry 2015 |