DOI:
10.1039/C5RA19602G
(Paper)
RSC Adv., 2015,
5, 90871-90880
Computational insights into inhibitory mechanism of azole compounds against human aromatase†
Received
22nd September 2015
, Accepted 12th October 2015
First published on 14th October 2015
Abstract
Human aromatase, also known as cytochrome P450 19A1, specifically catalyzes the conversion of androgens to estrogens, and therefore represents an important drug target for the treatment of breast cancer. Recently, azole compounds previously used as agricultural fungicides and antimycotic drugs were reported to exhibit potent inhibitory activity against aromatase. However, the molecular mechanism of these azole compounds against aromatase remains unclear. In this study, a combination of molecular docking and several types of molecular dynamics (MD) simulations including conventional MD, random acceleration MD and steered MD, was employed to investigate the interactions of aromatase with letrozole and imazalil, two azole compounds with distinct inhibitory activities against aromatase. The binding modes of these two inhibitors were obtained by molecular docking and refined by MD simulation. The binding free energies were calculated based on the MD snapshots by using the MM-GBSA method and were found to be in agreement with the relative potency of the experimental binding affinities. Our results further demonstrated that these inhibitors had different favorable unbinding pathways in aromatase, and the unbinding manners differed in their favorable dissociation routes. Several residues lining the pathways were found important for the inhibitor egress. These findings would be helpful not only for understanding the inhibitory mechanism of azole compounds against aromatase, but also for designing new aromatase inhibitors.
Introduction
Human aromatase, also known as cytochrome P450 19A1 (CYP19A1), is a member of the CYP superfamily. Aromatase is the only known enzyme that specifically catalyzes the biosynthesis of estrogens (estrone, 17β-estradiol, and 17β, 16α-estriol) from androgens (androstenedione (ASD), testosterone, and 16α-hydroxytestosterone).1,2 High levels of estrogens could lead to abnormal cellular proliferation, which is related to several diseases such as hormone-dependent breast cancer, endometriosis and gynecomastia.3 Thus, inhibition of aromatase has become an effective strategy to combat these diseases. Several aromatase inhibitors such as exemestane, anastrozole, and letrozole (LTZ) have become the clinically used drugs for the treatment of estrogen receptor positive breast cancer.4–6 However, the side effects of these drugs make researchers try to discover new aromatase inhibitors.
Due to the importance of aromatase as a drug target, lots of experimental and theoretical studies have been carried out to elucidate the catalytic mechanism and to unveil the three-dimensional structure of this enzyme. The catalytic process was proposed to accomplish via three-step consecutive oxidative reactions, by which ASD was firstly hydroxylated to 19-methyl-ASD and then aromatized the A ring through the C10–C19 bond cleavage process.7,8 Recently, the crystal structures of aromatase in complexes with ASD or steroidal inhibitors have been determined, which provides a basis for exploring the interactions of aromatase with ligands and for structure-based ligand design.9,10 Utilizing the crystal structure of aromatase, Galeazzi et al. and Suvannang et al. analyzed the binding modes of aromatase with its inhibitors by molecular docking and molecular dynamic (MD) simulations.11,12 Park et al. investigated the effect of protein environment on the binding of ASD in the active site of aromatase by using long-time MD simulations.13
Despite these efforts made to unveil the catalytic mechanism and interactions of aromatase with ligands, a full understanding of the ligand recognition mechanism of aromatase is still lacking. The crystal structure of aromatase exhibits a similar fold as other CYPs, in which the catalytic active site is deeply buried inside the protein fold. Thus, an intriguing question about aromatase is how substrates/inhibitors enter into or release from the buried active site. This issue is important because the ligand channel may influence the ligand recognition and catalytic activity of the enzyme. Sgrignani et al. recently found that there exist a few possible entry/exit routes for ASD and O2 passage in aromatase and the solvent channel is the most energetically favored pathway.14 Jiang et al. found that the F–G loop of aromatase has large flexibility, which renders this region to have a high possibility serving as a ligand access channel.15 However, studies from other CYPs suggested that the selection of the pathways might depend upon the type of CYPs and the specific properties of ligands.16–18 Apart from the canonical binding site above heme, Sgrignani et al. recently discovered that aromatase may possess multiple allosteric sites to recognize its inhibitors taxmoxifen metabolites.19 These sites are located at the surface of aromatase. Occupation of these peripheral sites may block substrate/inhibitor access and product release, which offers a new strategy for drug design. However, identification of these peripheral sites is challenging. Discovery of ligand unbinding channels is essential to achieve the goal, since the exit of the channels might serve as the peripheral binding site.
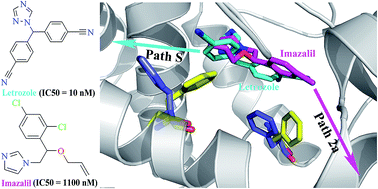
Azole compounds (imidazoles and triazoles) are widely used as antifungal drugs and their derivatives are also used as agricultural fungicides.20 Many azole compounds have been shown to disrupt the normal function of aromatase at the transcriptional and cell levels.21–23 Imazalil (IMZ), one of the azole fungicides, was recently reported to exhibit the inhibitory activity toward aromatase.24 IMZ shares an analogous heterocyclic scaffold with the most potent aromatase inhibitor LTZ, but the experimental data showed that these molecules exhibited distinctive IC50 (9.9 nM for LTZ vs. 1100 nM for IMZ) and Ki values (13 nM vs. 278 nM).24 At present, however, the mechanism underlying the different inhibitory activities of these two similar compounds remains unclear. In addition, whether these azole inhibitors share the same dissociation pathway(s) with the substrate ASD also remains to be answered. In this study, the binding modes of LTZ and IMZ were explored by molecular docking and MD simulation. The molecular mechanics/Generalized Born Surface Area (MM/GBSA) method was then employed to calculate the binding free energies and detect corresponding key residues that form interaction for ligand binding. After that, multiple random acceleration MD (RAMD) and steered MD (SMD) simulations were conducted to search the possible egress pathways and identify the most favorable pathway(s). The difference between these two ligands recognized by aromatase was finally discovered.
Methods
Structure preparation
The initial structures of the inhibitors LTZ and IMZ were obtained from ZINC.25,26 Due to a chiral center in IMZ, both R- and S-isomers were considered in this study. The ligands were geometrically optimized with the MacroModel module27 of the Schrödinger software package. The initial structure of aromatase was taken from Protein Data Bank (PDB). To date, there are several crystal structures available for aromatase. The crystal structure of aromatase complexed with ASD (PDB entry code 3S79) was chosen due to its highest resolution (at 2.75 Å). The crystal structure was then pretreated with the “Protein Preparation Wizard” workflow in Maestro version 9.3.28
Automated docking of LTZ and IMZ into the active site of aromatase was performed using GOLD version 5.2.29 The center of the grid was placed on the heme iron and the residues within 15 Å around the center were defined as the binding pocket. ChemScore with the specific parameters for heme-containing proteins was used for ranking the docking poses. Fifty outputs were generated for each docking run. All the output poses were clustered based on the root mean squared deviation (RMSD) values. The pose with the lowest ChemScore in each cluster was selected for subsequent MD refinement and simulation.
Setup of MD simulations
The starting structures for MD simulations were obtained from the docking poses of aromatase with LTZ or IMZ. The protonation states of the ionizable residues and histidines were determined based on the microenvironment and pKa values calculated by PROPKA.30 According to the calculation results, His109, His111, His171, His459, and His475 were assigned to be fully protonated at both nitrogen atoms. His105, His325, His402 and His480 were protonated at δ nitrogen and other histidine residues at ε nitrogen atoms. In addition, Asp309 was set in the neutral state according to previous experimental and computational studies.14,19,31
Geometric optimization and electrostatic potential calculation of LTZ and IMZ were conducted at the B3LYP/6-31G** level using Gaussian 03 [http://www.gaussian.com]. Atomic charges of the inhibitors were derived from the optimized structures by applying restrained electrostatic potential (RESP) fitting procedure.32 The force field, topology, and coordinate files of the inhibitor–aromatase complexes were generated by the Leap procedure of AMBER12.33 The aromatase complex models were solvated with TIP3P34 model water in a truncated octahedron periodic box with a margin of 10 Å along each dimension. Counterions were then added to neutralize the systems. For the purpose of comparison, the system of aromatase in complex with ASD was also prepared as the above procedure for the subsequent MD simulation.
Conventional MD simulations
The AMBER12 program was used to execute conventional MD simulations. The AMBER99SB all-atom force field and general AMBER force field (gaff) were employed for the proteins and inhibitors, respectively. The atomic charges for heme were obtained by quantum chemical calculation at the B3LYP level, which were described in our previous study.35 The force field constant parameters involving Fe were taken from the work by Harris et al.36 The detailed procedure for conventional MD simulations was adopted as described in our previous studies.37,38 Briefly, energy minimization was firstly carried out to relax the system by decreasing the harmonic force restraints to protein atoms. The systems were then gradually heated from 0 to 300 K under the NVT ensemble condition over 40 ps and followed by 70 ps equilibrium at 300 K. Finally, a 50 ns MD simulation was performed for each system under the NPT ensemble at 300 K and 1 atm. The bonds involving hydrogen atoms were constrained by the SHAKE algorithm.39 The Particle Mesh Ewald method40 was used to calculate the long-range electrostatic interactions. The time step and nonbonding interaction cutoff radius were set to 2 fs and 10 Å, respectively. Coordinate files were saved every 1.0 ps during the simulation process.
Random acceleration molecular dynamics (RAMD) simulations
The RAMD method41,42 was applied to the aromatase–inhibitor complexes to explore the possible inhibitor unbinding pathways in aromatase. RAMD is an enhanced sampling approach that can expulse a ligand from the buried protein active site to the protein surface within a relatively short time scale. In RAMD, a randomly oriented force is exerted on the ligand to accelerate its expulsion from the buried active site. The direction of the random force is maintained within a preset number of MD steps (N). After N steps of MD simulation, if the ligand reaches the predefined threshold distance (rmin), the force direction is kept; otherwise, a new random force direction is chosen randomly. By applying the RAMD approach, the ligand is able to unbiasedly search for the possible dissociation pathways without predefining the direction.
In the present study, two magnitude accelerations, 0.15 and 0.20 kcal Å−1 g−1 were used. These values can lead to the ligand successful unbinding from the active site with a relatively reasonable computational cost and have been adopted in several previous studies.37,38,43 The N was set to 40 steps. The threshold distance rmin was set to 0.005 and 0.01 Å, respectively. A simulation is terminated either when the simulation time has reached 3 ns or the ligand has moved 35 Å from its initial position. For each system, 50 simulation trajectories were generated by combining different RAMD parameters and random seeds. This resulted in a total of 150 RAMD simulations for the three aromatase complexes. Previous studies37,44,45 have shown that the starting structure has a minor effect on the ligand unbinding occurrence frequency. Therefore, the last snapshot of conventional MD simulation was used as the initial model for RAMD simulation.
Steered molecular dynamics (SMD) simulations
SMD46,47 is a simulation approach that applies an external restraint to the ligand to pull it out of the binding site along a predefined direction. The pulling directions were determined on the basis of the statistical results of RAMD simulations. The direction was defined by two atom groups, the initial location of the inhibitors in the aromatase binding site and the Cα atom of Arg435 (Path S) or the Cα atom of Ile345 (Path 2a). The constant-velocity SMD simulations were performed in the present simulation. The pull velocity was set to 0.01 Å ps−1, which has been adopted in our previous studies. A spring constant of 4 kcal mol−1 Å−2 was applied to the ligands based on the stiff spring approximation theory. To avoid the translation and rotation of the protein during SMD simulation, harmonic positional restraints were applied to the Cα atoms of Cys74, Cys299 and Leu321 as well as the heme Fe atom with a force constant of 50 kcal mol−1 Å−2. The pulling force that is exerted on the ligand is defined as:where k is the spring constant of the constraint; v is the pulling velocity; and x(t) is the position of the ligand at time t.
SMD simulations were run starting from the last snapshot structure of the conventional MD simulation. Twenty SMD simulations were repeatedly carried out using different random seeds for computing the maximum force and the sum of the force.
MM/GBSA binding free energy calculation
The binding free energy between the inhibitor and aromatase was calculated and then decomposed into the contributed residues with the MM-GBSA method,48,49 according to the following equations: |
ΔGbinding = Gcom − (Grec + Glig)
| (2) |
|
ΔGbinding = ΔGMM + ΔGsolv − TΔS
| (3) |
|
ΔGMM = ΔGint + ΔGelec + ΔGvdw
| (4) |
|
ΔGsolv = ΔGGB + ΔGSA = ΔGGB + γ(SASA) + b
| (5) |
where ΔGbinding is the binding free energy; ΔGMM is the gas-phase molecular mechanical energy containing internal (ΔGint), electrostatic (ΔGelec) and van der Waals energy (ΔGvdw) (eqn (4)); ΔGsolv is the solvation energy, which can be divided into polar and nonpolar components. The electrostatic solvation energy (ΔGGB) was calculated by the Generalized Born method. The interior dielectric constant was set to 1.0 and the exterior dielectric constant was set to 80.0. The non-polar solvation contribution (ΔGSA) was estimated using the LCPO algorithm50 from the solvent-accessible surface area (SASA, Å2) (eqn (5)). The coefficient surface tension γ and constant b were set to 0.0072 kcal mol−1 Å−2 and 0, respectively. TΔS is the entropy contribution upon ligand binding at temperature T. Normal mode analysis51 was performed to estimate the entropic changes using the nmode program in Amber12. To reduce the memory demanding, only residues within 12.0 Å around the ligand were included for the entropy contribution calculations. In this study, 400 snapshots extracted from the last 20.0 ns of equilibrium stage for the calculations of ΔGMM and ΔGsolv, and 50 snapshots were used for entropy calculation. For validation, we also calculated the binding free energies using sietraj, which is another program for calculating the binding free energy.52
Results and discussion
Molecular docking
The initial binding modes of LTZ and IMZ in the active site of aromatase were obtained by molecular docking. 50 docking outputs were analyzed in details. According to the results, LTZ had a uniform binding mode, in which one of the triazole nitrogen atoms of LTZ pointed to the heme iron and had a potential to form a coordinate bond with the iron, as shown in Fig. 1 (The corresponding 2D diagrams were provided as Fig. S1†). In addition, the two cyano groups in the cyanophenyl rings formed polar contacts with residues Ser478 and Met374. Many previous studies agreed that LTZ inhibits aromatase via the nitrogen heterocyclic nitrogen coordinating the heme iron atom of the enzyme.53–55 Similar binding mode was also observed in previous LTZ docking simulations based on another crystal structure of aromatase (PDB code 3EQM).12,54
 |
| Fig. 1 Docking poses of LTZ (A), R-IMZ (C) and S-IMZ (E). MD refined poses of LTZ (B), R-IMZ (D) and S-IMZ (F). | |
In contrast, R-IMZ and S-IMZ had different binding modes. The fifty outputs of both R-IMZ and S-IMZ can be classified into four clusters. In the first cluster, both R/S-IMZ used the nitrogen-containing heterocycle pointing to heme. Similar to LTZ, one of nitrogen atoms of IMZ had a potential coordinate bond with Fe. In the other clusters, the dichlorophenyl group pointed to heme, but the allyl and heterocycle groups had different orientations in the active site. The nitrogen-containing heterocycle pointed to Met374 or Asp309 in the different clusters. The detailed binding modes of each cluster have been provided as Fig. S2 in ESI.† In general, inhibitors that include aromatic nitrogen-containing heterocycles interact with CYPs via the coordinate bond between the nitrogen atom and Fe.56–58 Considering this fact, the pose with the imidazole ring pointing to the heme iron was selected as the initial binding mode of R-IMZ and S-IMZ in the aromatase active site. In this binding mode, the imidazole nitrogen atom pointed to the Fe atom. The distance between the nitrogen atom and Fe was approximate to that in the LTZ system. The allyl and dichlorophenyl side chains of (R/S)-IMZ were located at the same space of the cyanophenyl group of LTZ. The plane of the dichlorophenyl group in the S-IMZ system had a little rotation compared to those in LTZ and R-IMZ.
The docking scores were summarized in Table S1.† From Table S1,† it is apparent that the docking scores of both R-IMZ and S-IMZ were higher than that of LTZ, which was inconsistent with the experimental data. This suggested that the automated docking could not accurately discriminate the inhibitory activities of LTZ and IMZ. To refine the interactions and explore the dynamic behaviors of the inhibitors in the active site of aromatase, the initial three complex models of aromatase with LTZ, R-IMZ and S-IMZ were subjected to MD simulations, respectively.
Conventional MD simulations
50 ns conventional MD simulation was conducted on each aromatase complex system. The RMSD values of protein backbone atoms and the ligand atoms relative to their initial structures were calculated to examine the structural stability of aromatase–inhibitor systems during MD simulations. The RMSD variations of these complexes with regard to simulation time are shown in Fig. S3.† The RMSD values of LTZ and R-IMZ had a fluctuation during the first 23 ns and reached equilibrium after that point. The protein atoms did not exhibit significant deviations from their initial structures and the RMSD values converged to ∼1.3 Å and ∼1.4 Å in the LTZ and R-IMZ complexes, respectively. Similarly, the RMSD values of LTZ, R-IMZ and S-IMZ converged to ∼1.1 Å, ∼2.8 Å and ∼2.9 Å, respectively, after the systems reached stability. Since no significant fluctuation was observed during the last 4.0 ns simulation in all the systems, the following analysis was based on the last 4.0 ns trajectory.
Superimposition of the average structure of the LTZ complex from the MD trajectory with the docking pose revealed that neither the active site residues nor LTZ underwent significant conformational changes. The distance between the triazole nitrogen and the heme iron was kept at ∼2.4 Å during the simulation. At the same time, LTZ maintained hydrophobic interactions with Ile133, Phe221 and Thr310 in the simulation. However, the polar contact of cyano group of LTZ with Ser478 disappeared after the simulation due to the rotation of the Ser478 side chain (Fig. 1A). In contrast, both R-IMZ and S-IMZ were less stable in the active site of aromatase. The imidazole nitrogen atom shifted a little away from Fe, which led to the distance between the two atoms changing from 2.4 to 3.2 Å in R-IMZ and to 3.3 Å in S-IMZ system (Fig. 2). In addition, the vinyl group of S-IMZ underwent a displacement compared to the docking pose and thus formed a hydrophobic interaction with the indole ring of Trp224 (Fig. 1E). The instability of R-IMZ and S-IMZ in the active site of aromatase may account for the weak inhibitory activity towards aromatase.
 |
| Fig. 2 The variation of distance between heme Fe atom and coordinated nitrogen-atoms of LTZ (black), R-IMZ (red) and S-IMZ (blue) with respect to simulation time. | |
Binding free energy calculations
Binding free energies of LTZ and IMZ with aromatase were evaluated with the MM-GBSA method. The calculated energies including total binding energy and separated energy components were listed in Table 1. As shown, the calculated binding energy of LTZ with aromatase by MM-GBSA was −28.25 kcal mol−1, lower than both IMZ isomers (−21.99 kcal mol−1 for R-IMZ and −12.65 kcal mol−1 for S-IMZ). In addition, the free energies calculated by sietraj were also consistent with this ranking. The experimental data indicated that the IC50 value of LTZ was ∼100-fold lower than that of IMZ.24 Our calculated binding energies are in agreement with the relative potency of the experimental inhibitory activity. By decomposing the binding free energy into its component items, it is clear that van der Waals energies are the major driving force for the inhibitor–enzyme binding. This is in accordance with the fact that the binding pocket of aromatase is mainly composed of hydrophobic residues. Compared with IMZ, the vacuum electrostatic energy contributed much more to the binding energy in the LTZ complex. This may result from the more nitrogen atoms with negative partial charges in LTZ than IMZ. Additionally, the stable coordination interaction between the triazole nitrogen and Fe may contribute more to the favorable electrostatic interaction energy for the binding of LTZ.
Table 1 The binding free energy of aromatase combined with inhibitors, calculated by MM-GBSA and sietraj (kcal mol−1)
Lig |
ΔGele |
ΔGvdw |
ΔGnp,sol |
ΔGele,sol |
−TΔS |
ΔGcalbinding |
Sietraj |
ΔGexpbindinga |
ΔGexpbinding: calculated from the experimental data via ΔGexpbinding ≈ RT ln K at T = 300 K. The binding energies were calculated based on IC50.24 |
LTZ |
−18.79 ± 3.10 |
−48.10 ± 2.44 |
−5.50 ± 0.15 |
27.23 ± 2.25 |
−16.91 ± 4.82 |
−28.25 |
−8.52 ± 0.26 |
−10.99 |
R-IMZ |
−8.55 ± 1.62 |
−46.14 ± 2.18 |
−4.73 ± 0.13 |
21.14 ± 1.18 |
−16.06 ± 5.90 |
−21.99 |
−8.25 ± 0.24 |
−8.24 |
S-IMZ |
−7.06 ± 5.00 |
−41.34 ± 2.51 |
−4.77 ± 0.18 |
17.25 ± 2.47 |
−18.50 ± 5.23 |
−12.65 |
−7.35 ± 0.23 |
−8.24 |
To detect the influence of individual residues on the binding free energy, the energies were then decomposed onto each residue. The contributions of individual residues were summarized in Fig. 3 (the detailed data of each key residues energy contributions were provided by Table S2†). It is obvious that residues Arg115, Ile133, Phe221, Thr310, Met374 and heme made large contributions to the binding free energy of LTZ. As mentioned earlier, Met374 was found to form polar contact with one of cyano groups of LTZ. Heme interacted with the polar nitrogen-atoms of triazole ring to help stabilize the binding of LTZ. In addition, hydrophobic residues such as Ile133, Phe221, and Val373 also provided strong hydrophobic interactions with LTZ. Phe221 is located in the binding site and points to the solvent channel. This residue has been suggested to have a role in the ligand binding or release process.13 Moreover, residues such as Trp224, Val370 and Phe134 in the active site had strong energy contribution. These residues were also identified to be important for LTZ binding in a previous study.12 Unlike LTZ, both R-IMZ and S-IMZ molecules formed weaker interactions with Arg115, Asp309, Thr310, Val373 and Met374. On the other hand, Trp224 and Ile133 made greater van der Waals contributions to IMZ binding, due to the hydrophobic contacts between the side chains of these residues and the ethylene and chlorophenyl groups of IMZ. In addition, because of the lack of the phenyl ring, the interaction between IMZ and Phe221 became much weaker compared to LTZ, resulting in small van der Waals contribution to the binding of IMZ.
 |
| Fig. 3 Inhibitor–residue interaction spectra of LTZ (A) and (R/S)-IMZ (B and C). | |
As the conventional MD simulation and free energy calculations indicated, the S-IMZ system had larger RMSD values and higher binding free energy as compared to the R-IMZ system, which implies that R-IMZ binds more stably with aromatase. Therefore, the following simulations were conducted based on the R-IMZ system to investigate the detailed unbinding process of IMZ.
Unbinding pathways identified by RAMD simulations
RAMD is a powerful tool to identify the possible unbinding pathways in proteins with a deeply buried active site. In this work, RAMD was used to identify the potential unbinding pathways of inhibitors from aromatase. 50 simulations were carried out for LTZ and R-IMZ based on the corresponding snapshot structure at 50 ns of conventional MD simulation, which resulted in a total of 100 RAMD runs. Each run lasted from 168 ps to 2796 ps for the LTZ system and 31 ps to 1361 ps for the R-IMZ complex. Details of RAMD statistical results were summarized in Table 2. Those successful unbinding pathways were then clustered and described by the secondary structural elements lining them.
Table 2 Statistical summary of RAMD simulations of LTZ and IMZ from aromatase
System |
Channel |
A (kcal Å−1 g−1) |
rmin (Å) |
N (steps) |
No. of successful |
No. of total successful |
ASD |
S |
0.20 |
0.01, 0.005 |
40 |
20 |
40 |
2a |
0.20 |
0.01, 0.005 |
40 |
7 |
R-IMZ |
S |
0.15, 0.20 |
0.01, 0.005 |
40 |
7 |
44 |
2a |
0.15, 0.20 |
0.01, 0.005 |
40 |
11 |
LTZ |
S |
0.15, 0.20 |
0.01, 0.005 |
40 |
21 |
36 |
2a |
0.15, 0.20 |
0.01, 0.005 |
40 |
10 |
Several unbinding pathways were observed in the aromatase–inhibitor systems. The nomenclature for the pathways was adopted from the previous work by Cojocaru et al.18 Among all the observed pathways, the occurrence frequencies differed significantly. Two pathways, namely Paths S and 2a, were most frequently observed for the inhibitors egress, as shown in Fig. 4. Path S is located in the opening formed by the middle part of helix F, helix I, and the β8-9 sheet. Path 2a is penetrating through the cleft formed by the F–G loop, B–C loop and β1-2 sheet. The percentages of LTZ unbinding via Paths S and 2a were ∼58% and ∼27%, respectively. The frequencies of R-IMZ egress through Paths S and 2a were ∼16% and ∼25%, respectively. The other pathways were observed rarely.
 |
| Fig. 4 The egress frequencies of LTZ, R-IMZ and ASD from the aromatase active site. | |
For verifying the rationality of our RAMD simulations, we also performed 50 RAMD runs for the ASD-aromatase system. The statistical results showed that Paths S and 2a were also the major egress routes for ASD, with ∼50% and ∼18% occurrence frequency, respectively. The previous study by Sgrignani et al. indicated that multiple routes exist in aromatase and Path S is the most favorable pathway for ASD unbinding.14 Our RAMD simulation on the ASD complex was in line with their results, which suggested that our RAMD methodology was reasonable.
In light of the basic principle of the RAMD simulation approach and many previous studies, Paths S and 2a were most likely to serve as the unbinding pathways for LTZ and IMZ.14,37,38,43–45 Yet, whether the two inhibitors prefer the both channels to the same extent warrants further investigation. This could be consummated by the following SMD simulations.
SMD simulations
Compared to RAMD, the SMD approach can sample more extensively for both the ligand and its surrounding residues during the ligand dissociation along the same unbinding pathway, and thus allowing a more comprehensive characterization of the interactions between ligand and residues. This method has been frequently used in CYPs and other systems to study the ligand dissociation process.37,38,44,59–61 SMD simulations were employed on the aromatase–inhibitor complex along the two most frequently observed pathways, Paths S and 2a found by RAMD simulations, so as to estimate the rupture forces and to observe the dynamic events throughout the inhibitors egress process. In order to obtain the more reasonable samplings of LTZ and IMZ during their dissociation from the active pocket, a series of repeated SMD simulations were conducted. Twenty SMD simulations were run for each system, each of which lasted for 3.0 ns. Thus, totally 240 ns simulations were performed for the two systems.
Dissociation processes of LTZ and IMZ along pathways S and 2a
Fig. 5 illustrates the typical force profiles of LTZ egress along Paths S and 2a. The first force peak of LTZ unbinding along Path S appeared at ∼460 ps, at which the triazole nitrogen atom gradually broke the coordination interaction with the heme iron. The maximum force peak (∼119 pN) occurred at ∼1700 ps. At this point, the nitrogen heterocycle formed the π–π stacking interaction with Arg192, and the two cyano nitrogen atoms formed hydrogen bonding with Ser478 and Arg192, respectively (Fig. 6 and the corresponding 2D diagrams in Fig. S4†). It required a large force to break these interactions. After that, the inhibitor can smoothly cross the channel. In contrast, according to the force profile, LTZ egress via Path 2a had several large obstacles, each of which was associated with a force peak, as shown in Fig. 5. The force peaks at ∼500 ps and ∼1200 ps indicated that LTZ egress encountered several blockages along Path 2a, and therefore a larger force was required to get rid of these hurdles.
 |
| Fig. 5 The typical force profiles of pulling LTZ out of the aromatase pocket along Path S (A) and Path 2a (B), as well as R-IMZ along Path S (C) and Path 2a (D), respectively. | |
 |
| Fig. 6 Snapshots of LTZ unbinding from aromatase along Path S (A, 0 ps; B, 460 ps; C, 1700 ps), and of R-IMZ along Path 2a (D, 0 ps; E, 330 ps; F, 1330 ps). Important residues interacting with the ligand are labeled and shown as sticks. The hydrogen bonds are shown in red dotted lines. | |
Compared with the force profile of LTZ, a different unbinding behavior was observed for R-IMZ. During R-IMZ escaped through Path S, two sharply increased force peaks appeared at ∼660 and ∼1400 ps. The interaction between the imidazole nitrogen and the heme iron was broken at ∼660 ps. As the ligand gradually moved out of the binding pocket, the force curve decreased markedly. At ∼1400 ps, a polar contact was formed between the imidazole nitrogen atom and the backbone oxygen atom of Ile261. Simultaneously, the ethereal oxygen atom of IMZ formed a hydrogen bond with Glu174. Thus a steep increase of force peak was observed in order to break the interaction network at this point. On the contrary, no noticeable force peaks were observed for R-IMZ dissociation along Path 2a. In addition, during the whole SMD simulation, R-IMZ dissociated from the binding site in a flat conformation without any rotation. It indicated that R-IMZ encountered fewer obstacles when escaping along Path 2a.
Comparative analysis of LTZ and IMZ unbinding along different pathways
To gain a more quantitative comparison of the two inhibitors unbinding along the two probable pathways, the maximum force value (Fmax) and the sum of the force (Fsum) were calculated. It is noteworthy that the free energy of unbinding should be estimated to obtain a precise, reliable comparison of the relative preference of the unbinding pathway. In general, the unbinding free energy from the nonequilibrium SMD simulations can be estimated by using Jarzynski's equality. However, a theoretically reliable measurement of the free energy along the dissociation process can only be obtained by plenty of slow and sufficient sampling simulations. Due to the computational and time expense, this usually cannot be attained in practice. Additionally, according to the studies from other groups61–64 and our own experiences,37,44 potential of mean force estimates based on Jarzynski's equality with the approximation methods usually led to a large deviation from the real free energy. For these reasons, the expensive sampling simulations were not conducted. Instead, we used the maximum force value and the sum of the force to compare the pathway preference. This strategy has been widely adopted in many previous studies.38,64,65 The average values of Fmax and Fsum obtained from twenty SMD trajectories were summarized in Table 3 (the detailed force values were provided in Table S3†). It is obvious that LTZ dissociation along Path S has lower Fmax and Fsum values than along Path 2a. By contrast, IMZ has lower Fmax and Fsum values when dissociating along Path 2a. This means that either LTZ dissociation along Path S or IMZ egress along Path 2a has fewer obstacles. On the other hand, the values of both terms of IMZ are lower than those of LTZ, which suggests that IMZ is easier to escape from the active site than LTZ.
Table 3 Average values of Fmax and Fsum along two distinct pathways
System |
Pathway |
Fmax (pN) |
Fsum (pN) |
The uncertainties are the standard deviation calculated based on 20 SMD trajectories. |
LTZ |
S |
117 ± 11a |
97 359 ± 15 688 |
2a |
129 ± 12 |
123 384 ± 13 492 |
R-IMZ |
S |
110 ± 14 |
94 646 ± 11 031 |
2a |
90 ± 10 |
78 282 ± 14 024 |
We also analyzed the changes of the backbone atoms of residues lining the channels. For LTZ egress via Path S, the maximum Cα displacement was 4.7 Å for Phe221 in the F helix due to the rotation of the benzene ring. However, several residues lining Path 2a had relatively larger movement, for instance, 7.5 Å for Ile229 and 5.6 Å for Leu228 in the B–C loop. The larger structural changes of residues in Path 2a diminished the possibility of it as the unbinding pathway for LTZ. As for IMZ, the largest Cα displacement along Path S occurred for Phe221 with a value of 6.8 Å. When IMZ dissociated from Path 2a, the largest displacement values were 6.1 Å and 4.9 Å for Ser74 and Ser46, which are located at the β1-2 loop and at the protein surface, respectively.
In terms of the RAMD results, the force profiles, and structural changes during SMD simulations, we concluded that LTZ prefers Path S and R-IMZ prefers Path 2a as their favorable unbinding pathways. The selection of ligand channels of aromatase appeared to be ligand-dependent. In fact, both the pathways have been identified to be used for ligand passage in previous studies. Path S has been identified to be the most energetically unbinding pathway for ASD.14 Path 2a serving as the ligand unbinding pathway has been reported by several studies on CYPs.16,17,44 In fact, this phenomenon has occurred in several other CYPs. It has been shown that different CYPs have different ligand channels and a given CYP may have multiple channels for different ligand passage. Cojocaru et al. reported that depending on the ligand properties, CYP2C9 used different routes for ligand dissociation.17 We previously reported that the inhibitor metyrapone unbinds from the active site of CYP3A4 through Path 2e.59 Subsequently, Krishnamoorthy et al. and Fishelovitch et al. reported that multiple channels may exist in CYP3A4 and Paths 2e, 2a and 3 could serve as the egress channels for different ligands.66,67 Shen et al. reported two possible pathways 2c and 2a can be used for indazole egress from CYP2E1.44 Cui et al. reported that fatty acids preferred Path 2c in CYP2E1.68 The similar case was also found in other systems such as farnesoid x receptor and estrogen receptor.38,65
Gating mechanisms of Paths S and 2a
By analyzing the dynamic processes of LTZ and IMZ egress along Paths S and 2a, we found that certain residues played an important role in the inhibitors dissociation. During the dissociation process of LTZ along Path S, we found that the side chain of Phe221 underwent a rotation to leave sufficient space for the inhibitor to pass. Phe221 is located at the entrance of Path S and acts as a gatekeeper to regulate the unbinding of the inhibitor. To quantify the change, the variation of the sidechain torsion χ2 (CA, CB, CG, and CD1) of Phe221 during the course of dissociation was monitored. As shown in Fig. 7A, the torsion angle remained around 90° in the first 790 ps. In the following 310 ps, the benzene ring rotated, resulting in the angle changing from 150° to 60°. After the molecule got through the bottleneck, the torsion angle wiggled back to 90° and fluctuated around it. The same event has been observed in several CYPs including CYP3A4, 2 × 101, 2A6, and other systems.37,44,59,67
 |
| Fig. 7 (A) The variation of the side chain torsion χ (CA, CB, CG, and CD2) of Phe221 during LTZ egress along Path S. (B) The variation of the distance between Gln225 and Ser478. (C) The variation of the side chain torsion χ (CA, CB, CG, and CD1) of Phe134 during R-IMZ egress along Path 2a with respect to simulation time. | |
Along with the rotation of Phe221, residues such as Gln225, Ser478 and His480 underwent displacement, which is manifested by the distance between Gln225 and Ser478. As shown in Fig. 7B, the distance became wider at ∼1250 ps when the cyano group of LTZ inserted into the space between them and pushed the residues apart. After that, as the coming of the different sidechains of LTZ, the distance changed intermittently. Gln225 and Ser478 seem like a switch that can automatically be on and off. The influences of Gln225 and Ser478 on ligand binding have been investigated by site directed mutagenesis experiments.68–70 The Q225A mutation in the substrate–aromatase complex showed that the apparent Km and Vmax values increased significantly, implying that Gln225 may play an important role in regulating the ligand binding. In addition, site-directed mutagenesis data on H480K and H480Q showed that the two mutants exhibited reduced Km when compared to the wild type.70 On the basis of these experimental data and our simulation results, it appears that Gln225, Ser478 and Phe221 serve as the bottleneck resides along Path S.
In Path 2a, the side chain of Phe134 had a similar wiggle to prevent the ligand from leaving the binding pocket. The side chain of Phe134 pointed to the inside of the binding pocket and occupied part of the channel space. The appropriate swing and rotation of the phenol side chain were required to expand the space in order to allow IMZ unbinding. To qualify the rotation of the side chain of Phe134, the variation of the side chain torsion χ (CA, CB, CG and CD1) of the residue was measured as well (see Fig. 7C). The torsion angle changed in a similar manner as Phe221 lining Path S. Phe134 also played an important role to stabilize the ligand binding as shown in the MM/GBSA decomposition calculation, in which they had a large contribution to the binding free energy.
Conclusions
Aromatase is the unique CYP isoenzyme that specifically catalyzes the conversion of androgens to estrogens and thus represents an important drug target against several diseases, especially hormone-positive breast cancer. Azole compounds such as LTZ and IMZ have been reported as effective aromatase inhibitors. However, these two azole compounds exhibited significantly different inhibitory activities towards aromatase. To elucidate the molecular mechanism of these two compounds recognized by aromatase, in this study, multiple computational methods were adopted to reach the goal. The binding modes of these two inhibitors were firstly obtained by molecular docking and then refined by MD simulations. The calculated interaction energies were in agreement with the experimental data and several residues were found important for the inhibitor binding. The unbinding behaviors of these two compounds with distinct inhibitory activities were further investigated by RAMD and SMD simulations. Our results demonstrated that multiple unbinding pathways co-exist in aromatase. LTZ preferred Path S as its favorable unbinding pathway, whereas IMZ preferred Path 2a. Path S is located between the helices F and I and the β8-9 sheets, and Path 2a is formed by the F–G loop, B–C loop and β1-2 sheets. Moreover, the unbinding manners of LTZ and IMZ differed in their favorable pathway. Gating residues along each pathway were also identified. These findings can assist in the understanding of the mechanism of action of the azole inhibitors and could be helpful to design new aromatase inhibitors.
Acknowledgements
The authors thank the financial supports from the National Natural Science Foundation of China (Grants 81373328 and 81373329), the 863 Project (Grant 2012AA020308), and the Fundamental Research Funds for the Central Universities (Grant WY1113007).
Notes and references
- G. Di Nardo and G. Gilardi, Biotechnol. Appl. Biochem., 2013, 60, 92–101 CrossRef CAS PubMed.
- L. Banting and S. Ahmed, Anti-Cancer Agents Med. Chem., 2009, 9, 627–641 CrossRef CAS.
- R. Santen, H. Brodie, E. Simpson, P. Siiteri and A. Brodie, Endocr. Rev., 2009, 30, 343–375 CrossRef CAS PubMed.
- P. V. Plourde, M. Dyroff, M. Dowsett, L. Demers, R. Yates and A. Webster, J. Steroid Biochem., 1995, 53, 175–179 CrossRef CAS.
- P. F. Trunet, A. S. Bhatnagar, H. A. Chaudri and U. Hornberger, Acta Oncol., 1996, 35, 15–18 CrossRef.
- T. J. Evans, E. Di Salle, G. Ornati, M. Lassus, M. S. Benedetti, E. Pianezzola and R. C. Coombes, Cancer Res., 1992, 52, 5933–5939 CAS.
- J. C. Hackett, R. W. Brueggemeier and C. M. Hadad, J. Am. Chem. Soc., 2005, 127, 5224–5237 CrossRef CAS PubMed.
- F. K. Yoshimoto and F. P. Guengerich, J. Am. Chem. Soc., 2014, 136, 15016–15025 CrossRef CAS PubMed.
- D. Ghosh, J. Griswold, M. Erman and W. Pangborn, Nature, 2009, 457, 219–223 CrossRef CAS PubMed.
- D. Ghosh, J. Lo, D. Morton, D. Valette, J. Xi, J. Griswold, S. Hubbell, C. Egbuta, W. Jiang and J. An, J. Med. Chem., 2012, 55, 8464–8476 CrossRef CAS PubMed.
- R. Galeazzi and L. Massaccesi, J. Mol. Model., 2012, 18, 1153–1166 CrossRef CAS PubMed.
- N. Suvannang, C. Nantasenamat, C. Isarankura-Na-Ayudhya and V. Prachayasittikul, Molecules, 2011, 16, 3597–3617 CrossRef CAS PubMed.
- J. Park, L. Czapla and R. E. Amaro, J. Chem. Inf. Model., 2013, 53, 2047–2056 CrossRef CAS PubMed.
- J. Sgrignani and A. Magistrato, J. Chem. Inf. Model., 2012, 52, 1595–1606 CrossRef CAS PubMed.
- W. Jiang and D. Gohosh, PLoS One, 2012, 7, e32565 CAS.
- X. Yu, V. Cojocaru and R. C. Wade, Biotechnol. Appl. Biochem., 2013, 60, 134–145 CrossRef CAS PubMed.
- V. Cojocaru, P. J. Winn and R. C. Wade, Curr. Drug Metab., 2012, 13, 143–154 CrossRef CAS.
- V. Cojocaru, P. J. Winn and R. C. Wade, BBA, Biochim. Biophys. Acta, Gen. Subj., 2007, 1770, 390–401 CrossRef CAS PubMed.
- J. Sgrignani, M. Bon, G. Colombo and A. Magistrato, J. Chem. Inf. Model., 2014, 54, 2856–2868 CrossRef CAS PubMed.
- I. Galina and R. Michael, Mol. Cell. Endocrinol., 2004, 215, 165–170 CrossRef PubMed.
- M. Heneweer, M. van den Berg and J. T. Sanderson, Toxicol. Lett., 2004, 146, 183–194 CrossRef CAS PubMed.
- C. Yung-Chi and W. H. Prusoff, Biochem. Pharmacol., 1973, 22, 3099–3108 CrossRef.
- E. R. Trösken, K. Scholz, R. W. Lutz, W. Völkel, J. A. Zarn and W. K. Lutz, Endocr. Res., 2004, 30, 387–394 CrossRef PubMed.
- C. Egbuta, J. Lo and D. Ghosh, Endocrinology, 2014, 155, 4622–4628 CrossRef PubMed.
- J. J. Irwin and B. K. Shoichet, J. Chem. Inf. Model., 2005, 45, 177–182 CrossRef CAS PubMed.
- J. J. Irwin, T. Sterling, M. M. Mysinger, E. S. Bolstad and R. G. Coleman, J. Chem. Inf. Model., 2012, 52, 1757–1768 CrossRef CAS PubMed.
- MacroModel. version 9.9, Schrödinger, LLC, New York, NY, 2012 Search PubMed.
- Maestro. version 9.3, Schrödinger, LLC, New York, NY, 2012 Search PubMed.
- M. L. Verdonk, J. C. Cole, M. J. Hartshorn, C. W. Murray and R. D. Taylor, Proteins, 2003, 52, 609–623 CrossRef CAS PubMed.
- C. R. Sondergaard, M. H. Olsson, M. Rostkowski and J. H. Jensen, J. Chem. Theory Comput., 2011, 7, 2284–2295 CrossRef CAS.
- G. D. Nardo, M. Breitner, A. Bandino, D. Ghosh, G. K. Jennings, J. C. Hackett and G. Gilard, J. Biol. Chem., 2015, 290, 1186–1196 CrossRef PubMed.
- M. K. Gilson, K. A. Sharp and B. H. Honig, J. Comput. Chem., 1988, 9, 327–335 CrossRef CAS PubMed.
- D. A. Case, J. T. Berryman, R. M. Betz, D. S. Cerutti, T. E. Cheatham III, T. A. Darden, R. E. Duke, T. J. Giese, H. Gohlke, A. W. Goetz, N. Homeyer, S. Izadi, P. Janowski, J. Kaus, A. Kovalenko, T. S. Lee, S. LeGrand, P. Li, T. Luchko, R. Luo, B. Madej, K. M. Merz, G. Monard, P. Needham, H. Nguyen, H. T. Nguyen, I. Omelyan, A. Onufriev, D. R. Roe, A. Roitberg, R. Salomon-Ferrer, C. L. Simmerling, W. Smith, J. Swails, R. C. Walker, J. Wang, R. M. Wolf, X. Wu, D. M. York and P. A. Kollman, AMBER12, University of California, San Francisco, 2012 Search PubMed.
- W. L. Jorgensen, J. Chandrasekhar, J. D. Madura, R. W. Impey and M. L. Klein, J. Chem. Phys., 1983, 79, 926–935 CrossRef CAS PubMed.
- W. Li, H. Ode, T. Hoshino, H. Liu, Y. Tang and H. Jiang, J. Chem. Theory Comput., 2009, 5, 1411–1420 CrossRef CAS.
- D. L. Harris, J. Y. Park, L. Gruenke and L. Waskell, Proteins, 2004, 55, 895–914 CrossRef CAS PubMed.
- W. Li, J. Shen, G. Liu, Y. Tang and T. Hoshino, Proteins, 2011, 79, 271–281 CrossRef CAS PubMed.
- W. Li, J. Fu, F. Cheng, M. Zheng, J. Zhang, G. Liu and Y. Tang, J. Chem. Inf. Model., 2012, 52, 3043–3052 CrossRef CAS PubMed.
- J. P. Ryckaert, G. Ciccotti and H. J. Berendsen, J. Comput. Phys., 1977, 23, 327–341 CrossRef CAS.
- U. Essmann, L. Perera, M. L. Berkowitz, T. Darden, H. Lee and L. G. Pedersen, J. Chem. Phys., 1995, 103, 8577–8593 CrossRef CAS PubMed.
- K. Schleinkofer, P. J. Winn, S. K. Lüdemann and R. C. Wade, EMBO Rep., 2005, 6, 584–589 CrossRef CAS PubMed.
- S. K. Lüdemann, V. Lounnas and R. C. Wade, J. Mol. Biol., 2000, 303, 797–811 CrossRef PubMed.
- T. Wang and Y. Duan, J. Mol. Biol., 2009, 392, 1102–1115 CrossRef CAS PubMed.
- Z. Shen, F. Cheng, Y. Xu, J. Fu, W. Xiao, J. Shen, G. Liu, W. Li and Y. Tang, PLoS One, 2012, 7, e33500 CAS.
- M. Peräkylä, Eur. Biophys. J., 2009, 38, 185–198 CrossRef PubMed.
- H. Grubmüller, B. Heymann and P. Tavan, Science, 1996, 271, 997–999 Search PubMed.
- B. Isralewitz, M. Gao and K. Schulten, Curr. Opin. Struct. Biol., 2001, 11, 224–230 CrossRef CAS.
- P. A. Kollman, I. Massova, C. Reyes, B. Kuhn, S. Huo, L. Chong, M. Lee, T. Lee, Y. Duan and W. Wang, Acc. Chem. Res., 2000, 33, 889–897 CrossRef CAS PubMed.
- B. Kuhn and P. A. Kollman, J. Med. Chem., 2000, 43, 3786–3791 CrossRef CAS PubMed.
- J. Weiser, P. S. Shenkin and W. C. Still, J. Comput. Chem., 1999, 20, 217–230 CrossRef CAS.
- B. R. Brooks, D. Janežič and M. Karplus, J. Comput. Chem., 1995, 16, 1522–1542 CrossRef CAS PubMed.
- Q. Cui, T. Sulea, J. D. Schrag, C. Munger, M.-N. Hung, M. Naïm, M. Cygler and E. O. Purisima, J. Mol. Biol., 2008, 379, 787–802 CrossRef CAS PubMed.
- F. Caporuscio, G. Rastelli, C. Imbriano and A. Del Rio, J. Med. Chem., 2011, 54, 4006–4017 CrossRef CAS PubMed.
- P. M. Wood, L. Woo, M. P. Thomas, M. F. Mahon, A. Purohit and B. V. Potter, ChemMedChem, 2011, 6, 1423–1438 CrossRef CAS PubMed.
- M. R. Saberi, T. K. Vinh, S. W. Yee, B. N. Griffiths, P. J. Evans and C. Simons, J. Med. Chem., 2006, 49, 1016–1022 CrossRef CAS PubMed.
- A. Stefanachi, A. D. Favia, O. Nicolotti, F. Leonetti, L. Pisani, M. Catto, C. Zimmer, R. W. Hartmann and A. Carotti, J. Med. Chem., 2011, 54, 1613–1625 CrossRef CAS PubMed.
- S. Gobbi, A. Cavalli, M. Negri, K. E. Schewe, F. Belluti, L. Piazzi, R. W. Hartmann, M. Recanatini and A. Bisi, J. Med. Chem., 2007, 50, 3420–3422 CrossRef CAS PubMed.
- P. A. Cole and C. H. Robinson, J. Med. Chem., 1990, 33, 2933–2942 CrossRef CAS.
- W. Li, H. Liu, X. Luo, W. Zhu, Y. Tang, J. R. Halpert and H. Jiang, Drug Metab. Dispos., 2007, 35, 689–696 CrossRef CAS PubMed.
- J. S. Patel, A. Berteotti, S. Ronsisvalle, W. Rocchia and A. Cavalli, J. Chem. Inf. Model., 2014, 54, 470–480 CrossRef CAS PubMed.
- R. Yu, Q. Kaas and D. J. Craik, J. Phys. Chem. B, 2012, 116, 6097–6105 CrossRef CAS PubMed.
- A. M. Capelli, A. Bruno, A. Entrena Guadix and G. Costantino, J. Med. Chem., 2013, 56, 7003–7014 CrossRef CAS PubMed.
- F. Gräter, B. L. de Groot, H. Jiang and H. Grubmüller, Structure, 2006, 14, 1567–1576 CrossRef PubMed.
- L. Martínez, P. Webb, I. Polikarpov and M. S. Skaf, J. Med. Chem., 2006, 49, 23–26 CrossRef PubMed.
- S. Burendahl, C. Danciulescu and L. Nilsson, Proteins, 2009, 77, 842–856 CrossRef CAS PubMed.
- N. Krishnamoorthy, P. Gajendrarao, S. Thangapandian, Y. Lee and K. W. Lee, J. Mol. Model., 2010, 16, 607–614 CrossRef CAS PubMed.
- D. Fishelovitch, S. Shaik, H. J. Wolfson and R. Nussinov, J. Phys. Chem. B, 2009, 113, 13018–13025 CrossRef CAS PubMed.
- Y. L. Cui, Q. C. Zheng, J. L. Zhang and H. X. Zhang, Biopolymers, 2015, 103, 53–66 CrossRef CAS PubMed.
- B. Amarneh, C. J. Corbin, J. A. Peterson, E. R. Simpson and S. Graham-Lorence, Mol. Endocrinol., 1993, 7, 1617–1624 CAS.
- Y. C. Kao, K. R. Korzekwa, C. A. Laughton and S. Chen, Eur. J. Biochem., 2001, 268, 243–251 CrossRef CAS.
Footnote |
† Electronic supplementary information (ESI) available. See DOI: 10.1039/c5ra19602g |
|
This journal is © The Royal Society of Chemistry 2015 |
Click here to see how this site uses Cookies. View our privacy policy here.