
 Open Access Article
 This Open Access Article is licensed under a Creative Commons Attribution-Non Commercial 3.0 Unported Licence
In situ viscosity measurement of confined liquids
A. Ponjavic†‡
a,
J. Dench†a,
N. Morganab and
J. S. S. Wong*a
aDepartment of Mechanical Engineering, Imperial College London, SW7 2AZ, UK. E-mail: j.wong@imperial.ac.uk
bShell Global Solutions (UK) Ltd, Brabazon House, Threapwood Road, Manchester, M22 0RR, UK
First published on 13th November 2015
Abstract
The viscosity of liquids governs crucial physical and engineering phenomena, ranging from diffusion and transport processes of nutrients and chemicals, to the generation of friction and the physics of damping. Engineering fluids frequently experience local conditions that change their bulk rheological properties. While viscosity data can easily be acquired using conventional rheometers, the results are not always applicable to fluids under engineering conditions. This is particularly the case for fluids being sheared at high pressure under severe confinement, which experience very high shear stresses and often show extensive shear thinning. There is a lack of suitable methods for measuring fluid viscosity under such conditions. This work describes a novel in situ viscosity measurement technique to fill this gap. It involves the quantification of the fluorescence lifetime of a fluorescent dye that is sensitive to viscosity. The capability of the developed technique is verified by taking measurements in submicron thick films of two model fluids confined in a ball on flat contact. Viscosity measurements were successfully performed at pressures up to 1.2 GPa and shear rates up to 105 s−1. Spatial heterogeneity in viscosity caused by variations in pressure within the thin fluid film could be observed using the technique. It was also possible to detect differences in the rheological responses of a Newtonian and a non-Newtonian fluid. These first in situ high pressure, high shear viscosity measurements demonstrate the versatility of the proposed technique in providing information on the viscosity in conditions where contemporary techniques are insufficient. More importantly it highlights the complexity of the rheology of engineering fluids and provides a means of verifying existing theories by performing in situ measurements. Information on local viscosity is crucial for understanding the physics of confined fluids and to facilitate improvements in engineering technology.
Introduction
The viscosity of a liquid describes its rate of deformation in response to an applied shear stress. This property is of great importance in numerous applications as it affects physical phenomena such as the diffusion of molecules, the rate of reactions and the generation of friction.1 Consequently, the ability to directly measure the viscosity of liquids is vital for understanding and controlling these processes.While the viscosity of bulk liquids are usually measured using rheometers, modern techniques have been developed to enable probing of previously inaccessible, highly confined systems such as nanoscopically thin liquid films. These techniques include surface forces apparatus,2 atomic force microscopy3 and colloidal probe microscopy.4 Their application has led to important discoveries, such as the confined state of liquids2,5 and the existence of boundary slip.6,7 The main limitation of their use is the measurement of a single force to describe properties of the whole liquid film. Large variations in the local viscosity can exist within both biological systems, such as in cells,8,9 and non-conforming lubricated contacts in engineering systems.10,11 Such a lubricated contact, represented by a sphere rubbing against a flat surface is shown in Fig. 1a. The two surfaces confine a thin layer of liquid within which the local pressure varies greatly with position, reaching peak values in the order of gigapascals.12 This causes a large spatial variation in viscosity of the liquid layer which cannot be studied using a single force measurement.
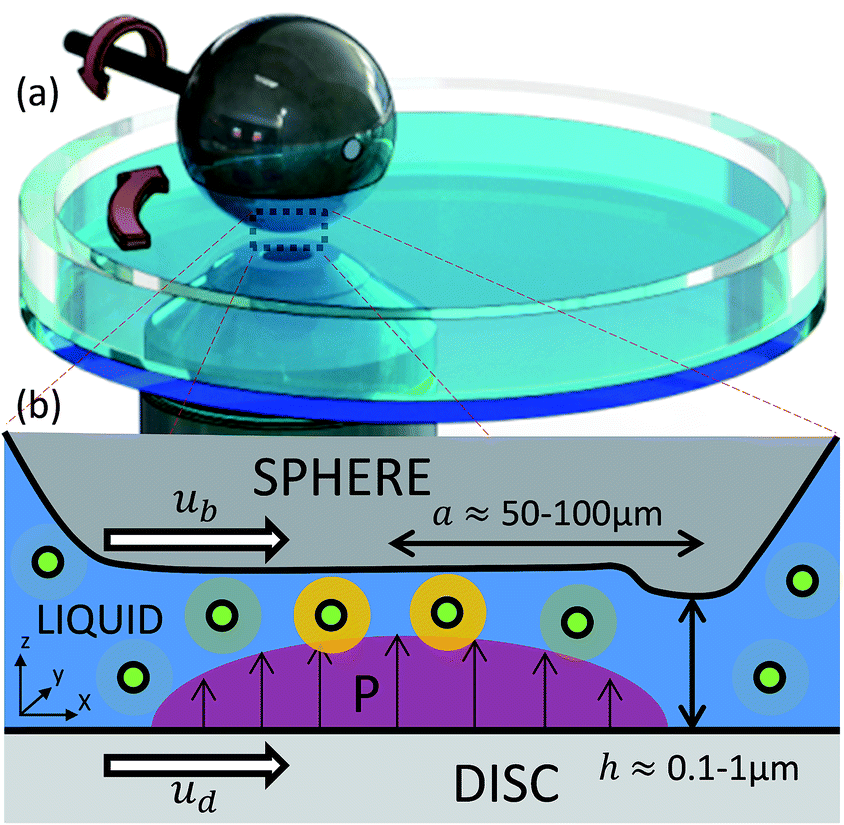 | ||
| Fig. 1 Schematic showing liquid confined within a nominally point contact. (a) A contact is created by a sphere rubbing against a flat surface. Both the sphere and the disc can rotate independently, at speeds ub and ud, causing liquid to be entrained and confined between them. (b) Section view along the centre of the contact. When the sphere is pressed against the flat, it deforms elastically and exerts a parabolic normal pressure distribution P (red parabola) on the liquid. In this state the contact resembles a parallel plate configuration and the confined liquid has roughly constant thickness throughout the contact. The hump is due to a reduction in film thickness, at the location of the pressure spike at the outlet of the contact (not shown) often associated with elastohydrodynamic lubrication. The molecular rotor ThT (spots in the figure) is added to the liquids glycerol and IGEPAL. Its fluorescence intensity and lifetime increases with the viscosity of its surrounding as indicated by a halo (bright orange). a represents the radius of the contact and h is the film thickness separating the surfaces. | ||
The combination of very high pressures and large shear rates (up to 108 s−1), can also lead to shear thinning, where the apparent viscosity of the liquid is reduced. Shear thinning of liquids has typically been studied by measuring the overall friction in a contact1 or by the use of high pressure rheometers.13 Neither of these techniques can be used to study the spatial variation of viscosity. Spectroscopic techniques have been developed to provide new information about the state of liquids in contacts. These include ultrasonic shear reflection viscometry,14 Raman spectroscopy for pressure sensing15 and nanoparticle sensors for pressure and viscosity measurements.16 Ultrasonic shear reflection viscometry only provides a spatial resolution of about 10 μm and the viscosity range studied has been limited (0.1–3 Pa s). Raman spectroscopy can be used to measure pressure in a contact but the technique is insensitive to changes in viscosity. The recently developed nanosensors on the other hand respond to variations in viscosity, but there is little information about their sensitivity and the applicable viscosity range.16 Here, we propose the use of a viscosity sensing fluorescent dye, which is a molecular rotor, to measure the viscosity distribution of liquid in a high pressure contact.
A fluorescent molecule emits light when it is excited by a laser. Molecular rotors are molecules whose fluorescent properties depend on their surroundings. They typically have two substructures which can rotate relative to one another about a shared bond (see Fig. 2). The ease of this rotation affects the properties of their fluorescence emission.17 Hence the local viscosity, or more specifically the rigidity of the dye environment, can be probed by measuring the fluorescence of the molecular rotor. Viscosity measurements using molecular rotors can be performed based on fluorescence intensity,18 ratiometric methods,19,20 fluorescence lifetime21,22 or anisotropy.23 Molecular rotors have been used to study viscosity distributions in cells,20,22 to observe the flow of liquids18,24 and to monitor pressure-induced viscosity changes of bulk liquids.25 However, their use outside the fields of physical chemistry and biology has been limited. This is probably because engineering conditions imposed on liquids, such as high normal pressure and high shear rates, coupled with limited optical access pose challenges to the successful application of molecular rotors for viscosity measurements.
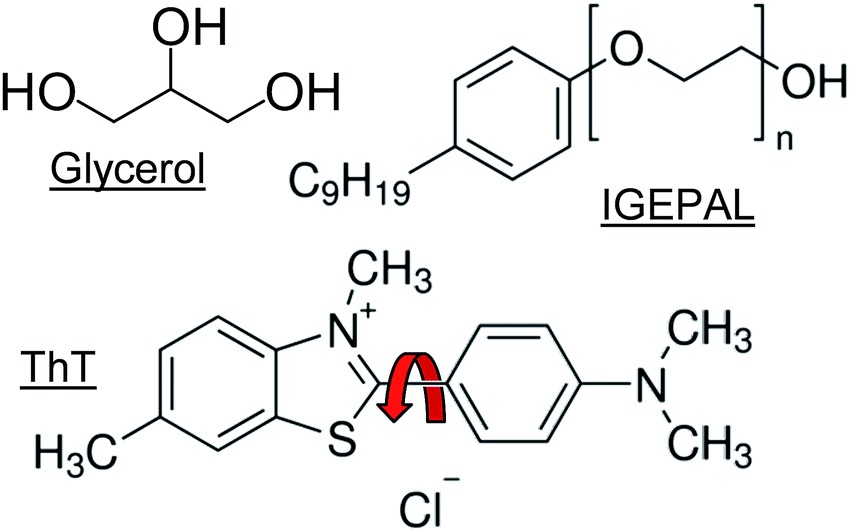 | ||
| Fig. 2 Chemical structures of the liquids glycerol and IGEAPL as well as the dye ThT (red arrow indicates shared bond) used in this work. | ||
In this paper, the capability of molecular rotors to act as viscosity sensors at high pressure and high shear conditions is assessed by examining pressure-induced changes in the viscosity of glycerol and IGEPAL. Thioflavin T (ThT) is added into the liquid of interest and the viscosity is examined by measuring the fluorescence lifetime of ThT. It is found that the intensity of ThT fluorescence decays exponentially with time (see Fig. 3). Fluorescence lifetime corresponds to the characteristic time constant of this decay. Acquisition of such lifetimes enables the determination of the relationship between pressure and viscosity which is then compared to macroscopic measurements from the literature. In addition, spatial variations in viscosity and the extent of shear thinning of confined liquids at high shear stresses are explored. These applications demonstrate the power of in situ viscosity measurements using molecular rotors. This technique can provide insights on the state of liquids in heterogeneous and highly confined systems under conditions that cannot be studied using contemporary methods.
 | ||
| Fig. 3 Intensity response of ThT in glycerol (a) and IGEPAL (b) at various pressures measured using the pressure cell. The intensity was fitted to a stretched exponential (red lines) given by eqn (3). The instrument response function (IRF) is shown as a dashed line. Stretched exponential fits to intensity decay are shown as solid lines. | ||
Experimental
Materials
Thioflavin T (ThT) (T3516), glycerol (G7893), and IGEPAL CO-520 (238643) were obtained from Sigma-Aldrich. Glycerol and IGEPAL were chosen as model Newtonian and shear-thinning liquids. The chemical structures of glycerol and IGEPAL are depicted in Fig. 2 and their properties are listed in Table 1.| Mn (g mol−1) | η (Pa s) | α (GPa−1) | |
|---|---|---|---|
| a Data at 22.5° taken from ref. 26.b Viscosity at 25 °C determined using a cylindrical viscometer.c Based on exponential fit to experimental data from friction measurements. Mn: molecular weight, η: viscosity, α: pressure–viscosity coefficient. | |||
| Glycerol | 92.1 | 1.135a | 6.5c |
| IGEPAL CO-520 | 441 | 0.23b | 9c |
ThT is the dye molecule chosen as a model viscosity sensor in this study. It is a molecular rotor that has found widespread use in biophysics for the identification of misfolded proteins,27 which are thought to be linked to neurodegenerative diseases such as Alzheimer's. The fluorescence emission of ThT in low viscosity solutions such as water is very weak. The rotation of the benzothiazole and diaminobenzene fragments (see Fig. 2) facilitates photoinduced twisted intramolecular charge transfer,21 which quenches the fluorescence of the dye molecule. Restricting the rotation of these fragments upon binding to protein β-sheets, or due to an increase in solvent viscosity, causes up to a hundred-fold increase in the quantum yield of the rotor28 and a corresponding increase in its fluorescence lifetime. This is due to the intrinsic link between the quantum yield and the fluorescent lifetime.23
Unlike Raman scattering,15 ThT lifetime is affected by changes in viscosity rather than pressure. The fluorescence lifetime of ThT has been shown to be related to the viscosity of glass-forming liquids.28 Furthermore, pressure-induced changes in viscosity have been observed using this molecular rotor.25 However, the relationship between fluorescence lifetime and viscosity is not straightforward as the quenching of ThT may involve multiple processes, which somewhat complicates its use as a viscosity sensor. Nevertheless, its insensitivity to pressure makes it ideal for examining liquid viscosity in a point contact where there is a very large spatial variation of pressure.
Test liquids were prepared by dissolving ThT into glycerol or IGEPAL under magnetic stirring at 55 °C for at least an hour. The final ThT concentration of the solutions after filtration through a 1 μm filter (514-4027 Syringe filters, Acrodisc®, glass fibre VWR), was about 1.7 mM. This relatively high ThT concentration is required due to the limited fluorescence emission from the sub-micron thin films tested in this study.
As the liquids are hygroscopic, tests were carried out as soon as possible after depositing fresh liquid to limit changes in viscosity caused by water absorption.
High pressure, high shear viscometry in a point contact
In order to investigate the rheology of submicron thick engineering fluids at high pressure and high shear conditions, a compact rheometer was developed based on a lubricated point contact. The experimental platform consists of a point contact created by a ball rubbing against a flat disc surface (see Fig. 1a). A thin layer of test liquid is spread on the flat surface. When the ball is loaded against the flat surface under relative motion, elastic deformation of the rubbing surfaces creates a locally-flattened region. This enables the formation of a separating, confined, liquid film of almost constant thickness (see Fig. 1b). The rotational speeds of the ball, ub, and the disc, ud, are controlled separately. The entrainment speed, ue = (ub + ud)/2, i.e. the mean speed at which liquid enters the contact, governs the thickness of the confined film, h, so that a combination of ub and ud that maintains ue results in the same film thickness. Hence the shear rate,![[small gamma, Greek, dot above]](https://www.rsc.org/images/entities/i_char_e0a2.gif) = (ub − ud)/h, can be controlled by varying the relative speed of the ball and disc, while keeping ue and hence h constant.
= (ub − ud)/h, can be controlled by varying the relative speed of the ball and disc, while keeping ue and hence h constant.
The load is applied as a dead weight. The position, of the observation volume in the contact at which local viscosity is measured, was controlled using an automated microscope stage. The stabilities of this position and its intensity were about 5 μm and 5% respectively.
Three types of ball materials (glass, AISI52100 steel and tungsten carbide) and two transparent flats (glass and sapphire) were employed to cover a wide range of contact pressures. The experimental conditions are listed in Table 2. All experiments were performed at a room temperature of 21–23 °C.
| Pressure, P (GPa) | 0.2–1.2 |
| Film thickness, h (nm) | 100–300 |
| Shear rate, (s−1) |
1 × 10⁴ to 5 × 10⁵ |
The normal pressure exerted on the confined liquid, P, in a point contact depends on its relative position in the contact. P is commonly assumed to obey the stationary Hertzian parabolic pressure distribution:
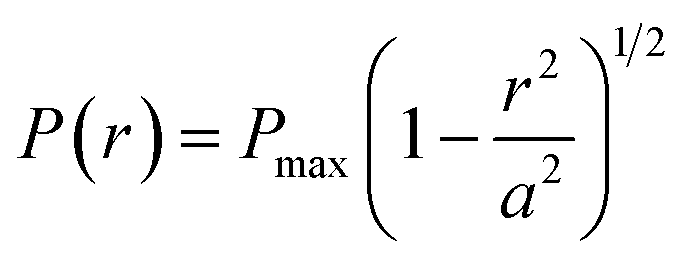 | (1) |
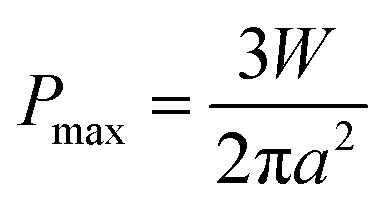 | (2) |
The film thickness of the liquid in an EHD contact was measured using optical interferometry29 with an EHD2 ultrathin film measurements system (PCS instruments). The film thickness measurements were used to calculate the average applied shear rate. Friction measurements taken using a MTM2 Mini Traction Machine (PCS Instruments) were used to compute the average shear stress. This enabled calculation of the pressure–viscosity coefficient, α, using the average strain rate obtained with film thickness measurements.
Lifetime measurement
If a molecular rotor is dissolved in the entrained liquid, the effect of applied pressure on the local viscosity can be investigated by measuring the lifetime of the fluorescence emission produced by the molecular rotor. As the viscosity of the liquid increases due to pressure, so does the lifetime. Thus longer lifetimes would be expected in the central region of the contact where the pressure is largest, (see Fig. 1b). The use of a point contact as a rheometer thus allows the effect of pressure heterogeneity on viscosity to be examined.The experimental platform was placed on an inverted microscope where a laser beam at 400 nm was directed into the confined liquid to excite the dye in the model lubricant. The laser used was a femtosecond Ti:Sapphire laser (Tsunami, Spectra Physics), which was pumped by a 5 W 532 nm laser. The output wavelength was set to 800 nm with a repetition rate of 80 MHz and a pulse width of about 80 fs. It was then frequency-doubled, resulting in a wavelength of 400 nm, with residual 800 nm radiation filtered using a 750 nm short pass filter. This 400 nm beam was then expanded, collimated, and directed into the confined liquid through an objective (20× Olympus UPlanFL N, NA = 0.5) using a dichroic mirror. The emission of the dye was collected by the same objective, passing through long pass filters to remove the excitation beam, and a tube lens, after which it was acquired using a single photon avalanche photodiode. The lifetime of ThT in the studied liquids was measured by time-correlated single photon counting (TCSPC) using an SPC-152 (Becker & Hickl) TCSPC module. The TCSPC module was connected to the output of the single photon avalanche photodiode and the synchronisation signal from the laser controller. The instrument response function of the system had a full width half maximum of 80 ps induced by limitations of the avalanche photodiode.
Care must be taken to limit laser heating of the liquid. Experiments with various laser powers and dye concentrations in model liquids were conducted to examine the effect of laser heating (results not shown). By selecting the appropriate dye concentration and laser power, the effect of laser heating could be avoided.
As described in the introduction, viscosity measurements using molecular rotors can be intensity (absolute/ratiometric) or lifetime based. Lifetime measurement was chosen over fluorescence emission intensity because the lifetime of ThT does not depend on film thickness, which changes with the entrainment speed, or on the chosen geometry of the experimental platform. In addition, lifetime based measurements allows viscosity to be measured with high spatial resolution. The spatial resolution is defined in this case by the size of the laser beam exciting the molecular rotor. This is typically limited to a few hundred nanometers due to the diffraction limit, but can potentially be surpassed using stimulated emission depletion.30
Analysis of lifetime data
The analysis of ThT lifetime data requires fitting of a model. A variety of models have been used to describe the lifetime of ThT.21,28,31 These all have in common that they describe a distribution of lifetimes. The stretched exponential21,28 is frequently used to describe the lifetime of molecular rotors with complex quenching mechanisms.32 It is defined as| I(t) = Ae−(t/τ)n | (3) |
Lifetime–viscosity calibration
The effect of viscosity on the lifetime of ThT was calibrated using a custom pressure cell, which allowed the test liquids to be pressurised hydrostatically from 0–650 MPa. All test liquids were stored in desiccators and were added to the pressure cell immediately before the test to minimise water contamination.Once the pressure cell was filled and a desired pressure was reached, it was left to stabilise for around 40 s before a lifetime measurement was taken. The pressure cell had two windows perpendicular to one another. The ThT-doped liquid was excited through one of the windows, and the fluorescence emission was collected through the second window. Fluorescence collection and lifetime extraction was conducted as described in the previous section. The relationship between the lifetime of ThT in glycerol and the applied pressure was linear as shown in Fig. 4a (solid symbols). This relationship was combined with pressure–viscosity data from the literature26 to obtain the relationship between the viscosity of glycerol and the lifetime of ThT (open circles in Fig. 4a insert). This viscosity–lifetime calibration enabled the determination of local viscosity based on ThT lifetime in the confined liquid film.
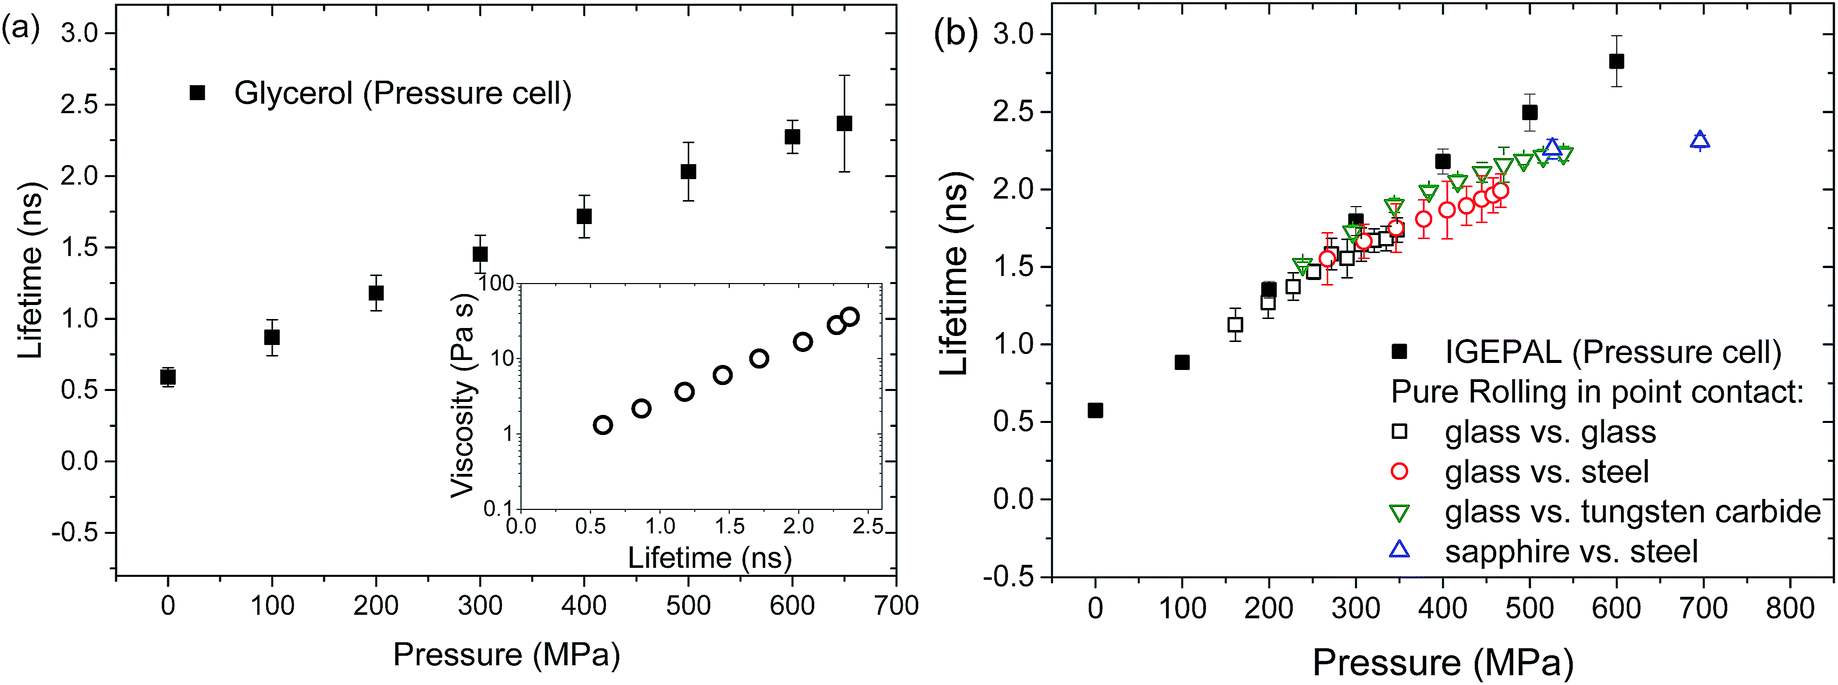 | ||
| Fig. 4 (a) Variation of ThT lifetime with pressure for glycerol obtained in the pressure cell. The insert shows the calibration curve for glycerol, showing the relationship between ThT lifetime and viscosity. (b) The relationship between ThT lifetime in IGEPAL and applied pressure obtained with a pressure cell (filled squares) and at the centre of the contact under pure rolling conditions (thickness ≈ 140 nm) (unfilled symbols). | ||
A similar linear lifetime–pressure relationship is obtained for IGEPAL (solid symbols, Fig. 4b). While the viscosity of IGEPAL is about 5 to 10 times lower than that of glycerol in ambient conditions, ThT has a long lifetime in IGEPAL. Therefore no direct conversion between lifetime and viscosity could be carried out since no pressure–viscosity data is available for IGEPAL.
Results and discussion
Pressure–viscosity relationships using fluorescence lifetime measurement
Thin films of ThT-doped glycerol were entrained in a rolling/sliding ball on flat contact. The effect of pressure on the viscosity of these films was examined by measuring ThT fluorescence lifetime at various applied loads. This determined the range of viscosities that could be measured using the proposed technique, as well as the accuracy of these measurements.The fluorescence lifetime of ThT in a confined glycerol film was acquired in pure rolling conditions (ub = ud = ue = 74 mm s−1) at the centre of the contact (x = y = 0) where the pressure is largest (see Fig. 1b). The applied pressure ranged from 200 MPa to 1.2 GPa, which is similar to pressures commonly encountered in engineering components such as bearings and gears. For these experimental conditions, the film thickness is about 170 nm and the liquid does not experience any significant shear stress. The lifetime of ThT at various pressures, and the corresponding viscosity of glycerol deduced from the calibration shown in Fig. 4a are presented in Fig. 5 (unfilled symbols). Fig. 5 also shows the bulk glycerol viscosity obtained from the pressure cell experiments (solid squares). The relationship between pressure and viscosity at moderate pressures (less than 1 GPa) can be described by the Barus relationship, which is given by
| η = η0eαP | (4) |
 | ||
| Fig. 5 (a) The ThT lifetime and (b) viscosity of confined glycerol at the centre of a point contact (ue = ub = ud = 74 mm s−1; shear rate = 0 and film thickness = 170 nm) obtained by ThT lifetime measurements (unfilled symbols) and of bulk glycerol in a pressure cell (filled squares). | ||
In a rolling contact, the local viscosity of a confined glycerol film increases with pressure and results obtained with different material pairs (unfilled symbols, see legends in Fig. 5) overlap. This shows that the measured viscosity is a direct function of pressure and is not affected by the properties of the confining surfaces. These values are however lower than values taken in the pressure cell (solid symbols in Fig. 5). This is not caused by ThT being insensitive to high viscosity as a similar range of viscosities was observed in the pressure cell experiments (unfilled symbols, Fig. 5).
Glycerol is a well-known Newtonian liquid. As tests in a point contact were conducted under pure rolling conditions it is very unlikely that the difference in glycerol properties in a pressure cell and in a rolling contact is due to shear thinning. Glycerol is also hygroscopic, meaning that its viscosity drops with time once it is in contact with the ambient atmosphere. While test liquids were stored in a desiccator, some changes in glycerol viscosity could still occur. Since glycerol has no contact with air once it is in the pressure cell, the issue of water absorption is minimised in the calibration experiments. However for the rolling contact experiments a thin layer of glycerol was spread on the disc, exposing a large surface area. This is likely to promote water absorption. This may result in a reduction in glycerol viscosity before glycerol enters the contact during the confined glycerol experiments. Control experiments on how ThT lifetime in confined glycerol changes over time were conducted and a reduction of ThT lifetime was observed. The lifetime of ThT in confined neat glycerol dropped significantly over 15 minutes resulting in a lifetime equivalent to that of glycerol with 7 wt% water (results not shown). The increased exposure to ambient atmosphere and hence an increased amount of absorbed water in the glycerol in the rolling contact experiments may explain the lower than expected viscosity, and its deviation from the Barus relationship.
ThT lifetime in confined IGEPAL in a pure rolling contact and bulk IGEPAL in the pressure cell are compared in Fig. 4b. The two sets of data match well, showing that the use of ThT lifetime enables the investigation of viscosity in a confined film. Note that IGEPAL is not as susceptible to water absorption as glycerol. This supports the observed discrepancies in data between glycerol in bulk and glycerol in confinement being due to absorbed water.
At high applied pressures, ThT lifetimes of both confined glycerol and IGEPAL deviates from measurements taken from their bulk counterparts. This may be due to uncertainties in area estimation and applied pressure at high load conditions. The actual normal pressure could be lower and hence, the differences in ThT lifetime in confined and bulk liquid at high load may be smaller than those presented Fig. 4b and 5.
The results show the range of viscosities and pressures that can be studied using ThT and the point-contact-based viscometer. It verifies the suitability of the proposed fluorescence lifetime measurement for measuring the viscosity of submicron thick films at high pressures and high shear conditions.
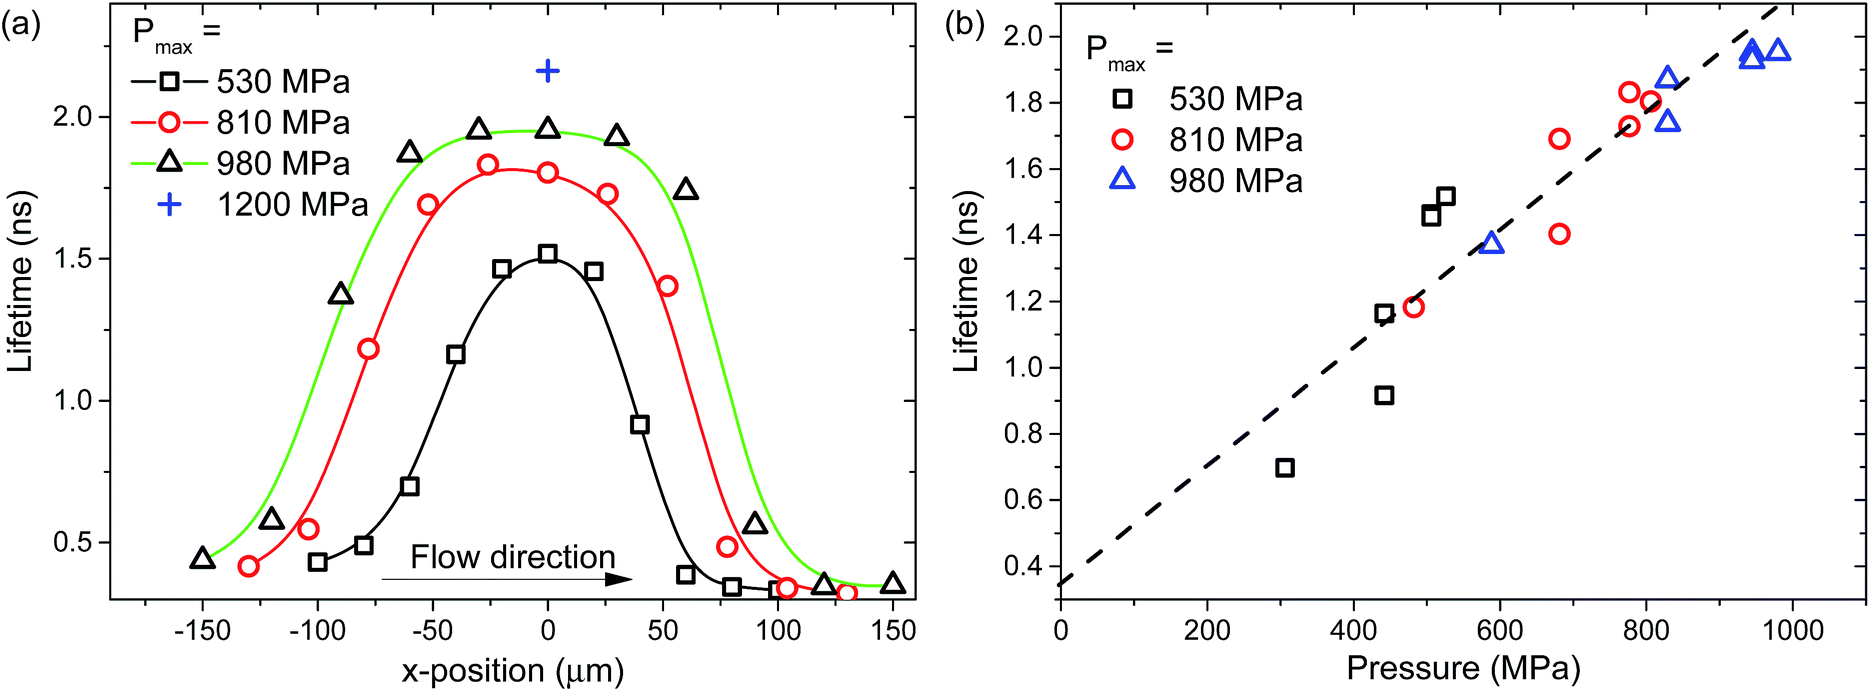
Spatial viscosity distribution in a confined film
The pressure experienced by confined liquids in a point contact is position-dependent. Hence spatial viscosity heterogeneity is expected in such confined liquids. Local viscosity mapping can be conducted in one or two dimensions. The two-dimensional ThT lifetimes and the corresponding viscosity distributions of confined glycerol films at peak pressure, Pmax = 530 MPa in pure rolling conditions (ub = ud = ue = 74 mm s−1) are shown in Fig. 6a and b respectively. The one-dimensional ThT lifetime plots in the x-direction, along the centre of the contact (dashed line as shown in Fig. 6a), are also presented in Fig. 7a (squares). Large spatial variations within the contact are observed. The local ThT lifetime (Fig. 6a, and 7a) and hence viscosity (Fig. 6b) increases as glycerol travels from the inlet towards the centre of the contact. They then drop as glycerol approaches the outlet of the contact. These distributions have near circular symmetry as expected from a Hertzian pressure distribution as described by eqn (1). The size of the region where lifetime and hence viscosity heterogeneity is detected compares well with the measured contact size of 2a = 150 μm (dashed circle in Fig. 6a). The local viscosity of confined glycerol in this loading condition ranges from 0.5 to 8 Pa s. Note the lifetime distribution does not show a large increase with pressure compared to the viscosity rise. This is because lifetime increases linearly while viscosity increases exponentially with pressure. Hence ThT lifetime seems to plateau around the centre of the contact while viscosity continues to rise and peaks at around x = 0. | ||
| Fig. 6 (a) Variation of ThT lifetime in glycerol confined in a point contact. 121 data points in a grid of 11 × 11 was acquired and the data is plotted as a contour plot (Pmax = 530 MPa, ub = ud = ue = 74 mm s−1, h = 170 nm). The white circle corresponds to the contact area (2a = 150 μm). (b) The corresponding viscosity map based on (a). | ||
 | ||
| Fig. 7 (a) Variation of ThT lifetime in glycerol confined in a point contact at various loading conditions; (b) the effect of local pressure on ThT lifetime at various loading conditions. All lines are for guidance only. | ||
The effect of pressure is further analysed using one-dimensional ThT lifetime plots (Fig. 7a) taken along the x-direction along the centre of the contact (dashed line as shown in Fig. 6a) for various loading conditions. Raising the applied pressure from Pmax = 530 MPa (squares in Fig. 7a) to Pmax = 980 MPa (triangles in Fig. 7a) gives rise to an overall increase in the ThT lifetime (hence viscosity) distribution. Note that the x-position where the same pressure level is reached differs for different loads. In addition, the x-position defines the duration the liquid has been in the contact. This is related to the relaxation of the liquid. When plotting local ThT lifetime against the local normal pressure estimated using the Hertzian pressure distribution (eqn (1)) for various loading conditions (under pure rolling conditions), they all overlap (see Fig. 7b). Fig. 7b suggests that the observed variations in lifetime (hence viscosity) of confined glycerol is pressure-induced and no aging effect is observed. This demonstrates the validity of the applied methodology in detecting local viscosity heterogeneity.
Effects of shear rate on local viscosity of confined liquids
Liquids in lubricated non-conforming contacts are exposed to both high pressures and high shear rates. For many liquids this can lead to a reduction in viscosity with shear rate, a phenomenon called shear thinning. The local ThT lifetime of glycerol and IGEPAL films at the centre of a ball on flat contact was examined at various shear rates. Glycerol shows constant lifetime, hence constant viscosity throughout the range of tested shear rates (Fig. 8a). This is consistent with glycerol behaving as a Newtonian liquid,33 over the range of pressures and shear rates examined. By contrast IGEPAL undergoes shear thinning (Fig. 8b) as shown by a reduction in ThT lifetime as shear rate increases. The effect of shear thinning is more pronounced as pressure increases. This observation is consistent with behaviour of other shear thinning liquids.34 The average viscosity for both liquids at various pressures was also obtained with friction measurements (results not shown). Qualitatively similar behaviour was observed. These results indicate that fluorescence lifetime measurements are capable of differentiating liquid behaviour at high pressure and high shear conditions. | ||
| Fig. 8 (a) Variation of ThT lifetime in (a) glycerol and (b) IGEPAL; confined in a point contact at various shear rates. All lines are for guidance only. | ||
Since the fluorescence lifetime of ThT depends on the rigidity of its environment, how ThT lifetime changes with the shear rate can provide information on how the structure of the test liquid evolves. This is crucial for identifying the origins of phenomena such as shear thinning observed with IGEPAL. IGEPAL is a non-ionic surfactant with polyoxyethylene (EO) head groups, consisting of 5 EO residues, and a hydrophobic tail. It forms a structure to minimise contact between EO groups and hydrophobic groups. In ambient conditions this may result in a polydomain structure (for example lots of small multi-layer domains or multi-laminar vesicles) or a laminar structure.35 Shear thinning depends on rearrangement of liquid molecules in response to applied pressure and shear. In the case of IGEPAL, the type and size of domains36,37 and degree of ordering38,39 are governed by the applied shear rate. Note that ThT is a cationic dye which may reside on the EO residual layers within the IGEPAL layers. Its dimethyl amino group, and possibly the benzene ring can reside in hydrophobic layers as has been observed for a similar dye Safranine T.40 Hence the results in Fig. 8 suggest that the microstructural change in IGEPAL is accompanied by a reduction in rigidity of surfactant layers, which has been successfully detected by ThT lifetime measurements. This highlights the unique capability provided by the combination of friction and fluorescence lifetime measurements in terms of improving our understanding of the origins of friction and rheological changes of confined lubricants.
Conclusions
The use of molecular rotor lifetime measurements enables the probing of viscosity, with a high spatial resolution in inaccessible geometries, in a fashion that cannot be achieved using mechanical methods. Depending on the dye, the viscosity range can span multiple orders of magnitude. The combination of these features, together with the use of a point-contact-based high pressure, high shear viscometer, makes the method particularly suitable for engineering applications.By measuring the local viscosity of confined Newtonian and shear thinning liquids, it was shown that molecular rotors can be used to monitor pressure and shear induced changes in viscosity. For the first time, local viscosity measurements have been performed in a confined thin film where the viscosity heterogeneity/distribution has been quantified. More importantly, the measurements were the first to be conducted at simultaneous high pressure (up to 1.2 GPa) and high shear (up to = 105) conditions with significant engineering relevance, specifically in fuels and lubricants. This also has the potential to resolve issues in the field of physics of liquids where phenomena such as slip6,41,42 and confinement5,43 have sparked controversies in terms of the accuracy of experimental methods. Fluorescence lifetime imaging with molecular rotors could for example be used to verify the accuracy of models for hydrodynamic drainage forces44 used to measure friction in these systems.45
In the field of tribology the technique could be used to reconcile the debate concerning the most appropriate rheological model to describe lubricant behaviour in non-conforming contacts.46 Currently, this is done by measuring the average friction in contacts or with high-pressure rheometers. Neither of these can determine the viscosity distribution in a contact at the relevant conditions. Establishing the accuracy of models would serve to optimise the design of lubricants and tribological systems leading to reductions in energy use. The method could also be used to probe the viscosity of mixtures which plays an important role where fuel meets lubricant at the top piston ring reversal point, in an engine, as well as in many other drivetrain systems. It should be noted that the addition of a robust calibration method to account for potentially differing lifetime/viscosity relationships of the differing solvents may be required.
These are just a few applications where this technique could become a useful tool for improving models describing the state of liquids. Given the vast amount of applications where viscosity plays a significant role the developed in situ rheometry technique will have a great impact in both physics and engineering.
Acknowledgements
This work is supported by EPSRC research grant no. EP/J015385/1, and EP/L023202/1. JD is supported by the Shell University Technology Centre for Fuels and Lubricants at Imperial College London. The authors gratefully acknowledge Dr Changki Min and Dr Mourad Chennaoui for help in the design of frequency doubler and mechanical devices respectively; and Prof Hugh Spikes and Dr Luca di Mare for very fruitful discussions.Notes & references
- C. Evans and K. Johnson, Proc. Inst. Mech. Eng., Part C, 1986, 200, 303–312 CrossRef.
- J. N. Israelachvili and S. J. Kott, J. Chem. Phys., 1988, 88, 7162 CrossRef CAS.
- N. Ahmed, D. F. Nino and V. T. Moy, Rev. Sci. Instrum., 2001, 72, 2731 CrossRef CAS.
- O. I. Vinogradova and G. E. Yakubov, Langmuir, 2003, 19, 1227–1234 CrossRef CAS.
- H. W. Hu and S. Granick, Science, 1992, 258, 1339–1342 CAS.
- S. Granick, Y. Zhu and H. Lee, Nat. Mater., 2003, 2, 221–227 CrossRef CAS PubMed.
- E. Bonaccurso, M. Kappl and H.-J. Butt, Phys. Rev. Lett., 2002, 88, 1–4 CrossRef PubMed.
- K. Luby-Phelps, S. Mujumdar, R. B. Mujumdar, L. A. Ernst, W. Galbraith and A. S. Waggoner, Biophys. J., 1993, 65, 236–242 CrossRef CAS PubMed.
- B. A. Nemet, Y. Shabtai and M. Cronin-Golomb, Opt. Lett., 2002, 27, 264–266 CrossRef PubMed.
- B. J. Hamrock and D. Dowson, J. Lubr. Technol., 1977, 99, 264 CrossRef CAS.
- M. Hartinger, M.-L. Dumont, S. Ioannides, D. Gosman and H. Spikes, J. Tribol., 2008, 130, 041503 CrossRef.
- A. Erdemir, Surf. Coat. Technol., 1992, 54–55, 482–489 CrossRef.
- S. Bair, Proc. Inst. Mech. Eng., Part J, 2001, 215, 223–233 CrossRef.
- S. Kasolang and R. S. Dwyer-Joyce, Proc. Inst. Mech. Eng., Part J, 2008, 222, 423–429 CrossRef.
- I. Jubault, J. L. Mansot, P. Vergne and D. Mazuyer, J. Tribol., 2002, 124, 114 CrossRef.
- H. Hamza, S. M. B. Albahrani, G. Guillot, M. Maillard, D. Philippon, P. Vergne and J. M. Bluet, J. Phys. Chem. C, 2015, 119, 16897–16904 CAS.
- M. K. Kuimova, Phys. Chem. Chem. Phys., 2012, 14, 12671–12686 RSC.
- M. A. Haidekker, W. Akers, D. Lichlyter, T. P. Brady and E. A. Theodorakis, Sens. Lett., 2005, 3, 42–48 CrossRef CAS.
- M. A. Haidekker, T. P. Brady, D. Lichlyter and E. A. Theodorakis, J. Am. Chem. Soc., 2006, 128, 398–399 CrossRef PubMed.
- M. K. Kuimova, S. W. Botchway, A. W. Parker, M. Balaz, H. A. Collins, H. L. Anderson, K. Suhling and P. R. Ogilby, Nat. Chem., 2009, 1, 69–73 CrossRef CAS PubMed.
- V. I. Stsiapura, A. A. Maskevich, V. A. Kuzmitsky, V. N. Uversky, I. M. Kuznetsova and K. K. Turoverov, J. Phys. Chem. B, 2008, 112, 15893–15902 CrossRef CAS PubMed.
- M. K. Kuimova, G. Yahioglu, J. A. Levitt and K. Suhling, J. Am. Chem. Soc., 2008, 130, 6672–6673 CrossRef CAS PubMed.
- J. A. Levitt, P.-H. Chung, M. K. Kuimova, G. Yahioglu, Y. Wang, J. Qu and K. Suhling, ChemPhysChem, 2011, 12, 662–672 CrossRef CAS PubMed.
- M. A. Haidekker and E. A. Theodorakis, Org. Biomol. Chem., 2007, 5, 1669–1678 CAS.
- N. Amdursky, R. Gepshtein, Y. Erez, N. Koifman and D. Huppert, J. Phys. Chem. A, 2011, 115, 6481–6487 CrossRef CAS PubMed.
- R. L. Cook, C. A. Herbst and H. E. King, J. Phys. Chem., 1993, 97, 2355–2361 CrossRef CAS.
- T. Ban, D. Hamada, K. Hasegawa, H. Naiki and Y. Goto, J. Biol. Chem., 2003, 278, 16462–16465 CrossRef CAS PubMed.
- N. Amdursky, R. Gepshtein, Y. Erez and D. Huppert, J. Phys. Chem. A, 2011, 115, 2540–2548 CrossRef CAS PubMed.
- R. Glovnea, A. Forrest, A. Olver and H. Spikes, Tribol. Lett., 2003, 15, 217–230 CrossRef CAS.
- S. W. Hell and J. Wichmann, Opt. Lett., 1994, 19, 780 CrossRef CAS PubMed.
- P. K. Singh, M. Kumbhakar, H. Pal and S. Nath, J. Phys. Chem. B, 2010, 114, 5920–5927 CrossRef CAS PubMed.
- K. C. Lee, J. Siegel, S. E. Webb, S. Lévêque-Fort, M. J. Cole, R. Jones, K. Dowling, M. J. Lever and P. M. French, Biophys. J., 2001, 81, 1265–1274 CrossRef CAS PubMed.
- K. Schröter and E. Donth, J. Chem. Phys., 2000, 113, 9101 CrossRef.
- S. Bair, Proc. Inst. Mech. Eng., Part J, 2002, 216, 1–17 CrossRef CAS.
- D. J. Mitchell, G. J. T. Tiddy, L. Waring, T. Bostock and M. P. McDonald, J. Chem. Soc., Faraday Trans. 1, 1983, 79, 975 RSC.
- J. Zipfel, F. Nettesheim, P. Lindner, T. D. Le, U. Olsson and W. Richtering, Europhys. Lett., 2001, 53, 335–341 CrossRef CAS.
- T. D. Le, U. Olsson, K. Mortensen, J. Zipfel and W. Richtering, Langmuir, 2001, 17, 999–1008 CrossRef CAS.
- O. Diat, D. Roux and F. Nallet, Phys. Rev. E: Stat. Phys., Plasmas, Fluids, Relat. Interdiscip. Top., 1995, 51, 3296–3299 CrossRef CAS.
- P. Sierro and D. Roux, Phys. Rev. Lett., 1997, 78, 1496–1499 CrossRef CAS.
- S. K. Ghosh, P. K. Khatua and S. C. S. C. Bhattacharya, J. Colloid Interface Sci., 2004, 275, 623–631 CrossRef CAS PubMed.
- R. Pit, H. Hervet and L. Léger, Phys. Rev. Lett., 2000, 85, 980–983 CrossRef CAS PubMed.
- D. Lumma, A. Best, A. Gansen, F. Feuillebois, J. O. Rädler and O. I. Vinogradova, Phys. Rev. E: Stat. Phys., Plasmas, Fluids, Relat. Interdiscip. Top., 2003, 67, 056313 CrossRef CAS PubMed.
- A. Cuenca and H. Bodiguel, Phys. Rev. Lett., 2013, 110, 108304 CrossRef PubMed.
- O. I. Vinogradova, Langmuir, 1995, 11, 2213–2220 CrossRef.
- H. Spikes and S. Granick, Langmuir, 2003, 19, 5065–5071 CrossRef.
- H. Spikes and Z. Jie, Tribol. Lett., 2014, 56, 1–25 CrossRef.
Footnotes |
| † These authors contributed equally to this work. |
| ‡ Current address: Department of Chemistry, University of Cambridge, Cambridge, CB2 1 EW, UK. |
| This journal is © The Royal Society of Chemistry 2015 |