
Maximizing fibroblast adhesion on protein-coated surfaces using microfluidic cell printing
S. N. Davidoff†
a,
D. Au†a,
B. K. Galeb,
B. D. Brooks‡
a and
A. E. Brooks‡*cd
aWasatch Microfluidics, Salt Lake City, UT 84103, USA
bDepartment of Mechanical Engineering, University of Utah, Salt Lake, UT 84112, USA
cDepartment of Pharmaceutics, University of Utah, Salt Lake City, UT 84112, USA
dDepartment of Pharmaceutical Sciences, North Dakota State University, Fargo, ND 58105, USA. E-mail: amanda.e.brooks@ndsu.edu
First published on 18th November 2015
Abstract
Translation of in vitro cell based assays to in vivo cellular response is imprecise at best. The advent of three-dimensional cell cultures in addition to bioreactor type microfluidics has improved the situation. However, these technical advances cannot be easily combined due to practical limitations. Development of a vertical microfluidic cell printer overcomes this obstacle, providing the ability to more closely recapitulate complex cellular environments and responses. As a proof of concept, we investigated the adhesion of fibroblasts under flow on protein-coated surfaces using a novel vertical microfluidic print head to isolate and manipulate both mechanical and biological factors as a model of fibroblast behavior during the foreign body response following implant insertion. A low flow rate with larger microfluidic channels onto a serum-coated surface has been determined to allow the highest density of viable fibroblasts to attach to the surface. While these insights into fibroblast surface attachment may lead to better material designs, the methods developed herein will certainly be useful as a biomaterials testing platform.
Introduction
Over the last decade the appeal of “lab-on-a-chip” microfluidic devices has increased in relation to their miniaturization, high-throughput capability, and low sample consumption.1 Unfortunately, microfluidic designs have not fulfilled their promise for in vivo relevant cellular assays due to their limiting two-dimensional nature, which prevents important three-dimensional cellular contacts, particularly critical in the case of the chronic foreign body response (FBR). Nevertheless, microfluidics offer a valuable in vitro tool to study biologically applicable, cellular responses under flow since cells, particularly those attached to implants, are often subjected to flowing biological milieu, such as blood and lymph.2,3 Founded on fundamental biological fluid dynamics, the microfluidic printing of cells can determine the attachment strength of cells to different material surfaces.1,4,5Cellular adhesion is not only altered by the mechanical microenvironment, but also by the composition of the cellular substrate. In the case of an implanted biomedical device, host proteins coat the device surface almost immediately and mediate all cellular interactions, promoting cellular recruitment and adhesion, ultimately masking the underlying implant surface.2,6 The potentially pathological wound healing response that occurs in the presence of an implanted material (i.e., foreign body response (FBR)) represents a coordinated inflammation cascade directed by responding macrophages that act to recruit host cells, such as fibroblasts, in an organized effort to sequester the implant3,7 (Fig. 1). Although cellular and surface factors that arbitrate the interactions of macrophages with a foreign material have been well characterized,6,8–12 the precise interaction of fibroblasts and a host protein encapsulated foreign material is less understood. Nevertheless, fibroblasts are the primary cell type responsible for matrix deposition; essentially walling off the material from the rest of the body and preventing the full integration of the material or device into the native tissue.3,13 An understanding of the integration of fibroblasts in the foreign body response, particularly their attachment to the host proteins that coat the implanted foreign material, is key to the biocompatibility, longevity, and functionality of the medical device.3 By manipulating the host protein adlayer and promoting healthy cellular adhesion with native extracellular matrix proteins such as albumin, the device/host tissue interaction can be improved, thereby improving the device functionality, reducing infection,7 and increasing life-span.14–17 Using a vertical flow microfluidics platform, the cell/material interface can be modelled and manipulated to tease apart the cellular attachment to an implant surface while maintaining a more physiologically relevant cellular microenvironment.
 | ||
| Fig. 1 Steps of the host foreign body response following the implantation of a device/foreign material from both the tissue perspective (yellow) and the biomaterial (blue). Notice that the exudate tissue and the biomaterial interface are intimately connected. | ||
As a proof of concept, this article describes the development and utility of a vertical Continuous Flow Microspotter (CFM) to deposit fibroblasts onto various protein-coated (i.e. collagen, fibrinogen, albumin, and serum) surfaces (i.e. tissue culture polystyrene) as a first step in developing a simplified, yet FBR relevant, in vitro cell culture model. Controlled flow conditions, designed to impose differing shear stress intensity on the fibroblasts were also explored. The vertical flow CFM can better replicate events that take place during the FBR because of the CFM's ability to regulate flow conditions and substrates and provide depth to the cellular model when compared to two-dimensional microfluidic platforms (see Fig. 2). Additionally, a vertical print head can alter the printing environment to accommodate different cell lines, such as macrophages and neutrophils, and to recapitulate the complexity of the cellular response in an iterative way. Added complexity can also provide a platform for more relevant morphological studies.
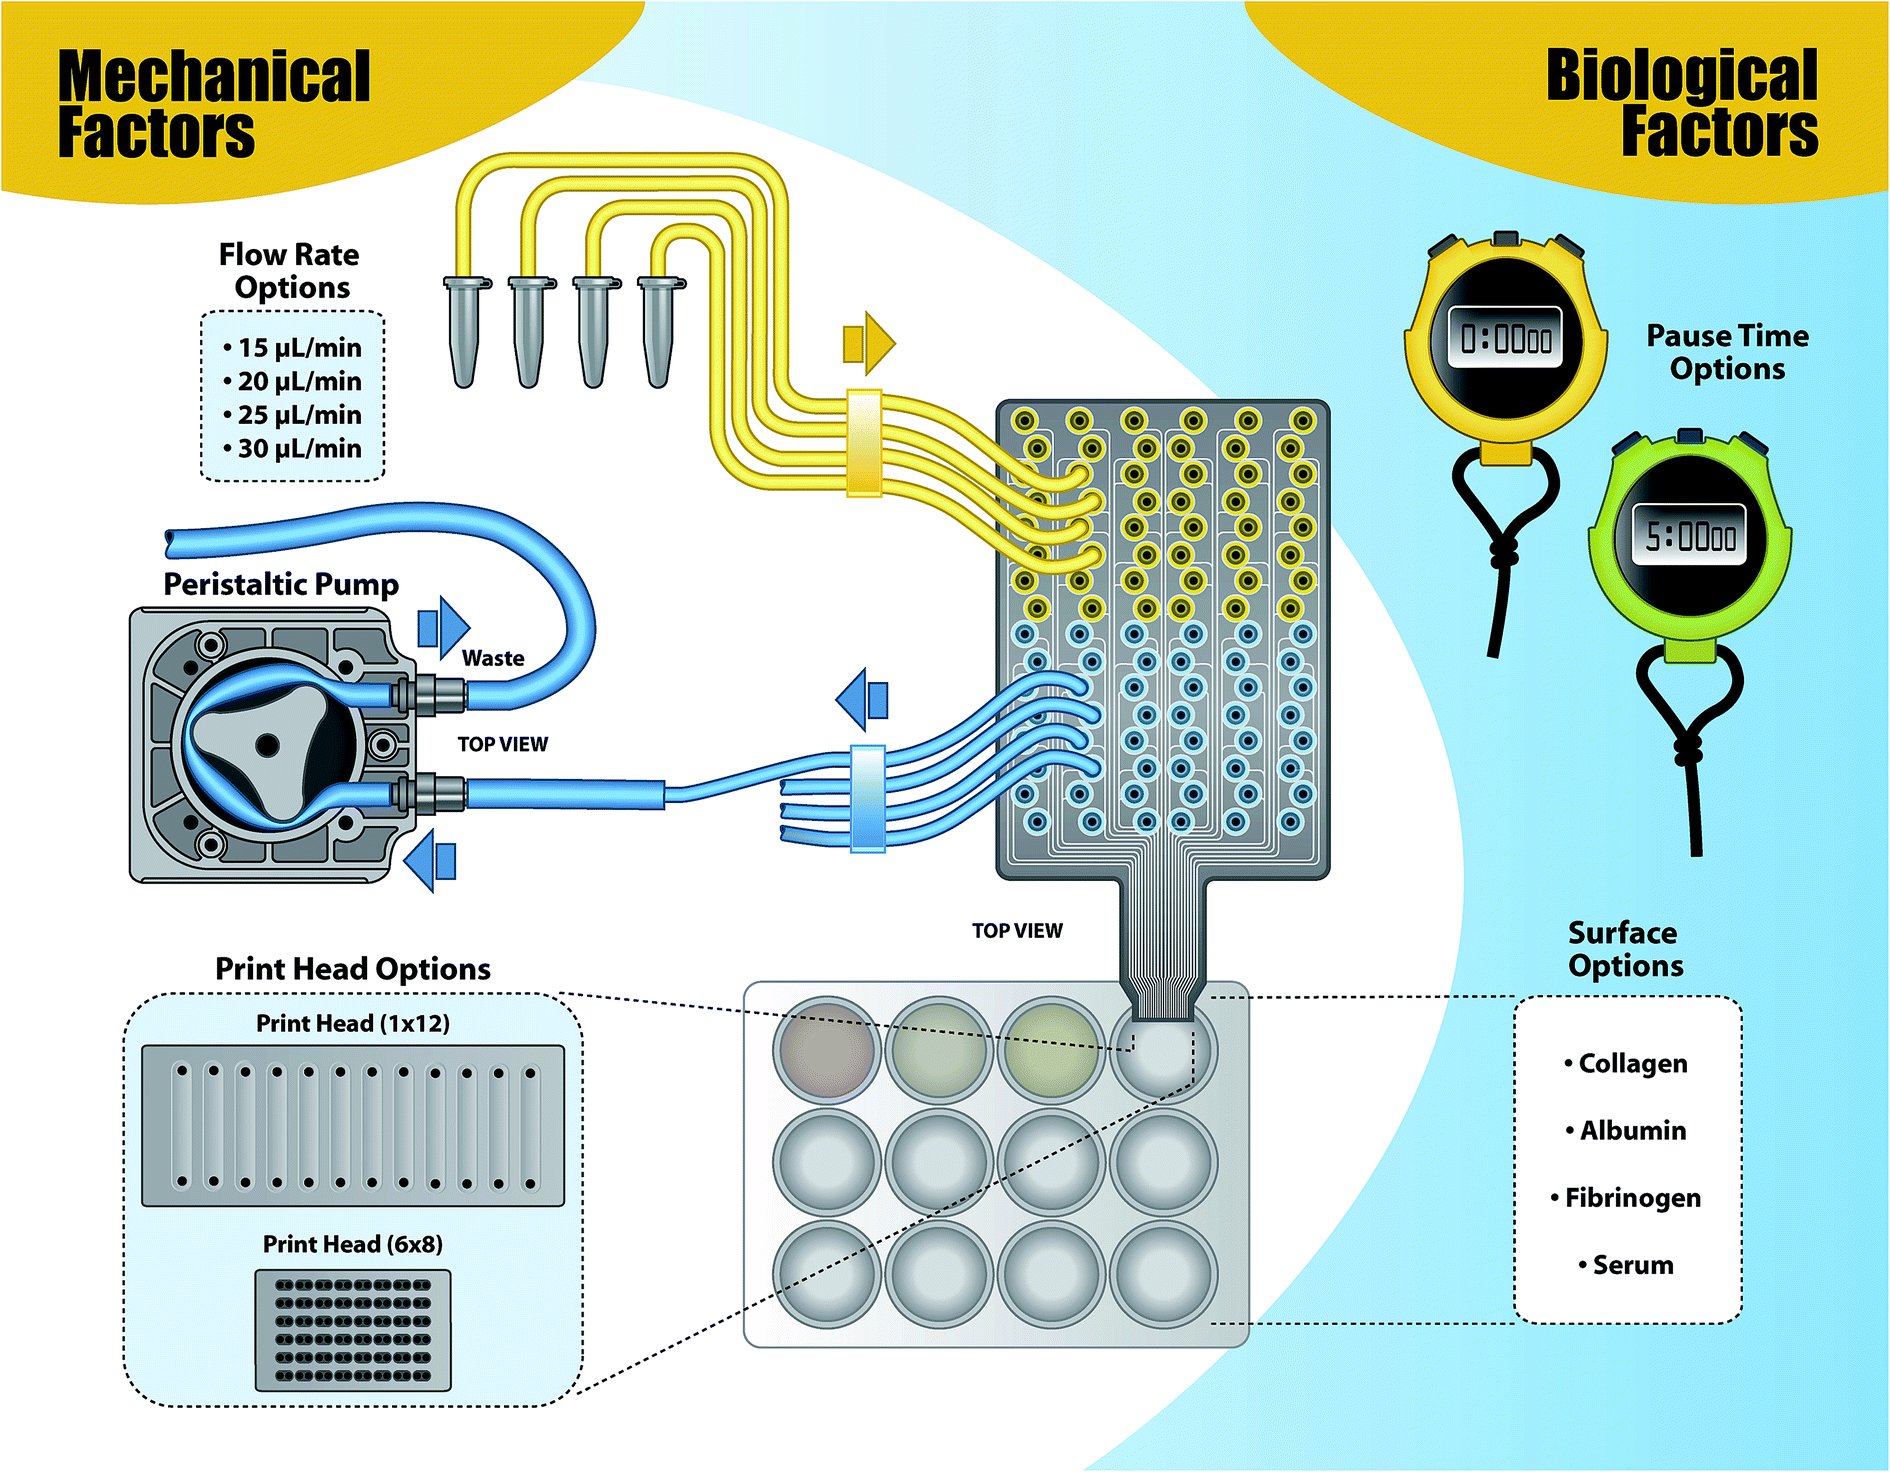 | ||
| Fig. 2 Schematic of the cell printing set-up including the various parameters tested to determine the effects of mechanical and biological factors on fibroblast attachment. | ||
A thorough discussion of the advantages of using vertical printing in a submerged environment has been previously reported.18 Briefly, the CFM allows for the sealing and printing of cellular microarrays onto submerged surfaces in an automated and multiplexed manner. The CFM creates a microfluidic flow cell array (MFCA) when the vertical printhead tip is lowered into a liquid-filled well and subsequently forms a watertight seal on the bottom of the well. Other cell printing technologies, such as pin or ink-jet printers, are not capable of printing in submerged applications. A traditional, two-dimensional flow cell also has limited throughput and only allows for longer cell “spots”. Conversely, a vertical, submerged print allows cells to maintain desired phenotypes without disturbing the material surface characteristics. Applications of vertical, submerged-printed, cell microarrays include “drug screening and cytotoxicity assessment in a multitude of areas including cancer, diabetes, inflammation, infections, and cardiovascular disease”.18
In this work, the versatility of the CFM is used to not only alter the surface, but also the flow rates, tubing size, print head dimensions, and surface contact time (pause time). These parameters are grouped into either mechanical parameters (i.e., tubing size, print head dimensions, print pauses) or biological parameters (i.e., flow rate and surface biology). These five general parameters can also be classified by those that affect shear stress (i.e., tubing size, print head, flow rate) and those that affect cellular adhesion (surface biology, pause times). Using a comprehensive matrix of these mechanical and biological factors, printing conditions that led to the greatest cell density, cellular viability, and adhesion strength were identified as the standard print conditions. Testing various vertical printing conditions with the aforementioned mechanical and biological factors allowed us to determine printing parameters that can (1) produce a high or low cell surface density and (2) build increasingly complex in vitro cell culture models with increased throughput and decreased sample consumption.
Results and discussion
Although parameters for planar flow microfluidic cell printing are relatively well established,19,20 vertical printing parameters and conditions were explored in an effort to define standard vertical printing parameters to produce a single layer of fibroblasts with maximal surface area coverage, as well as to tease apart fibroblast adhesion on various proteins. A variety of mechanical (i.e., tubing diameters, print head dimensions, and flow rates) and biological factors (i.e., surface protein coatings, pause times) were considered (Fig. 2). Shear stress, average velocity, Reynolds number, and Péclet number were calculated based on the fluid viscosity of DMEM with 10% serum, the diffusion coefficient for fibroblasts in media, the flow rates used, the radius of a fibroblast, and the dimensions of the flow cells in the print head (Table 1). Calculation of the Reynolds number indicated that all conditions tested would produce laminar flow (Re < 2000). The highest Reynolds number, which fell well below the threshold for turbulent flow, occurred at the highest flow rate used for the 12 channel print head, while the highest shear stress was found for the lowest flow rate considered for the 48 channel print head. Not surprisingly, the Péclet number followed the trend in average velocity, with the highest velocity being achieved in the 48 channel printhead despite the use of the lowest flow rate.| Flow rate (Q) | Print head | Surface coating | Velocity (m s−1) | Shear stress (dyn cm−2) | Reynolds number | Péclet number |
|---|---|---|---|---|---|---|
| Q/(WH) | μ((6Q)/(WH)) | Qρ/(W + H)η | (3vRb3)/2(H0/2)2D | |||
| a μ = 0.007 g cm−1 s; ρ = 1.007 g mL−1; η = 1.011 Pa s; Rb = 9 × 10⁻⁶; D = 1 × 10⁻⁹. | ||||||
| 15 μL min−1 | 12 channel | Serum | 0.00083 | 0.12 | 1.92 × 10⁻⁷ | 4.05 × 10⁻¹¹ |
| 20 μL min−1 | 12 channel | Serum | 0.00111 | 0.16 | 2.55 × 10⁻⁷ | 5.40 × 10⁻¹¹ |
| 25 μL min−1 | 12 channel | Serum | 0.00139 | 0.19 | 3.19 × 10⁻⁷ | 6.75 × 10⁻¹¹ |
| 30 μL min−1 | 12 channel | Serum | 0.00167 | 0.23 | 3.83 × 10⁻⁷ | 8.10 × 10⁻¹¹ |
| 15 μL min−1 | 48 channel | Serum | 0.00196 | 0.33 | 3.28 × 10⁻⁷ | 1.37 × 10⁻¹⁰ |
The standard printing condition was determined experimentally to optimize cell density by printing cells on a serum-coated surface at 15 μL min−1 flow rate using 250 μm tubing in a 12 channel print head with a 5 minute pause half way through the print to allow adhesion and gravitational settling; therefore, all data were statistically compared to this condition. Importantly, in the absence of the pause time, 43% less cells attached to the serum-coated surface. Tubing diameter and print head dimensions, both mechanical factors, were significantly different than the standard print (p = 0.00016, p = 0.00038, respectively), with the standard print providing a significantly higher cell density than prints produced from varying any of the mechanical factors tested in this study (Fig. 3). A higher flow rate than the standard print had a significantly lower cell density than the standard print (20 μL min−1: p = 0.0016, 25 μL min−1: p = 0.026, 30 μL min−1: p = 0.0025) as shown in Fig. 5. Concurrently, the velocity, and shear stress increased with increasing flow as did the Péclet number. Despite increasing shear rates and velocity, the flow rate, tubing diameter, and print head configuration did not appear to have an effect on the cell morphology as the cells appeared rounded in all cases (Fig. 4). Importantly, in the identified “standard print condition” cells appeared to be evenly distributed along the length of the channel while cells were only sparsely distributed in the other conditions.
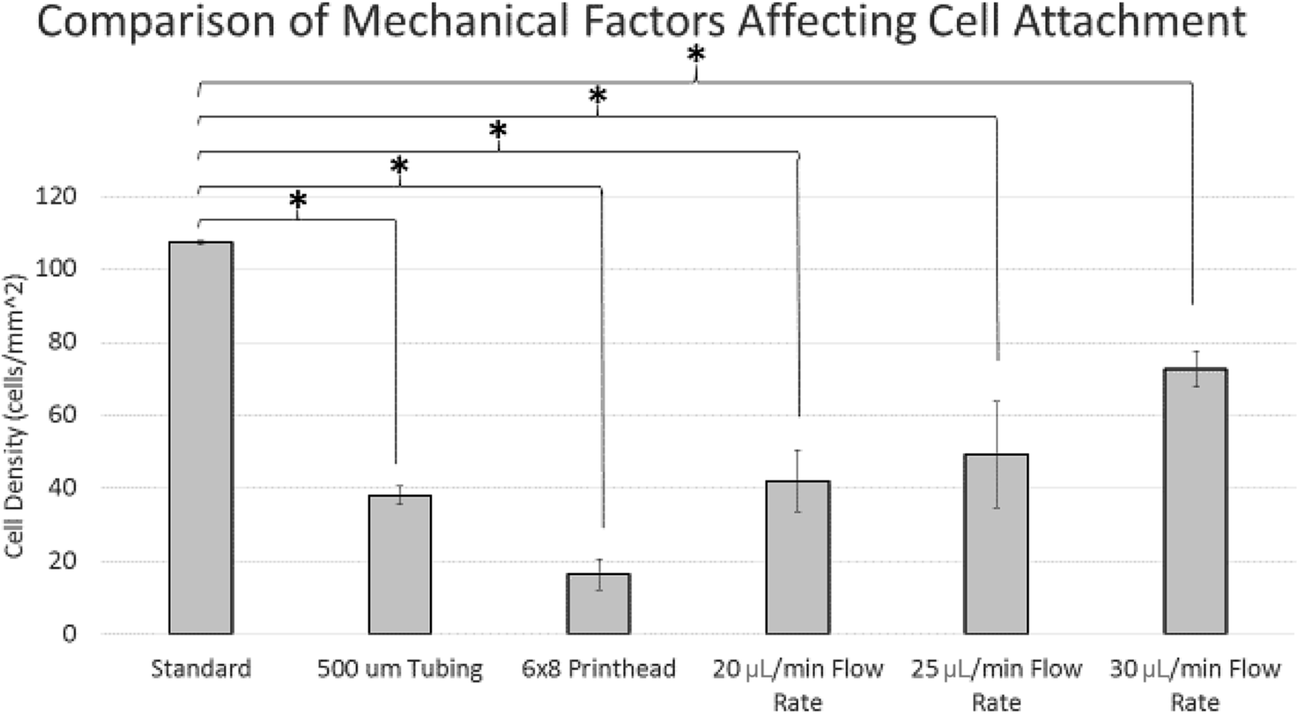 | ||
| Fig. 3 Comparison of cell density for printed fibroblasts varying mechanical factors (tubing diameter, print head dimensions, and flow rate) that affect cell attachment. An asterisk indicates statistical significance using a one-way ANOVA (p < 0.05). | ||
 | ||
| Fig. 4 10× magnification microscope images with 200 μm scale bars to compare the cell density and morphology of mechanical factors that affect cell attachment: (A) standard print, (B) 500 μm tubing, (C) 20 μL min−1, (D) 25 μL min−1, and (E) 30 μL min−1 flow rates. | ||
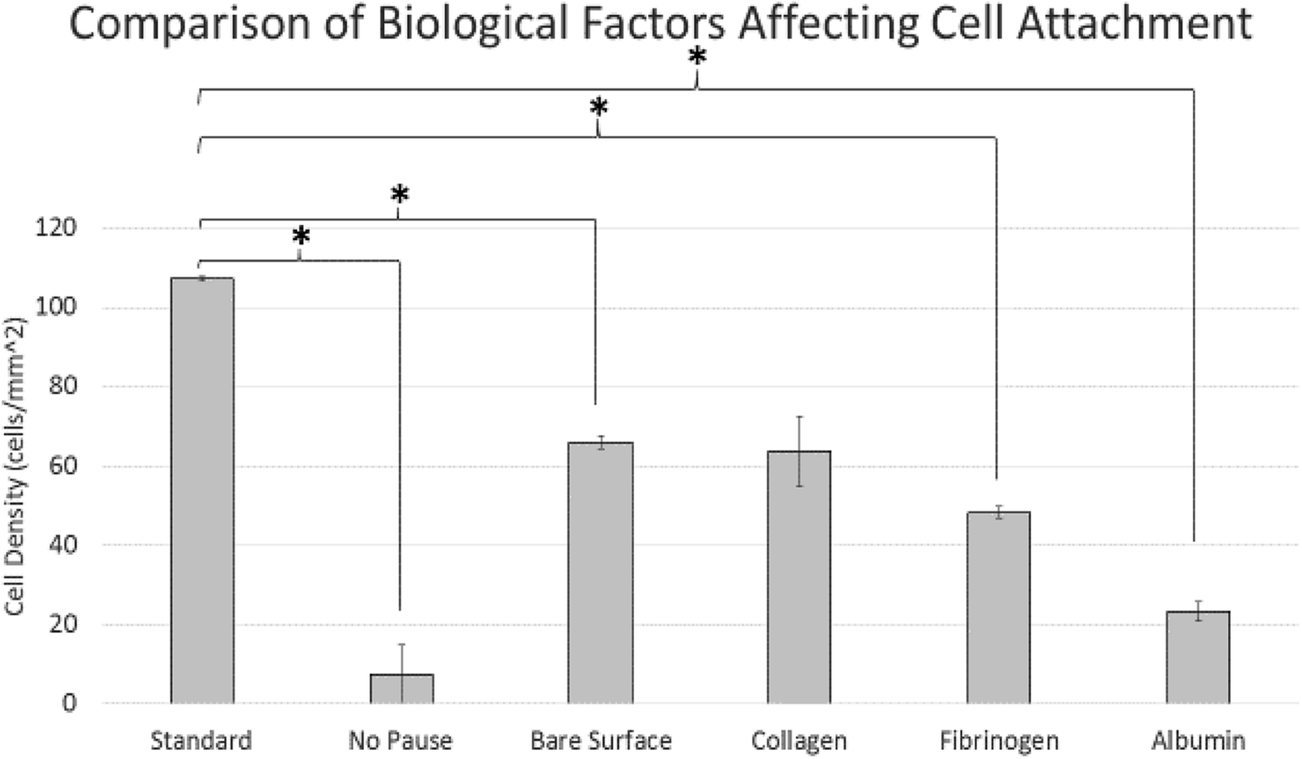 | ||
| Fig. 5 Comparison of cell density for printed fibroblasts varying biological factors (pause time and surface coating) that affect cell attachment. An asterisk indicates statistical significance using a one-way ANOVA (p < 0.05). | ||
Collagen was the only surface protein that generated cell densities not significantly different than the standard print (p = 0.0698). A non-coated surface or coating the surface with fibrinogen or albumin significantly decreased the cell density on the surface.
Experimental
Cell culture
The adherent fibroblast cell line ATCC CRL-1658 NIH/3T3 (3T3) was cultured in Dulbecco's Modified Eagle Medium (DMEM, Life Technologies) supplemented with 10% fetal bovine serum (FBS, Life Technologies), 1% penicillin–streptomycin (Life Technologies), 1% HEPES buffer (Life Technologies), and 1% sodium pyruvate (Life Technologies). 3T3 cells with a maximum passage number of 25 were cultured to 70–80% confluence before experimental use. The cells were cultured at 37 °C with 5% CO2.Microfluidic cell printing
3T3 cells were printed at 50![[thin space (1/6-em)]](https://www.rsc.org/images/entities/char_2009.gif) 000 cells per mL in complete DMEM (described above) using a modified version of the vertical Continuous Flow Microspotter (CFM, Wasatch Microfluidics)21 that allows for submerged printing.1 The printer was modified to minimize the amount of tubing the cells contact before reaching the surface. The CFM uses a 24 channel peristaltic pump (Ismatec, Switzerland) to pull the cells through the system, from a well plate, to the surface and then to waste (Fig. 2). Conditions were changed one at a time to isolate the factors that change shear stress, cellular adhesion, cellular density, and cellular viability. A 1 × 12 (12) channel print head, with flow cell surface area 5.8 mm2 and a 6 × 8 (48) channel print head, with flow cell surface area 0.43 mm2 were tested. Exchanging the Tygon® tubing diameter between 250 μm and 500 μm modified the shear stress. Printing cells on serum, albumin, collagen, and fibrinogen provided an evaluation of the effect of surface coating on cellular adhesion.
000 cells per mL in complete DMEM (described above) using a modified version of the vertical Continuous Flow Microspotter (CFM, Wasatch Microfluidics)21 that allows for submerged printing.1 The printer was modified to minimize the amount of tubing the cells contact before reaching the surface. The CFM uses a 24 channel peristaltic pump (Ismatec, Switzerland) to pull the cells through the system, from a well plate, to the surface and then to waste (Fig. 2). Conditions were changed one at a time to isolate the factors that change shear stress, cellular adhesion, cellular density, and cellular viability. A 1 × 12 (12) channel print head, with flow cell surface area 5.8 mm2 and a 6 × 8 (48) channel print head, with flow cell surface area 0.43 mm2 were tested. Exchanging the Tygon® tubing diameter between 250 μm and 500 μm modified the shear stress. Printing cells on serum, albumin, collagen, and fibrinogen provided an evaluation of the effect of surface coating on cellular adhesion.
Reynolds number
The Reynolds number, which is an indicator of the type of flow, laminar or turbulent, and the relative effects of inertia, was calculated for a rectangular flow according to the following equation:| Qρ/(W + H)μ | (1) |
Péclet number
The Péclet number, which is the ratio of advective over diffusional mass transport in a flow displacement system, was calculated according to the following equation:| 3vR3/2(H/2)2D | (2) |
Shear stress and average velocity
Shear stress was calculated using:| μ(6Q/H2W) | (3) |
Protein surface coating
Albumin, collagen, fibrinogen, and serum were all pipetted onto the surfaces of tissue culture treated polystyrene 12 well dishes. Each spot contained 100 μL of the protein solution. Serum was used undiluted. Albumin, collagen, and fibrinogen were all pipetted onto the surface at a concentration of 0.5 mg mL−1. Protein coated plates were allowed to dry in a biosafety hood overnight. Collagen coated dishes were rinsed before use to remove any residual acid. The collagen dishes were rinsed for 10 minutes with phosphate buffered saline followed by two rinses with distilled water. Protein coated dishes were stored at 4 °C for no more than one week before use.Cell imaging and analysis
Cells were imaged using a Leica DM IL LED microscope (Leica Microsystems) with Leica Application Suite imaging software (Leica Microsystems). Trypan blue was used at 0.1% concentration to stain the cells (Life Technologies). Images were taken at 10× magnification for cell density calculations and morphology assessment using a Leica DMIL LED Fluor (Leica, USA). ImageJ 64 software (NIH) was used to analyse the images using the cell counter plug-in (Fig. 6).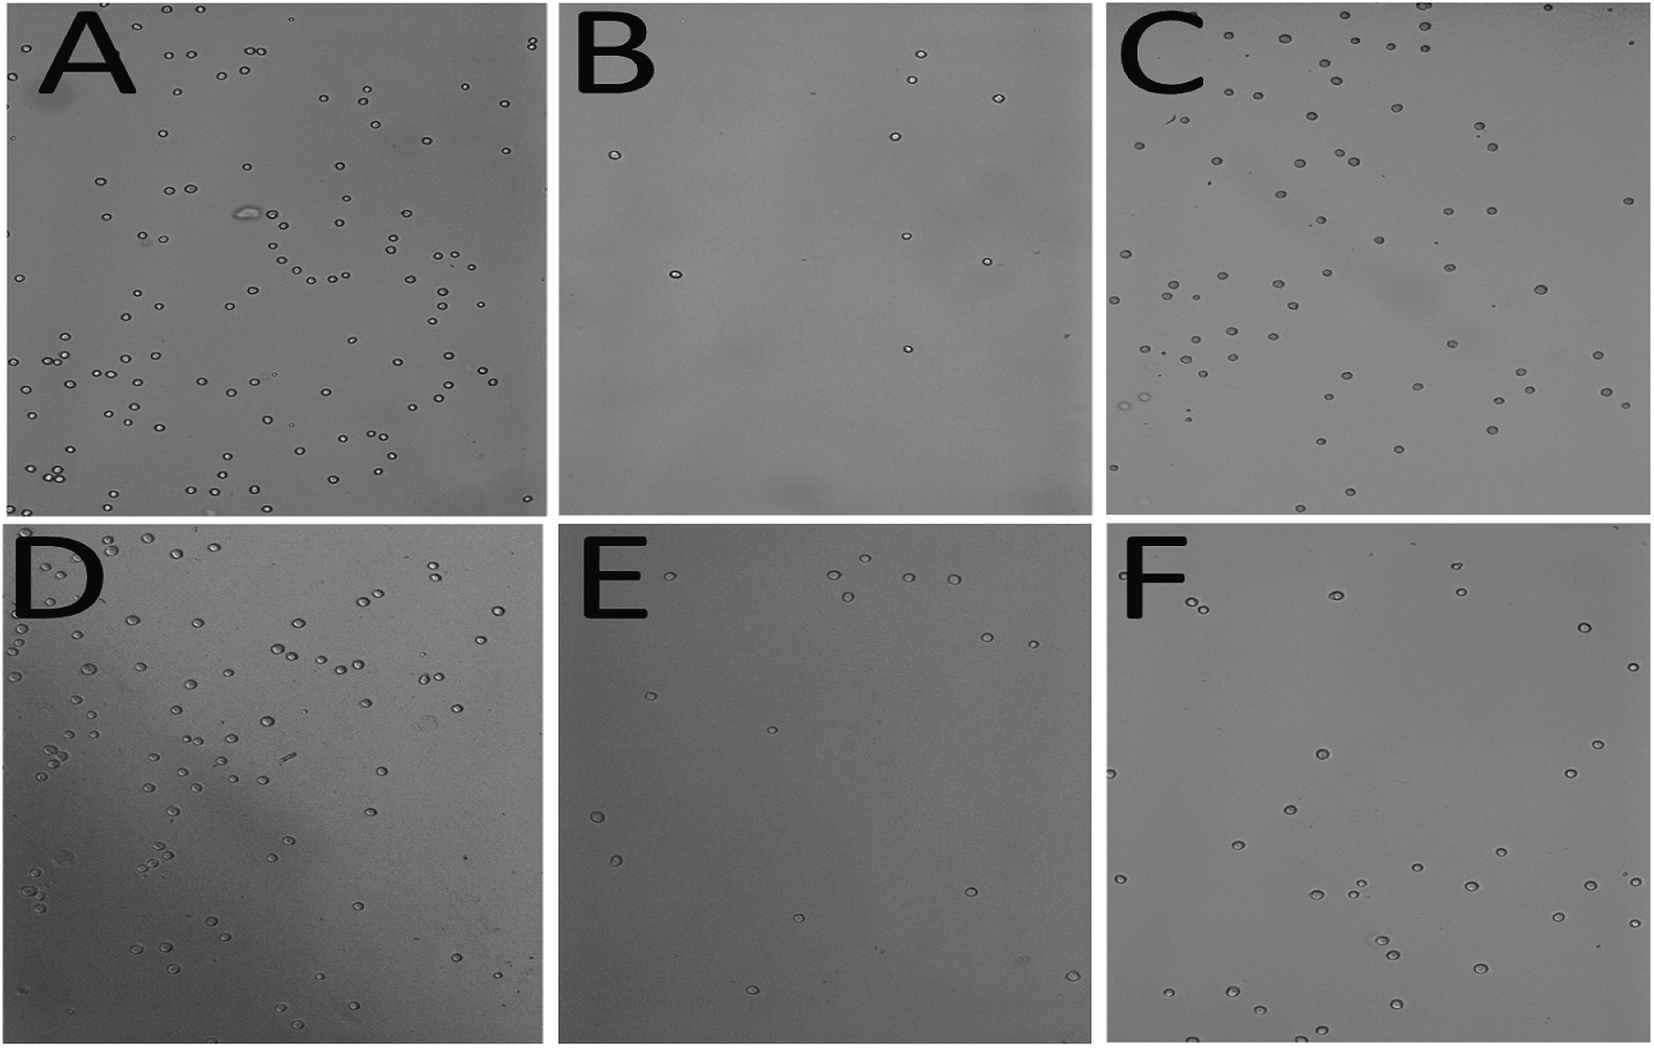 | ||
| Fig. 6 Microscope images (10× magnification) comparing the cell density and morphology of biological factors that affect cell attachment: (A) standard print, (B) pause time, (C) bare tissue culture surface, (D) collagen, (E) fibrinogen, and (F) albumin coated surfaces. | ||
Statistical analysis
A one-way ANOVA was performed using Microsoft Excel to compare each condition back to the standard print (12 channel print head with 250 μm tubing over a serum coated surface, flowing at 15 μL min−1 with a 5 minute pause time half way through the print and at the end of the print). Experiments were performed in triplicate.Conclusions
The foreign body response continues to plague the ever-increasing market of biomedical devices. Thus, efforts to mitigate the foreign body response have been primarily materials focused, using biocompatible coatings fabricated from man-made and natural-derived polymers, including collagen and albumin.2,14,24–27 Unfortunately, material improvements are often frustrated by incongruent responses between in vitro and in vivo assays. The biocompatibility of a material cannot be fully evaluated by a single test or method, and endpoint assays for determining the potential compatibility are time intensive and costly.28–31Although many events of FBR related fibroblast adhesion are known from previous surface micro-patterning, lateral 2-D printing, and parallel plate flow chamber techniques,1,4,23,32–35 the submerged microfluidic printing technology described herein provides a more accurate model of cellular material interactions that occur at the surface under shear flow conditions. The vertical, submerged microfluidic cell printing technology described here is ideal for creating a viable printing condition that allows cells direct access to the designated surface and can iteratively build complexity into the model; whereas, other technologies utilize lateral, two-dimensional print conditions and orient cell flow parallel to the designated surface, inadvertently increasing cell contact with the tubing and detracting from the desired surface interactions. Microfluidic lateral flow devices also impose shear stress more focused on the adhesive edges, potentially skewing the interpretation of the results. The orientation of the vertical flow channels with respect to the printing substrate allows additional cell-surface contact due to inlets and outlets that are oriented perpendicular to the print surface. The vertical, submerged CFM utilizes this design to allow additional cell-surface exposure from the vertical columns of liquid in the inlets and outlets on top of cells that make contact within the actual flow channel (Fig. 7). This allows a greater depth of cell diffusion through the medium and onto the designated substrate, providing a printing advantage that other devices do not have. The vertical design can also be used to create complex layered structures in future studies. While various applications of surface micro-patterning are limited by the real-time analysis of the printing process,33–35 the microfluidic printing technology described herein utilizes a microscope objective aligned with the print surface, allowing real-time analysis of the process. A parallel plate flow chamber is an often used and validated model for determining cell adhesion;32 however, cellular interactions constrained by two material surfaces may not be an appropriate model for many FBR cell adhesion measurements in which cells directly experience unrestrained differential flow based on their relative location to the device surface. The ability to interrogate cellular interactions under continuous flow over time represents a distinct advantage of the described vertical microfluidic printing device, which is able to create a reversible seal on a wet or dry surface.19 While there are other assays designed to assess cellular adhesion in relation to FBR, utilizing a microfluidics approach, in which the model surface could be patterned with multiple coatings, offers a tool for biomaterials testing that (1) increases throughput through isolated channels, (2) decreases reagent consumption and the associated costs, and (3) offers a more relevant platform for in vitro biomaterials testing when compared to other techniques (e.g., 2D printing, parallel plate flow chambers for bacteria, surface micro-patterning, etc.).1,4,5,32,36 Increased throughput leads not only to condition scouting experiments to determine cellular adhesion as an indication of the FBR, but also allows replicate assays to be performed at a reduced cost and monitored in real time on a feasible time scale. As opposed to various 2D microfluidic approaches, cells are provided direct access to protein-coated surfaces due to the surface perpendicular flow direction (Fig. 7).
 | ||
| Fig. 7 Cells are provided direct access to protein-coated surfaces due to the flow direction being perpendicular to the surface. | ||
Since microfluidic devices provide flowing conditions, factors that affect cell adhesion, such as shear stress, flow rate, and surface topography, can be explored.34 Notably, shear stress in the blood vessel ranges from 1 dyn cm−2 to 15 dyn cm−1;22,37,38 however the flow rate at the interface of a device is considerably less; thus, the shear stress rates utilized here were about 1/10 of the lowest physiological vascular shear rate to provide the greatest cell density (Table 1). Adhesive force represents the integration of shear stress from flow as well as the force of cellular adhesion to the surface. Several recent studies have emphasized the importance of the surface, particularly the protein composition of the surface, as a primary mediator of cellular adhesion, retention, proliferation, and differentiation.34,39–43 In fact, in certain systems using jet impingement to determine cellular adhesion strength, collagen, a major component of the extracellular matrix, provides the most adherent surface.1 This corresponds well with our observed results with a collagen-coated surface. The specific complement of cellular adhesion molecules cannot be underestimated in these assays. Cell–cell interactions during the printing process cannot be completely eliminated as contributing to the observed cellular density and certain substrate protein coatings led to more clumped cells (data not shown); however, single cell thickness prints were obtained through optimizing the cell confluency and seeding density. Future efforts to adapt and validate the jet impingement technique to the CFM system described will provide additional insight into cell–material interactions.
Because of the novelty and advantages of a submerged and vertical microfluidic print head, relevant flow and stress calculations have not previously been reported. Although many of the altered parameters had an effect on the calculated values for flow and other numerical values that describe cellular adhesion, altering the print head had the most interesting effect, likely due to the different channel dimensions (12 channel: width = 1 mm, length = 6 mm, height = 0.3 mm; 48 channel: width = 0.51 mm, length = 0.85 mm, height = 0.25 mm), which increased shear stress and velocity (Table 1). Using cell density, shear stress, and velocity, a standard print condition (12 channel print head with 250 μm tubing and a flow rate of 15 μL min−1) was defined in this study. Minimizing the shear stress and velocity under laminar flow, such as under the standard print condition, was hypothesized to increase the time that the cells were in contact with the surface. The 12 channel print head has a surface area of 5.843 mm2, providing maximum surface area for cell attachment to occur when compared to the 48 channel print head with flow cells having an area of 0.43 mm2. Increasing cell-surface contact time is mirrored in the use of the lowest flow rate, 15 μL min−1, increasing the number of cells on the surface. Trypsinization of the fibroblast cells creates a suspension medium for the microfluidic device, and is likely the reason for the rounding of the cells in the initial printing period. The initial adhesion of fibroblast cells from a suspension has been observed to be approximately 5 minutes, while full adhesion onto a surface is dependent on the culture environment, but is commonly observed to be over 30 minutes.44 This is believed to be the reason why printed fibroblast cells, when imaged, appear rounded, but still attach to the surface. Cell distention cannot be excluded as an additional factor to increase adhesion;1 however, based on the roundness of the imaged cells, this effect was thought to be negligible. This was likely due to more uniform shear stresses imposed on the cell during vertical printing.
Future work may better integrate immunohistochemistry for cell surface receptors in conjunction with jet impingement methods modified for vertical microfluidic systems to calculate the adhesive strength of the cells attributed to the presence of certain integrin receptors. Additionally, future work will include looking into other biologically relevant proteins, such as fibronectin, that have been shown to change the adhesion and cytoskeletal organization of fibroblasts.45 It will also be important to expand the cell printing system discussed in this paper to a co-culture system of macrophages and fibroblasts (as they are both key to the foreign body response46–48) and image prints over time. The microfluidics platform described may significantly impact our study of the FBR, particularly in relation to the “race for the surface”.48
Conflict of interest
Sherry Davidoff, David Au, and Benjamin Brooks are employees of Wasatch Microfluidics. Bruce Gale has a financial interest in Wasatch Microfluidics.Acknowledgements
The authors would like to thank the NIH funding support received from grant number 1R43CA177146-01A1. The authors would also like to acknowledge Dr David Grainger (Pharmaceutics and Pharmaceutical Chemistry, University of Utah) for the use of his lab space.Notes and references
- X. Zhang, P. Jones and S. J. Haswell, Chem. Eng. J., 2008, 135(Supplement 1), S82–S88 CrossRef CAS.
- J. M. Morais, F. Papadimitrakopoulos and D. J. Burgess, AAPS J., 2010, 12, 188–196 CrossRef CAS PubMed.
- J. M. Anderson, A. Rodriguez and D. T. Chang, Semin. Immunol., 2008, 20, 86–100 CrossRef CAS PubMed.
- C. Visser, M. Gielen, Z. Hao, S. le Gac, D. Lohse and C. Sun, Biophys. J., 2015, 108, 23–31 Search PubMed.
- H. Busscher and H. van der Mei, Clin. Microbiol. Rev., 2006, 19, 127–141 CrossRef PubMed.
- J. M. Anderson, in Biological Interactions on Materials Surfaces, ed. D. A. Puleo and R. Bizios, Springer, US, 2009, pp. 225–244 Search PubMed.
- B. D. Brooks, A. E. Brooks and D. W. Grainger, in Biomaterials Associated Infection, ed. T. F. Moriarty, S. A. J. Zaat and H. J. Busscher, Springer, New York, 2013, pp. 307–354 Search PubMed.
- D. T. Luttikhuizen, M. C. Harmsen and M. J. V. Luyn, Tissue Eng., 2006, 12, 1955–1970 CrossRef CAS.
- S. MacLauchlan, E. A. Skokos, N. Meznarich, D. H. Zhu, S. Raoof, J. M. Shipley, R. M. Senior, P. Bornstein and T. R. Kyriakides, J. Leukocyte Biol., 2009, 85, 617–626 CrossRef CAS PubMed.
- R. J. Schutte, A. Parisi-Amon and W. M. Reichert, J. Biomed. Mater. Res., 2009, 88, 128–139 CrossRef PubMed.
- S. M. van Putten, D. T. A. Ploeger, E. R. Popa and R. A. Bank, Acta Biomater., 2013, 9, 6502–6510 CrossRef CAS.
- D. Diekjiirgen, A. Astashkina, D. W. Grainger, D. Holt and A. E. Brooks, J. Biomater. Sci., Polym. Ed., 2012, 23, 1231–1254 CAS.
- J. R. Anderson, D. T. Chiu, R. J. Jackman, O. Cherniavskaya, J. C. McDonald, H. Wu, S. H. Whitesides and G. M. Whitesides, Anal. Chem., 2000, 72, 3158–3164 CrossRef CAS PubMed.
- B. Ratner, A. Hoffman, F. Schoen and J. Lemons, in Biomaterials science: an introduction to materials in medicine, Elsevier, San Diego, 2nd edn, 2004, pp. 67–127 Search PubMed.
- N. Wisniewski and M. Reichert, Colloids Surf., B, 2000, 18, 197–219 CrossRef CAS PubMed.
- V. P. Shastri, Curr. Pharm. Biotechnol., 2003, 4, 331–337 CAS.
- M. Shen and T. A. Horbett, J. Biomed. Mater. Res., 2001, 57, 336–345 CrossRef CAS PubMed.
- S. N. Davidoff, A. R. Miles, V. Romanov, B. K. Gale, J. W. Eckman and B. D. Brooks, J. Visualized Exp., 2014,(86), e51273, DOI:10.3791/51273.
- S. N. Davidoff, D. Au, S. Smith, A. E. Brooks and B. D. Brooks, Biomed. Sci. Instrum., 2015, 51, 24–30 Search PubMed.
- S. N. Davidoff, K. L. Stallings, A. E. Brooks, B. K. Gale and B. D. Brooks, Biomed. Sci. Instrum., 2015, 51, 17–23 Search PubMed.
- S. Natarajan, P. S. Katsamba, A. Miles, J. Eckman, G. A. Papalia, R. L. Rich, B. K. Gale and D. G. Myszka, Anal. Biochem., 2008, 373, 141–146 CrossRef CAS PubMed.
- P. M. Hinderliter, K. R. Minard, G. Orr, W. B. Chrisler, B. D. Thrall, J. G. Pounds and J. G. Teeguarden, Part. Fibre Toxicol., 2010, 7, 36 CrossRef CAS.
- J. Hu, C. Hardy, C.-M. Chen, S. Yang, A. S. Voloshin and Y. Liu, PLoS One, 2014, 9, e104502 Search PubMed.
- A. L. Nelson and J. M. Reichert, Nat. Biotechnol., 2009, 27, 331–337 CrossRef CAS PubMed.
- K. Fujioka, M. Maeda, T. Hojo and A. Sano, Adv. Drug Delivery Rev., 1998, 31, 247–266 CrossRef CAS.
- M. Geiger, R. H. Li and W. Friess, Adv. Drug Delivery Rev., 2003, 55, 1613–1629 CrossRef CAS PubMed.
- H.-Y. Cheung, K.-T. Lau, T.-P. Lu and D. Hui, Composites, Part B, 2007, 38, 291–300 CrossRef.
- A. Pizzoferrato, G. Ciapetti, S. Stea, E. Cenni, C. R. Arciola, D. Granchi and Lucia, Clin. Mater., 1994, 15, 173–190 CrossRef CAS.
- B. D. Ratner, A. S. Hoffman, F. J. Schoen and J. E. Lemons, in Biomaterials Science, Academic Press, 3rd edn, 2013, pp. 587–588 Search PubMed.
- C. J. Kirkpatrick, F. Bittinger, M. Wagner, H. Köhler, T. G. van Kooten, C. L. Klein and M. Otto, Proc. Inst. Mech. Eng., Part H, 1998, 212, 75–84 CrossRef CAS.
- C. J. Kirkpatrick, K. Peters, M. I. Hermanns, F. Bittinger, V. Krump-Konvalinkova, S. Fuchs and R. E. Unger, ITBM-RBM, 2005, 26, 192–199 CrossRef.
- W. O. Lane, A. E. Jantzen, T. A. Carlon, R. M. Jamiolkowski, J. E. Grenet, M. M. Ley, J. M. Haseltine, L. J. Galinat, F.-H. Lin, J. D. Allen, G. A. Truskey and H. E. Achneck, J. Visualized Exp., 2012,(59), e3349, DOI:10.3791/3349.
- Y. Ito, Biomaterials, 1999, 20, 2333–2342 CrossRef CAS.
- T. F. Didar and M. Tabrizian, Lab Chip, 2010, 10, 3043–3053 RSC.
- M. E. Moustafa, V. S. Gadepalli, A. A. Elmak, W. Lee, R. R. Rao and V. K. Yadavalli, J. Biol. Eng., 2014, 8, 24 CrossRef PubMed.
- S. Mittal, I. Y. Wong, W. M. Deen and M. Toner, Biophys. J., 2012, 102, 721–730 CrossRef CAS.
- P. Nigro, J. Abe and B. C. Berk, Antioxid. Redox Signaling, 2011, 15, 1405–1414 CrossRef CAS.
- J. M. Barnes, J. T. Nauseef and M. D. Henry, 2012.
- R. Gristina, E. D'Aloia, G. S. Senesi, A. Milella, M. Nardulli, E. Sardella, P. Favia and R. d'Agostino, J. Biomed. Mater. Res., Part B, 2009, 88, 139–149 CrossRef PubMed.
- J. Shaikh-Mohammed, M. Li, D. Terala and M. J. McShane, Integrated micro-/nanofabrication of cell culture scaffolds with selective cell adhesion and fluorescent indicators, 2004, vol. 5345, pp. 43–50 Search PubMed.
- K. W. Kwon, S. S. Choi, S. H. Lee, B. Kim, S. N. Lee, M. C. Park, P. Kim, S. Y. Hwang and K. Y. Suh, Lab Chip, 2007, 7, 1461–1468 RSC.
- E. W. K. Young, A. R. Wheeler and C. A. Simmons, Lab Chip, 2007, 7, 1759–1766 RSC.
- C. Yan, J. Sun and J. Ding, Biomaterials, 2011, 32, 3931–3938 CrossRef CAS PubMed.
- J. Albuschies and V. Vogel, Sci. Rep., 2013, 3, 2884, DOI:10.1038/srep02884.
- A. Woods, J. R. Couchman, S. Johansson and M. Höök, EMBO J., 1986, 5, 665–670 CAS.
- D. J. Holt, L. M. Chamberlain and D. W. Grainger, Biomaterials, 2010, 31, 9382–9394 CrossRef CAS PubMed.
- G. Voskerician and J. M. Anderson, in Wiley Encyclopedia of Biomedical Engineering, John Wiley & Sons, Inc., 2006 Search PubMed.
- A. Gristina, Science, 1987, 237, 1588–1595 CAS.
Footnotes |
| † These authors contributed equally to the work. |
| ‡ These authors are co-senior authors on the work. |
| This journal is © The Royal Society of Chemistry 2015 |