
Zinc titanium glycolate acetate hydrate and its transformation to zinc titanate microrods: synthesis, characterization and photocatalytic properties†
Guo-Hui Pan*ab,
Tomokatsu Hayakawab,
Masayuki Nogami*b,
Zhendong Haoa,
Xia Zhanga,
Xuesong Quc and
Jiahua Zhang*a
aState Key Laboratory of Luminescence and Applications, Changchun Institute of Optics, Fine Mechanics and Physics, Chinese Academy of Sciences, 3888 Dong Nanhu Road, Changchun 130033, China. E-mail: guohui.pan@aliyun.com; zhangjh@ciomp.ac.cn
bDepartment of Materials Science and Engineering, Nagoya Institute of Technology, Showa, Nagoya 466-8555, Japan. E-mail: mnogami@mtj.biglobe.ne.jp
cDepartment of Physics, Changchun Normal University, Changchun 130032, China
First published on 12th October 2015
Abstract
A heterobimetallic complex, zinc titanium glycolate acetate hydrate (Zn2Ti3–GAH), tentatively formulated as Zn2Ti3(OCH2CH2O)4(OCH2CH2OH)5(CH3COO)3·2HOCH2CH2OH·H2O, was synthesized by a room-temperature homogeneous precipitation in ethylene glycol solution. Its chemical composition, crystal structure, morphology, growth mechanism and thermal behaviors were characterized in detail. The precipitated Zn2Ti3–GAH was of a highly crystalline monoclinic phase and porous microrod morphology. As the single source precursor (SSP), Zn2Ti3–GAH was transformed into different phases of zinc titanate via thermal decomposition. With the remaining shape of the microrods, cubic phases of Zn2Ti3O8 and rutile TiO2 (r-TiO2) supported hexagonal phases of ZnTiO3 (h-ZnTiO3) were obtained by calcination at 500 and 700 °C, respectively; while r-TiO2 supported Zn2TiO4 were yielded in the form of dispersed particles or chains at higher temperature (950 °C). Benefiting from the SSP route and the confinement in the specific microrod domains of precursors, the heterostructures of r-TiO2–ZnTiO3 and r-TiO2–Zn2TiO4 were formed during programmable calcination. The studies on photocatalysis by degrading methylene blue (MB) under ultraviolet (UV) irradiation indicated that the as-transformed zinc titanate exhibited enhanced activity. In particular, r-TiO2 supported h-ZnTiO3 displayed the photodegradation reaction rate constant of 0.00163 s−1, which was comparable to that of commercially available Degussa P25 TiO2. This probably related to the more effective charge separation in the r-TiO2–ZnTiO3 heterostructure packed in the microrods.
1. Introduction
Over the past few decades, there has been a growing interest in novel heterometallic complexes due to their capability as molecular single source precursors (SSP) to advanced doped metal oxides and mixed-metal oxides via chemical routes (e.g. sol–gel techniques).1–9 Such conversions generally feature a processing of well-defined stoichiometric ratio of the metal elements on the molecular level and at relatively low temperatures. The resulting oxides usually inherit some structural features of synthetic precursors.10 Synthesis of new heterometallic complexes holding unique structures and properties is of great significance for the investigation of sol–gel processes as well as the evolution of metal alkoxide chemistry.10 Of particular interest is titanium based heterometallic complexes for their great potential in photocatalysts, photovoltaic cells, electroceramics and many others.7–9The coordination systems of heterometallic complexes are mainly stabilized by alkoxo-bridges, polyolates chelating ligands and oxo ligands between different metal atoms,4 which could be accordingly termed as heterometallic alkoxides, heterometallic polyolate-alkoxides and heterometallic polyoxometallate, respectively. Heterometallic alkoxides were investigated much earlier.1,2 Examples of titanium containing heterometallic alkoxides such as [M{Ti(OR)5}]n (M = Li, Na, K), [Mg{Ti2(OEt)8Cl}(μ-Cl)]2, Cd{Ti2(OiPr)9}I, [{Cd(OiPr)3}Ba{Ti2(OiPr)9}]2 and M2Ti2(OR)x(acac)y (M = Mg, CoII, Ni) were synthesized through reactions involving union of two different metal alkoxides or reactions of titanium alkoxides Ti(OR)4 (R = alkyl) and alkali metal alkoxotitanate ligands with metal halides or acetylacetonates (acac);1,2,11 Some novel types of heterobimetallic polyolate-alkoxides derived from various polyols (glycols, di- and tri-ethanolamines (teaH3) with common formulas of MxTi(OGO)y(OiPr)z(HOGOH)n (M = Ce, Ta, Al, K, Na, Zr; G = CH2CH2, CMe2CMe2, CHMeCH2CMe2, CMe2CH2CH2CMe2) and MxTiy(A)z(OR)n (M = Mg, Ca, Sr, Ba, Al, Ta, Nb; A = diethanolaminate (2-), triethanolaminate (3-); R = iPr, tBu), etc., were generally obtained by the interactions of residual hydroxyl groups in the pre-formed homometallic derivatives (titanium polyolates) with alkoxides of other metals.3,4,9 More recently, a variety of heterobimetallic polyoxotitanate cage compounds with a general formulae of [TixOy(OR)zMnLm] (M = La, Ce, Nd, Eu, Ga, CoII, Zn, FeII, Cu, Ni, MnII, Mov, Crv, etc.; L = Cl, Br, I, HOiPr, McOH (Methacrylic acid), etc.) were synthesized by a well-controlled solvothermal method via a reaction of Ti(OR)4 or the pre-formed homometallic titanium-oxo-alkoxy cage with metal chlorides, hydrated metal acetates and hydrated metal sulfates.5–8,12–19 Synthesis at room temperature, however, was less reported.19 Organically-soluble crystals are frequently obtained during the solvothermal heating–cooling cycle or during a posteriori partial evaporation of the mother liquor.7 In particular, in the absence of the above mentioned stabilizing ligands U. Schubert et al. recently synthesized the Zn–Ti–POBC bimetallic complex by means of a bifunctional linker of p-carboxybenzaldehyde oxime (POBC-H) upon reacting Ti(OiPr)4 with Zn(POBC)2.20
In this study, we reported on a heterobimetallic glycolate–acetate complex, zinc titanium glycolate acetate hydrate (Zn2Ti3–GAH) tentatively formulated as Zn2Ti3(OCH2CH2O)4(OCH2CH2OH)5(CH3COO)3·2HOCH2CH2OH·H2O, through a facile room-temperature precipitation reaction in ethylene glycol (EG) solution, which started from ambient-stable titanium glycolate derivatives and zinc glycolate acetate species. Similar EG mediated routes were previously described by H. Fu et al. to synthesize Zn–Ti, Ni–Ti and Co–Ti heterobimetallic glycolate precursors, though full understanding of their chemical compositions and structures was lacked.21–23 Herein these concerns were detailed on the basis of various analysis techniques. The as-precipitated Zn2Ti3–GAH appeared as highly crystalline monoclinic phase and porous microrods morphology. It thermally decomposed into different crystallographic phase of ZnO–TiO2 system from phase-pure Zn2Ti3O8 (cubic, defect-spinel type, porous microrods), then to rutile TiO2 supported ZnTiO3 (hexagonal, ilmenite-type, porous microrods) and finally to rutile TiO2 supported Zn2TiO4 (cubic, spinel-type, microcrystallites). Of particular interest is ZnTiO3 as promising dielectric materials for capacitors or microwave devices,24–31 gas sensors,32 paint pigments,27,33 and novel luminescent host.24,34–36 Zn2TiO4 was attractive as regenerable sorbents for catalytic desulphurization and dehydrogenation of hot gas.37,38 Zn2Ti3O8 was recently demonstrated as the anode material for rechargeable lithium-ion battery and photocatalyst for water splitting.22,39 The work presented herein evaluated their photocatalytic performance against degradation of methylene blue (MB) under UV irradiations. r-TiO2 supported h-ZnTiO3 displayed higher photocatalytic performance probably due to the presence of r-TiO2–ZnTiO3 heterostructure packed in microrods.
2. Experimental section
2.1 Chemicals
All chemicals were used as received without further purification. Titanium tetrabutoxide (TTB, Ti(OC4H9)4, 99.9 wt%), ethylene glycol (EG, HOCH2CH2OH, A.R.), zinc acetate dihydrate (Zn(CH3COO)2·2H2O, A.R.) and absolute ethanol were purchased from Kishida Chemical CO., LTD, Japan; N,N-dimethyl-formamide (DMF, A.R.) and dimethyl sulfoxide (DMSO, A.R.) were got from Xilong Chemical CO., LTD, China; methylene blue (MB) was bought from Aladdin Industrial Inc., China.2.2 Synthesis of Zn2Ti3–GAH
All manipulations were carried out under ambient conditions. In a typical synthesis, 0.5 mL of TTB was added into 100 mL EG under magnetic stirring, which immediately became cloudy and gave in situ a clear, colorless solution of titanium glycolate precursors upon continuous stirring overnight. The titanium glycolate precursors were used in the following reaction without further isolation. 0.3216 g of zinc acetate dihydrate (with a Ti/Zn molar ratio of ∼1![[thin space (1/6-em)]](https://www.rsc.org/images/entities/char_2009.gif) :1) was dissolved in 20 mL of EG with stirring and then poured into the above solution. The reaction was allowed to proceed with stirring at room temperature. The first visible sign of the turbidity appeared in the clear solution ∼1 h after the addition of zinc source and, then the solution gradually became more turbid. The whole homogeneous precipitation was completed in ∼3 h, yielding a concentrated suspension. Afterward, stirring continued for 2 h followed by aging for ∼12 h. White powders of Zn2Ti3–GAH (0.5733 g, ∼95% yield with respect to [Ti(OC4H9)4] supplied) were collected from the solution by centrifugation, washed with ethanol, and finally dried at 60 °C for 12 h in air. Zn2Ti3–GAH was subjected to calcinations in a muffle furnace under static air at different temperature for different periods of time. The heating rate was ∼8 °C min−1.
:1) was dissolved in 20 mL of EG with stirring and then poured into the above solution. The reaction was allowed to proceed with stirring at room temperature. The first visible sign of the turbidity appeared in the clear solution ∼1 h after the addition of zinc source and, then the solution gradually became more turbid. The whole homogeneous precipitation was completed in ∼3 h, yielding a concentrated suspension. Afterward, stirring continued for 2 h followed by aging for ∼12 h. White powders of Zn2Ti3–GAH (0.5733 g, ∼95% yield with respect to [Ti(OC4H9)4] supplied) were collected from the solution by centrifugation, washed with ethanol, and finally dried at 60 °C for 12 h in air. Zn2Ti3–GAH was subjected to calcinations in a muffle furnace under static air at different temperature for different periods of time. The heating rate was ∼8 °C min−1.
To study the effects of Zn/Ti molar ratios of the precursors on the reaction process and precipitated products, additional synthesis with Zn:Ti = 2:3 and 1:2 was performed under otherwise constant conditions.
To check the stability of Zn2Ti3–GAH against humidity, DMF and DMSO, 40 mg of the as-obtained sample was suspended in 15 mL of water, DMSO and DMF overnight, respectively; they were then collected for structure and morphology characterizations from the solution by centrifugation, washed with ethanol, and finally dried at 60 °C for 12 h in air. In the case of DMF, the soaking experiments were performed two times on the same powders.
Zn2Ti3–GAH was poorly soluble in water and common organic solvents.
FT-IR (KBr, 4000–400 cm−1): ν/cm−1 = 3425 br (νs(O–H) in EG and H2O), 2926 s (νas(CH2) C–CH2), 2856 s (νs(CH2) C–CH2), 1665m (δ(H–O–H)), 1570m (νas(COO−)), 1420m, (νs(COO−)), 1391w (δas(CH3)), 1340w (β(O–H)), 1200–1270w (νas(–C–C–O–)), 1116w (C–O–Ti), 1074 vs. (νs(C–O), δ(C–O–H)), 1034m (δ(C–O)), 914m (γ(CH2)), 885m (γ(CH2)), 624 s (νs(Ti–O)), 563 s (νs(Ti–O)), 478 s (νs(Ti–O)).
Solid-state 13C{1H} NMR (100.63 MHz, +25 °C, ppm): δ = 74.130, 63.910, 61.295. Solution 1H NMR (500.13 MHz, [D6] DMSO, +25 °C, ppm): δ = 1.059 (t, J = 5 Hz, CH3), 1.151 (s), 1.238(s, CH3), 1.250 (s, CH3), 2.016 (s, CCH3), 2.524 (t, J = 2 Hz, CH3), 3.256 (q, J = 5.5 Hz, OCH2), 3.315 (s, OCH2), 3.339 (s, OCH2 and H2O), 3.392 (t, J = 2.5 Hz, OCH2), 3.523 (q, J = 5.5 Hz, OCH2), 4.452 (p, J = 5.5 Hz, OCH2); solution 13C NMR (125.77 MHz, [D6] DMSO, +25 °C, ppm): δ = 39.900, 40.066, 40.232, 40.399, 40.476, 40.567, 63.249 (OCH2).
MS (m/z): calcd for 1273.22 (C34H81O36Ti3Zn, [M + H]+), found: 1273.00; calcd for 1159.05 (C28H64O29Ti3Zn2Na, [M + Na]+), found: 1158.93; calcd for 1137.06 (C28H65O29Ti3Zn2, [M + H]+), found: 1136.95; calcd for 1113.30 (C30H81O32Ti2Zn, [M + H]+), found: 1113.00; calcd for 943.12 (C24H56O26Ti2ZnNa, [M + Na]+), found: 942.85; calcd for 921.14 (C24H57O26Ti2Zn, [M + H]+), found: 920.85; calcd for 807.07 (C20H48O20TiZn2Na, [M + Na]+), found: 806.90; calcd for 785.09 (C20H49O20TiZn2, [M + H]+), found: 784.90; calcd for 727.16 (C20H48O20Ti2Na, [M + Na]+), found: 726.93; calcd for 705.18 (C20H49O20Ti2, [M + H]+), found: 704.93.
Elemental analysis (%): calcd for C28H64O29Ti3Zn2: Zn 11.48, Ti 12.61, C 29.52, H 5.66; found: Zn 12.34, Ti, 12.10, C 27.29, H 5.86.
TGA/DTA: theoretical weight loss 64.8%, actual 66.7%. Thermal events (°C): 180w (endo), 214s (exo), 291s (exo), 370w (exo).
2.3 Photocatalytic activity measurements
The photocatalytic performance was evaluated through the decomposition of MB (methylene blue, 50 mL, 10 mg L−1 in H2O) under ∼29.2 mW cm−2 ultraviolet (UV, 253.7 nm) irradiation of a Hg lamp at room temperature in the presence of photocatalyst (50 mg). After being stirred in a well-shaped reactor 7.0 cm in caliber in the dark for 2 h to achieve the absorption–desorption equilibrium, the mixture was exposed to the UV light under constant stirring. For a given duration of 2 or 10 min, the change in the concentration of MB (after the removal of photocatalysts through centrifugation) was checked by its absorption evolution at 664 nm recorded on a UV-visible spectrophotometer (Shimadzu UV-2600). As controls, commercially available photocatalyst of Degussa P25 TiO2 and MB aqueous solutions without any catalyst were also irradiated under otherwise the same conditions.2.4 Characterization
3. Results and discussion
3.1 Synthesis and characterization of Zn2Ti3–GAH
In the synthesis of titanium complexes, TiCl4 or titanium alkoxides, such as titanium tetrabutoxide (TTB) and titanium tetraisopropoxide (TTIP), were usually utilized as titanium source. However, owing to extreme moisture or water sensitivity, in most cases they underwent a fast and uncontrollable hydrolysis and oxolation process even at low temperature. Glycols could serve as a class of strong complexing reagents to greatly reduce the hydrolysis rates of a number of transition metal alkoxides/chlorides by forming glycolates or mixed alkoxide-glycolate derivatives.4,5,10,40–42 With excess EG, herein some reactions such as eqn (1) and (2) occurred to yield titanium glycolate derivatives (e.g. Ti(OCH2CH2O)(OCH2CH2OH)2 and Ti(OCH2CH2O)2(HOCH2CH2OH)), which maintained a equilibrium in the solution.5,10,42 The protons of chelated hydroxyl group of partially deprotonated EG ligands are more labile and reactive as a result of electron drift, and usually offer the functioning possibility towards alkoxides of other metals, yielding heterometallic glycolate alkoxides.3–5,43,44
 | (1) |
 | (2) |
Zn(CH3COO)2·2H2O or anhydrous Zn(CH3COO)2 were found to produce crystalline Zn–EG–AC complex nanowires when refluxed in EG, which definitely comprised both EG species and acetate ions upon IR analysis.45,46 Alcoholate groups were considered to be formed through the alcoholysis of acetate ions with alcohol due to its intrinsically weak basicity when dissolving some hydrated acetate salts in polyols medium.47 Such a polyols (EG, glycerol, etc.) mediated process was employed to synthesize many other crystalline homometallic polyolate complexes (e.g. Sn(II), Pb(II), Co(II), Mn(II)) powders by reacting a metallic salt in appropriate polyalcohols instead of monoalcohols under heating.47–49 Herein at room temperature and in EG Zn(CH3COO)2·2H2O was suggested to undergo pre-alcoholysis to de-coordinate acetic acid, producing zinc glycolate acetate species. They then interacted with titanium glycolate precursors to yield the Zn2Ti3–GAH, which precipitated from the reaction medium owing to low solubility.
Herein the Zn/Ti stoichiometric ratio (2:3) of Zn2Ti3–GAH is lower than that used in the starting materials (1:1), excess zinc acetate was left in the solution and discarded during the subsequent washing. Additionally, it was experimentally found that adopting the Zn/Ti molar ratio of 2:3 or 2:1 while keeping the constant concentration of titanium source displayed no effects on the chemical composition and crystal structure of the resulting Zn2Ti3–GAH. It means that controlled stoichiometric incorporation of Zn(II) and acetate ligand into the titanium glycolates is impossible. However, the morphology, precipitation process and production yield were affected. The appearance of milky colloids was delayed and the production yield was decreased at lower Zn/Ti ratio. With the stoichiometric ratio (2:3) of Zn/Ti, the first visible sign of the turbidity appeared in the clear solution ∼1.5 h after the addition of zinc source while the yield was decreased to ∼38% with respect to [Ti(OC4H9)4] supplied.
In the FT-IR spectrum of Zn2Ti3–GAH complex (see Fig. S1†) the strong and broad band associated with O–H stretching mode in the range of 3050–3500 cm−1 and the band at ∼1665 cm−1 associated with the H–O–H bending mode evidenced the hydrate for Zn2Ti3–GAH complex. In a medium wavenumber range, the indicative absorption bands centered at ∼1570 and 1420 cm−1 show that the acetate ligands (CH3COO−) were definitely involved in the Zn2Ti3–GAH complex. They were suggested to coordinate to the titanium atoms in a chelating coordination fashion given the relatively small difference between asymmetric and symmetric stretching vibrations (Δν = νa(COO−) − νs(COO−) = 150 cm−1).17,50 In a lower wavenumber range, absorption bands centered at 1074 cm−1 (C–O stretching and C–O–H bending) and 885 and 914 cm−1 (CH2 rocking vibration) were attributed to the modes of EG molecules and glycolate ligands. In the frequency range much lower than 700 cm−1, the sharp absorption bands are assigned to stretching and bending vibrations of Ti–O bonds.51
The as-precipitated Zn2Ti3–GAH was highly crystalline (see Fig. S2†). However, such a XRD pattern cannot be indexed in the Inorganic Crystal Structure Database (ICSD) or International Centre for Diffraction Data (ICDD). A preliminary searching for peaks followed by analysis using McMasille program reveals a primitive monoclinic system (figures of merit M (20) = 64.85). The unit cell parameters were primarily determined to be a = 7.4564 Å, b = 9.4574 Å, c = 7.5544 Å, α = 90°, β = 120.093°, γ = 90°, volume = 460.917 Å3, which is extremely close to a hexagonal unit cell. The best space group estimated by Checkgroup is P21/n. No crystals suitable for single crystal X-ray diffraction analysis could be grown for Zn2Ti3–GAH. Presently it is beyond our ability to predict precisely the connectivity of glycolate and acetate ligands, and then to refine the molecule and crystal structures of Zn2Ti3–GAH. However, previous studies on the homometallic glycolates (Ti(IV), In(III), etc.) nanowires prepared by refluxing glycols and metal alkoxides or metal salts suggested that these complexes shared a chain-like structure.41 Based on the similarities between our reaction and those reported in the literature, and the observation of a wire-like morphology, we believe that Zn2Ti3–GAH could also bear similar chains. A schematic representation of suggested structural arrangement of Zn2Ti3–GAH complex was shown in Scheme 1.
 | ||
| Scheme 1 Schematic representation of structural arrangement suggested for Zn2Ti3–GAH complex, where three titanium and two zinc atoms were alternately arranged in the chain and bridged by four totally deprotonated glycolate ligands (OCH2CH2O); each titanium atom was additionally chelated by one partially deprotonated glycolate ligand (OCH2CH2OH) and one acetate ligand (CH3COO−); each zinc atom was additionally chelated by one partially deprotonated glycolate ligand (OCH2CH2OH) and one neutral EG (HOCH2CH2OH) molecule; the neutral H2O appeared as lattice water rather than coordinating water at metal atom, and was omitted for clarity; as a consequence, Ti1 and Ti3 are five-fold coordinated, while Ti2 is six-fold coordinated; both zinc atoms are six-fold coordinated. | ||
SEM image of Zn2Ti3–GAH clearly shows that the crude particles (Fig. 1A) are mainly monodisperse microrods with the average diameter of ∼0.5–1.5 μm and length of ∼4.0–6.0 μm. Higher-magnification of TEM image on single microrod (Fig. 1B) depicts that it looks like micromesh with varying contrast (lower or higher) spanning the whole microrod. The presence of interior cavity implies that these microrods are of hierarchical structures assembled or stacked by smaller building blocks (∼10–20 nm in size). Nitrogen sorption experiments (Fig. S3A†) showed a broad distribution of pore size from micropore to large pore, with sharp peaks at ∼2.4 and 3.8 nm. The BET surface area was ∼21.28 m2 g−1. Contrary to power XRD analysis, high-resolution TEM (Fig. 1C) and SAED (see inset of Fig. 1B) on single microrod did not reveal the high crystallinity since no lattice fringes and diffraction rings or spots appeared under extensive observations. These are mostly likely due to the structural destruction by high-energy electron beam. The TEM-EDS analysis (Fig. S4†) revealed a Zn/Ti molar ratio near ∼2:3, which agree well with the elemental analysis. In contrast, regular microrods were also observed at Zn/Ti ratio lower than 2:1, but many more irregular particles along with microrods appeared when adopting the Zn/Ti ratio lower than 1:1.
 | ||
| Fig. 1 SEM, TEM and HRTEM images, FFT as well as SAED patterns of zinc titanium glycolate acetate hydrate (Zn2Ti3–GAH) (A–C) and the products of zinc titanate via thermal treatment at 500 °C for 3 h ((D–F), Zn2Ti3O8), 700 °C for 2 h ((G–L), r-TiO2 supported h-ZnTiO3) and 950 for 3 h ((M–R), r-TiO2 supported Zn2TiO4). The insets of (B) and (E) are the SAED patterns taken on the single microrod, respectively; (I and K) are the HRTEM images acquired on the squared areas of microrod in (H); (J and L) are the FFT patterns of (I and K), respectively; (O and Q) are the HRTEM images acquired on the squared areas of adjacent grains in (N); (P and R) are the SAED patterns performed on the adjacent grains in (N). The d spacing and corresponding crystallographic planes were indicated in the HRTEM images. | ||
FT-IR spectrum of Zn2Ti3–GAH definitely indicates the presence of glycolate and acetate ligands, however, the solid-state CPMAS 13C NMR spectrum of Zn2Ti3–GAH (see Fig. S5†) only displayed three resonance signals at δ ∼ 70 ppm for methylene [–OCH2–] group (two stronger signals at δ 74.130, 61.295 ppm and one weak 63.910 ppm), no resonances around δ ∼ 25 (CH3 region) and ∼180 ppm (COO region) related to acetate groups were detected mostly likely due to its low content.52 The signal at 74.130 ppm was assigned to chelated glycolate ligand, while the signal at 61.295 and 63.910 ppm were assigned to neutral glycols molecules.44 In solution only one resonance of 13C of free glycols was detected at ∼63.249 ppm (Fig. S6F†). Herein crystallization of EG solvent in the microstructure of Zn2Ti3–GAH and then the interactions of coordination and hydrogen bonding, were considered to shield the principle resonance to ∼61.295 ppm. In contrast, solution 1H and 13C NMR spectra (Fig. S6†) exhibit a number of peaks fallen in the region of methyl and methylene groups due to the dissociation of Zn2Ti3–GAH and/or further reactions in deuterated DMSO. Indeed, immersing Zn2Ti3–GAH in DMSO changed the crystallinity and morphology greatly (see Fig. S7B and S8C and D†). The materials became amorphous after soaking overnight; many separated small nanoparticles (∼50 nm) were released along with the remaining microrods. The DMSO solvent damaged the Zn2Ti3–GAH mostly likely starting from the extraction of neutral molecules (EG and H2O) in the microstructures.
Similar to many other crystalline homometallic glycolate powders,40,41,47–49 the solubility of Zn2Ti3–GAH was also poor in common organic solvents, however, molecule ion peak of which in MS (see Fig. 2B) was detected by using DMF at m/z 1136.95 (theoretical 1137.06), corresponding to [C28H65O29Ti3Zn2]+, and the experimental isotopic pattern (Fig. 2C) matches exactly with the simulated pattern (Fig. 2D). Considering the outstanding high stability of titanium glycolate toward moisture,10,42 the present as-synthesized complex was suggested to contain no oxo ligands inside. In addition, given the starting materials and solvent used, molecular ligands determined by FTIR, thermal evolution by TG-DTA discussed below as well as charge balance held in the molecular formula, Zn2Ti3–GAH was thus tentatively formulated as Zn2Ti3(OCH2CH2O)4(OCH2CH2OH)5(CH3COO)3·2HOCH2CH2OH·H2O. Additionally, MS also shows several molecule ion peaks of other species (see Fig. 2A and B and S9†). It was considered that a small amount of Zn2Ti3–GAH was destroyed and/or dissociated into many other complexes of lower nuclearities when dispersed in solvents for MS analysis. Similar to the case of DMSO, soaking Zn2Ti3–GAH in DMF overnight also changed the crystallinity and morphology but proceeded slowly. After one time soaking the diffraction peak intensity was dramatically reduced (Fig. S7C†), and then the materials became completely amorphous without any diffraction peaks after second immersion (Fig. S7D†); the surface of microrods became scraggly with a small amount of ∼50 nm nanoparticles (see Fig. S8E–H†). Additionally, after immersing Zn2Ti3–GAH in H2O overnight, as shown in Fig. S7E and S8I and J,† the materials also became amorphous; many microrods were retained but with cavities inside, some microrods were broken into smaller pieces. It is apparent that solvents destroyed the Zn2Ti3–GAH in different ways.
 | ||
| Fig. 2 (A and B) MS obtained after treating Zn2Ti3–GAH in DMF; (C and D) MS of Zn2Ti3–GAH; the experimentally obtained isotopic distribution pattern (C) for [M + H]+ correlates well with the calculated pattern (D). | ||
The thermal properties of Zn2Ti3–GAH were also examined by TG-DTA in air. As shown in Fig. 3, S10 and S11,† thermal behaviors could be mainly divided into four steps, namely, initial endothermic stage, subsequent two exothermic combustion steps, and a last exothermic process. Each process, especially the initial endothermic stage and subsequent combustions, resulted in a great mass loss. The total weight loss was ∼66.6% when heated to 1000 °C. The endothermic peak at ∼180 °C associated with a ∼39.0% mass loss was in agreement with the theoretical loss upon considering the departure of surface moisture, hydration water, lattice EG molecules and partially deprotonated glycolate groups (–OCH2CH2OH). EG is known to be a relatively stable organic compound with a boiling point of 197.6 °C.53 The intercalation of molecule EG therefore stabilizes the compound up to ∼180 °C. The first exotherm was associated with the combustion of totally deprotonated glycolate ligands [(OCH2CH2O)4], with a mass loss of ∼10.6% well comparable with the calculated value. The second sharp exotherm was attributed to the combustion of acetate ligand, with a weight loss (∼13.1%) slightly lower than the calculated value (∼15.5%) due to the progressive release. The last weaker exothermic process continued in a broad temperature range was related to the slow burnout of the organic residuals and crystallization behaviors of zinc titanate.
 | ||
| Fig. 3 TG-DTA curves of zinc titanium glycolate acetate hydrate (Zn2Ti3–GAH). | ||
TG-FTIR was used to examine the gas species evolved during heating of Zn2Ti3–GAH. Fig. 4 displays a two-dimensional (2D) wavenumber versus temperature FTIR spectrum. At temperature below ∼52 °C, no vibration absorption could be detected, then some apparent absorption bands related to hydroxyl (O–H, 3650 cm−1), methylene (CH2, 2945, 2886 cm−1), carbonyl (C![[double bond, length as m-dash]](https://www.rsc.org/images/entities/char_e001.gif) O, 1731 cm−1) and C–O groups (1051 cm−1) appeared, indicating the release of water, EG molecules and even some acetic species. In accordance with the endotherm in DTA, these bands became relatively stronger at ∼200 °C. The C–H and C–O modes were still detected during the first exotherm (∼210 °C) and but disappeared in the second one (∼305 °C). It means that glycolate species underwent insufficient combustion into H2O and CO2 during the first exotherm and were completely removed from the solid structure below ∼305 °C. The CO2 modes in the range of 2265–2400 cm−1 started to appear after ∼170 °C and nearly disappeared after the second combustion (∼400 °C). They were mainly associated with the oxidation process and accordingly displayed stronger absorptions during the combustion processes. The absorption band of carboxyl ligand retained up to 700 °C, also indicating the slow release of acetate species. These carbonyl containing species are most likely to be acetic acid, acetone, or acetic anhydride according to previous studies on Zn5(OH)8(CH3CO2)2·nH2O.52
O, 1731 cm−1) and C–O groups (1051 cm−1) appeared, indicating the release of water, EG molecules and even some acetic species. In accordance with the endotherm in DTA, these bands became relatively stronger at ∼200 °C. The C–H and C–O modes were still detected during the first exotherm (∼210 °C) and but disappeared in the second one (∼305 °C). It means that glycolate species underwent insufficient combustion into H2O and CO2 during the first exotherm and were completely removed from the solid structure below ∼305 °C. The CO2 modes in the range of 2265–2400 cm−1 started to appear after ∼170 °C and nearly disappeared after the second combustion (∼400 °C). They were mainly associated with the oxidation process and accordingly displayed stronger absorptions during the combustion processes. The absorption band of carboxyl ligand retained up to 700 °C, also indicating the slow release of acetate species. These carbonyl containing species are most likely to be acetic acid, acetone, or acetic anhydride according to previous studies on Zn5(OH)8(CH3CO2)2·nH2O.52
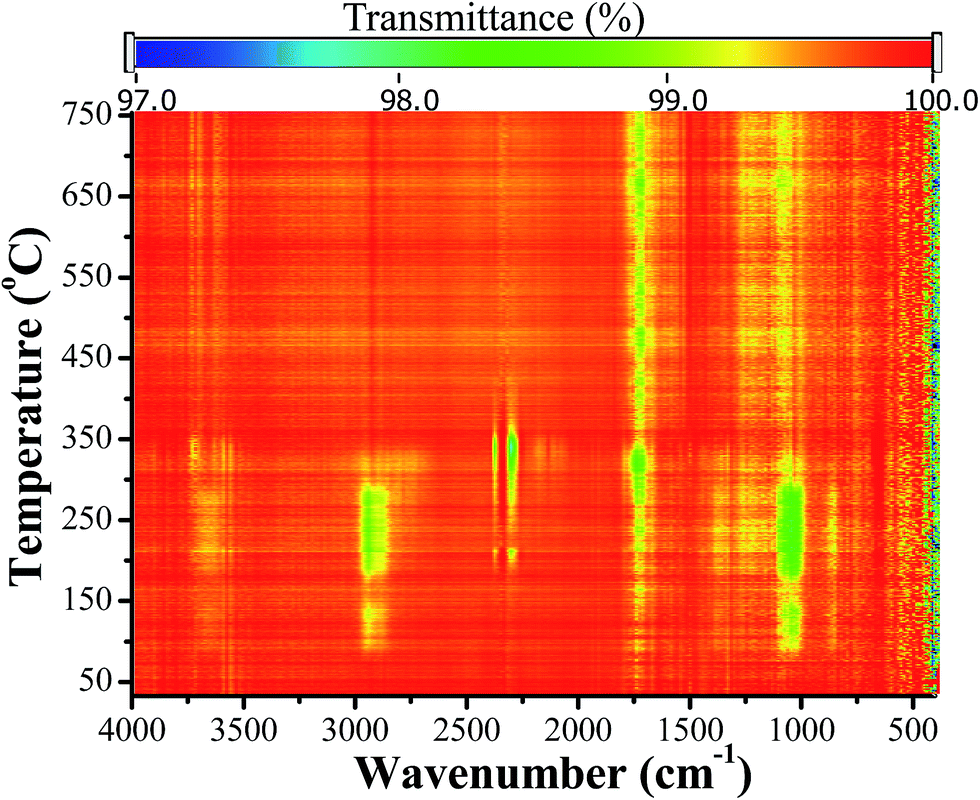 | ||
| Fig. 4 A two-dimensional (2D) wavenumber versus temperature FTIR spectrum of gas species evolved during heating of Zn2Ti3–GAH; the rainbow colors indicate transmittance of the FTIR spectrum acquired at different temperature. | ||
In a typical synthesis, milky colloids appeared ∼1 h after the addition of zinc acetate solution. The growth of microrods in solution was studied by sampling at different periods of reaction time. As shown in Fig. S12A,† initially these colloids were mainly gel-like particles in morphology, which became less as the reaction proceeded. Rod-like particles appeared even after ∼1.5 h and dominated the products rapidly. The nucleation and growth proceeded continuously; some microrods grew preferentially into a relatively large size in a short time. As shown in Fig. S12B,† the dimension of the some rods reached a diameter of 0.4 μm and a length of 2.0 μm in ∼0.5 h. This was almost a limit of size in the following ∼3 h (see Fig. S12C–G).† Moreover, during growth process many microrods were characterized by ill-shape, rough side and end faces. It was therefore believed that the growth of microrods followed an aggregation/packing process of the as-grown small particles. They collided and then coalesced and/or self-assembled into microrods for surface energy minimization according to the chemical bonding theory of single crystal growth.54 In the reaction system, both polar solvent of EG and Zn2Ti3–GAH feature rich hydroxyl groups, which allow a variety of intermolecular forces such as hydrogen bonding and dipole–dipole electrostatic interaction, to promote the self-assembly into more dynamic and complex structures.55 In the following experiments, aging allowed for growing into much larger size, more regular shape and smoother surface via Oswald ripening.
3.2 Thermal evolution
Fig. 5 exhibits the XRD patterns of the thermally treated products of Zn2Ti3–GAH. It was found that crystallization and phase transition were dependent on the reaction temperature and time. After calcination at 500 °C for 2 h, the powder was weakly crystalline to X-ray diffraction, but it definitely crystallized into one phase with several well-defined broad peaks upon prolonged heating to 3 h. One set of sharp peaks appeared and overlapped the broad peaks when calcined at 600 °C for 2 h. These sharp peaks could be exclusively indexed to the hexagonal ZnTiO3 (h-ZnTiO3, ICDD File no. 14-0033).24,25,56 Referring to the positions of these broad diffraction peaks, two possible assignments to c-ZnTiO3 (ICDD File no. 39-0190, 1:1 of Ti/Zn ratio) or to cubic Zn2Ti3O8 (ICDD File no. 87-1781, 3:2 of Ti/Zn ratio), are available due to the nearly same reflection positions.24,51,57 A complete transition to h-ZnTiO3 occurred upon increasing the calcinations temperature to 700 °C. However, single phase of h-ZnTiO3 was not accordingly yielded; a byproduct of rutile TiO2 (r-TiO2, ICDD File no. 21-1276) appeared. Titania is well known to exist in three naturally occurring polymorphic forms, namely crystalline phases of anatase (a-TiO2), rutile and brookite. r-TiO2 represents the thermodynamically stable form at higher temperature and a-TiO2 shows higher kinetic stability. The production of r-TiO2 upon continuous calcination of the amorphous precursors usually follows the first crystallization of a-TiO2 phase at low temperature (∼500 °C) and then a phase transition (∼650 °C).40 However, herein the a-TiO2 was not yet observed when conducting the calcination in 500–700 °C range. It is considered that the production of r-TiO2 was not from any separated amorphous complexes precursors co-precipitated with Zn2Ti3–GAH but from the direct decomposition of the crystalline material obtained by calcining Zn2Ti3–GAH complex at 500 °C for 3 h. Thereby, the above undetermined crystalline phase must possess a Ti/Zn stoichiometric ratio higher than 1:1; it is exclusively determined to be cubic phase of Zn2Ti3O8 rather than c-ZnTiO3. This is in accord with previous reports that the Zn2Ti3O8 directly decomposed into r-TiO2 and h-ZnTiO3 upon calcination.57,58 Note that the present Zn2Ti3O8 obtained was only thermodynamically stable at ∼500 °C, while it was reported earlier that Zn2Ti3O8 could be stable until ∼650, 800 and 820 °C without decomposition.51,57,58 Heating at higher temperature of 950 °C enabled the h-ZnTiO3 further decompose into the Zn2TiO4 (cubic system, ICDD File no. 25-1164) and r-TiO2. Such a structural transition was completed at the same calcination temperature but for 3 h. Overall, a schematic illustration of phase transformation of Zn2Ti3–GAH under calcination was shown in Scheme 2.
 | ||
| Fig. 5 XRD patterns of the zinc titanate obtained through calcinations of zinc titanium glycolate acetate hydrate (Zn2Ti3–GAH) at various temperatures for different times; each pattern was normalized to its maximum (♦ Zn2Ti3O8; ● h-ZnTiO3; ♠ Zn2TiO4; ♥ r-TiO2). | ||
 | ||
| Scheme 2 Schematic illustrations of phase transformation process of Zn2Ti3–GAH under calcination. | ||
As shown in Fig. 1, although the compositions as well as the structures of these zinc titanate are very different from the as-synthesized product, both of them held the shape of the Zn2Ti3–GAH until ∼700 °C. After calcination at 500 °C the diameter of microrods shrank to 0.5–1.0 μm, length to 2.0–3.0 μm (see Fig. 1D) due to the removal of organic moieties. TEM image of single microrod in Fig. 1E shows that the microrods are still porous but with a slightly larger pore size among the packed nanoparticles. The pore size distribution by BJH method upon nitrogen sorption analysis (Fig. S3B†) shows a sharp peak at ∼3.4 nm with a long tail in the regions of mesopore and large pore structures while the BET surface area increased to 34.28 m2 g−1 due to the removal of organic species. The SAED pattern (see the inset of Fig. 1E) on the microrod comprised some diffraction rings, indicating the polycrystallinity. These rings could be indexed to different crystal planes of single phase of cubic Zn2Ti3O8. High resolution TEM image (see Fig. 1F) exhibits some lattice fringes of the nanounits (∼5–10 nm) assembled in the microrods. The observed d-spacing of ∼0.25 nm is in good agreement with the lattice spacing of the (311) plane of cubic Zn2Ti3O8. At elevated temperature of 700 °C the resulting sample retained the rod shape, but the packed nanouints further grew into ∼100–400 nm in size and left much larger cavity in the microrods (see Fig. 1G and H). The pore size also shows a broad distribution from micropore to large pore with peaks at 1.7 and 30.1 nm upon N2 adsorption–desorption analysis (Fig. S3C†) while the BET surface area was dramatically decreased to 5.29 m2 g−1. In accordance with the XRD analysis that two phases of the h-ZnTiO3 and r-TiO2 were yielded under calcinations; herein it means that both phases occurred with each other in the microrod precursor, which could thus be termed as r-TiO2 supported h-ZnTiO3. Both h-ZnTiO3 (see Fig. 1I) and r-TiO2 nanoparticles (see Fig. 1K) were highly crystalline and imaged by high resolution TEM in single microrod where the interplanar spacing and corresponding crystal planes were indicated. Their FFT patterns (see Fig. 1J and L) characterized by regularly arranged spots indicate the single crystallinity. It is believed that a heterojunction of r-TiO2–h-ZnTiO3 formed in the particles-packed microrods. As shown in Fig. 1M and N, the Zn2TiO4 yielded upon thermal treatment at 950 °C did not retain the rod morphology, many bigger particles ∼0.4–1.0 μm in size were observed; some of them were grown into a chain. The porosity property accordingly disappeared. No typical isotherms with hysteresis loops were observed in nitrogen sorption experiment (Fig. S3D†). The BET surface area was only 0.02 m2 g−1. High resolution TEM on adjacent grains indicates the intergrowth of Zn2TiO4 (Fig. 1O) and r-TiO2 (Fig. 1Q) grains in one chain, forming a heterojunction structure (named as r-TiO2 supported Zn2TiO4). They are both of single crystallinity confirmed by SAED (Fig. 1P for Zn2TiO4; Fig. 1R for r-TiO2). The formation of r-TiO2 supported titanate obtained by post-treatment at elevated temperature was analogue to previous report on TiO2 supported Ce2Ti2O7.15
To date, a variety of routes have been developed to prepare zinc titanate (ZnxTiyOz) in the form of bulk solid ceramics, nano/microcrystalline powders, thin films, such as solid state reaction method,31,32,56 sol–gel processing,24–30 metallo-organic deposition (MOD) technique,38 radio frequency magnetron reactive sputtering.59 However, only a few studies have reported on the shape and size-controlled synthesis. Zinc titanate fibers were prepared by electrospinning.60 Zn2Ti3O8 nanowires were obtained via an ion-exchange reaction between the NaxH2−xTi3O7 nanotubes and a Zn2+ contained ammonia solution.58 Twinned Zn2TiO4 nanowires were synthesized using ZnO nanowires as a template or by an ordered assembly of nanobricks, respectively.61,62 One SSP route to zinc titanate films through sol–gel processing of Zn–Ti–POBC bimetallic complex was previously reported.20 The temperature-dependent structure evolution of ZnTiO3 by small angle X-ray scattering (SAXS) illustrated the advantage of SSP route to avoid the phase separation into regions with different compositions on the nanoscale level in the gel stage, compared to materials prepared from two individual precursors.20 In contrast, the SSP route presented herein benefits over the shape preservation of the precursors and in situ intergrowth of different phases (i.e. heterostructures) under suitable calcinations due to the confinement in the specific microrod domains.
3.3 Optical absorption and band gaps
The UV-visible Kubelka–Munk corrected diffuse reflectance spectra of Zn2Ti3–GAH, Zn2Ti3O8, r-TiO2 supported h-ZnTiO3 and r-TiO2 supported Zn2TiO4 are shown in Fig. 6 at their absorption edges. These are associated with the O → Ti and O → Zn charge transfer transitions, from which the band gap can be determined.15 In agreement with the single phase characteristic, Zn2Ti3–GAH and Zn2Ti3O8 both show a steep absorption edge while r-TiO2 supported h-ZnTiO3 and r-TiO2 supported Zn2TiO4 exhibit step-like edge due to the phase separation. The band gap was estimated directly by extrapolation of the absorption edge data to the energy axis (Fig. S13†). Zn2Ti3–GAH and Zn2Ti3O8 show the band gaps of 3.84 and 3.66 eV, respectively. The nature of electronic transitions were checked by fitting the absorption edges to the well-known “α = B(hν − Eg)n/hν” equation, where α is the linear absorption coefficient (F(R), the Kubelka–Munk function, for an infinitely thick material), B is a proportionality constant, hν (in eV) is the photon energy at each point of the scan and Eg (in eV) is the energy of band gap.7 An excellent fit was got for the exponent n = 2 and none at all for n = 0.5, which suggests that both Zn2Ti3–GAH and Zn2Ti3O8 feature allowed indirect band gap transition. Using the same extrapolation method, two band gap values of 3.08 and 3.75 eV were determined for r-TiO2 supported h-ZnTiO3, and 3.03 and 3.54 eV for r-TiO2 supported Zn2TiO4. The band gap of around 3.0 eV coincides with the value reported for rutile phase and thus,7 h-ZnTiO3 and Zn2TiO4 have the band gap of 3.75 and 3.54 eV, respectively, which are comparable to previous reports.59,63 Additionally, it can be clearly seen in Fig. 6 that the sample of r-TiO2 supported Zn2TiO4 has much stronger r-TiO2 related absorption than that in r-TiO2 supported h-ZnTiO3. Indeed, the former has a much higher content of r-TiO2 than the latter due to further thermal decomposition of h-ZnTiO3 at elevated temperature. | ||
| Fig. 6 Diffuse reflectance spectra of Zn2Ti3–GAH, Zn2Ti3O8 (via thermal treatment of Zn2Ti3–GAH at 500 °C for 3 h), r-TiO2 supported h-ZnTiO3 (via thermal treatment of Zn2Ti3–GAH at 700 °C for 2 h) and r-TiO2 supported Zn2TiO4 (via thermal treatment of Zn2Ti3–GAH at 950 °C for 3 h) at the absorption edges. F(R) is the Kubelka–Munk function. | ||
3.4 Photocatalytic properties
The photocatalytic activities of Zn2Ti3–GAH, Zn2Ti3O8, r-TiO2 supported h-ZnTiO3 and r-TiO2 supported Zn2TiO4 were evaluated at room temperature through the photodegradation of the dye MB aqueous solution under UV irradiation, as shown in Fig. 7. The Zn2Ti3–GAH showed no UV photoactivity with similar self-degradation to homogeneous MB. In contrast, all of the thermally treated products exhibited enhanced activity. The heterostructures contained samples had much higher activity. Particularly, r-TiO2 supported h-ZnTiO3 even bearing smaller specific surface area than the sample of Zn2Ti3O8 and lower content of r-TiO2 than r-TiO2 supported Zn2TiO4 was but more photoactive, and nearly degraded all of the given MB in 20 min, which was comparable to the commercially available Degussa P25 TiO2. Titania generally shows higher photocatalytic activity; however, herein the higher content of r-TiO2 in the sample of r-TiO2 supported Zn2TiO4 did not accordingly exhibit enhanced photocatalysis. This implies that h-ZnTiO3 is a more efficient UV catalyst than both Zn2Ti3O8 and Zn2TiO4, or most probably the occurring heterojunction of r-TiO2–h-ZnTiO3 benefits over the effective separation of photogenerated charge carriers of electron–hole pairs, which would migrate to the surface of materials and initiate the catalytic reaction with surface adsorbed materials. As shown in Fig. 7B, the fitting of the initial ln(C/C0) versus time data to the pseudo-first order rate law gave the apparent rate constant K in each photodegradation reaction. The value of r-TiO2 supported h-ZnTiO3 was ∼27.3% of commercially available Degussa P25 TiO2. | ||
Fig. 7 (A) Methylene blue (MB) photodegradation by C/C0 as a function of the reaction time under ∼29.2 mW cm−2 UV irradiation of a Hg lamp and (B) fitting plots of initial ln(C/C0) versus time data to the pseudo-first order reaction rate law (ln(C/C0) = −Kt), where K is the rate constant (s−1), C0 is the initial concentration of MB after the equilibrium absorption, and C is the concentration of MB at time t: ( ) MB solution without catalyst, ( ) MB solution without catalyst, ( ) using Degussa P25 TiO2 as the photocatalyst, ( ) using Degussa P25 TiO2 as the photocatalyst, ( ) using Zn2Ti3–GAH as the photocatalyst, ( ) using Zn2Ti3–GAH as the photocatalyst, ( ) using Zn2Ti3O8 as the photocatalyst, ( ) using Zn2Ti3O8 as the photocatalyst, ( ) using r-TiO2 supported h-ZnTiO3 as the photocatalyst and ( ) using r-TiO2 supported h-ZnTiO3 as the photocatalyst and ( ) using r-TiO2 supported Zn2TiO4 as the photocatalyst. ) using r-TiO2 supported Zn2TiO4 as the photocatalyst. | ||
4. Conclusions
In summary, we facilely synthesized one new heterobimetallic complex of zinc titanium glycolate acetate hydrate by room-temperature homogeneous precipitation via the reaction of titanium glycolate precursors with zinc glycolate acetate species in EG (HOCH2CH2OH) solution and tentatively denoted it as Zn2Ti3(OCH2CH2O)4(OCH2CH2OH)5(CH3COO)3·2HOCH2CH2OH·H2O on the basis of extensive characterizations on chemical composition, crystal structure, morphology, growth mechanism and thermal behaviors. The obtained Zn2Ti3–GAH was of highly crystalline monoclinic phase and porous microrod morphology. Thermal decomposition of SSP of Zn2Ti3–GAH produced different phases of zinc titanate with the rod-like morphology preserved up to ∼700 °C. Cubic phase of Zn2Ti3O8 was obtained by calcining at 500 °C, while rutile TiO2 (r-TiO2) supported hexagonal phase of ZnTiO3 (h-ZnTiO3) were produced at 700 °C. The r-TiO2 supported Zn2TiO4 were further yielded in the form of dispersed particles or chains at higher temperature (950 °C 3 h). Benefiting from the SSP route and the confinement of specific microrod domains of Zn2Ti3–GAH precursors, some heterostructures of r-TiO2–ZnTiO3 and r-TiO2–Zn2TiO4 were formed during the programmable calcination. The photocatalysis against degradation of MB indicated that the thermally treated products of zinc titanate possessed enhanced activity. Specially, r-TiO2 supported h-ZnTiO3 displayed the reaction rate constant of 0.00163 s−1, which was comparable with that of commercially available Degussa P25 TiO2. This probably related to the more effective charge separation in the r-TiO2–ZnTiO3 heterostructure assembled in the microrods.Acknowledgements
G.-H. P is grateful to the New Energy and Industrial Technology Development Organization (NEDO) of Japan for financial support. This work is also financially supported by the National Natural Science Foundation of China (Grant no. 51172226, 61275055, 51202019, 11274007, 11174278 and 51402284), Twelfth Five-Year Plan of The Education Department of Jilin Province for Science and Technology Study (Grant no. 2014-266) and the Natural Science Foundation of Jilin province (201205024, 20140101169JC and 20150520022JH). G.-H. P thanks Prof. Qing Wang and Dr Ming-Shu Chi in Northeast Dianli University for the measurement of TG-FTIR spectra. G.-H. P also acknowledges Prof. Zaicheng Sun and Dr Guoqiang Zhang in Changchun Institute of Optics, Fine Mechanics and Physics Chinese Academy of Sciences for the assistance of measurements of photocatalytic activities. G.-H. P is grateful to Dr Zijiang Jiang and Dr Yihan Zhou in Changchun Institute of Applied Chemistry Chinese Academy of Sciences for many stimulating scientific discussions on NMR and MS, respectively.References
- R. C. Mehrotra, A. Singh and S. Sogani, Chem. Rev., 1994, 94, 1643–1660 CrossRef CAS.
- R. C. Mehrotra and A. Singh, Polyhedron, 1998, 17, 689–694 CrossRef CAS.
- L. G. Hubert-Pfalzgraf, Coord. Chem. Rev., 1998, 178–180, 967–997 CrossRef CAS.
- A. Singh and R. C. Mehrotra, Coordin. Chem. Rev., 2004, 248, 101–118 CrossRef CAS PubMed.
- D. C. Bradley, R. C. Mehrotra, I. P. Rothwell and A. Singh, Alkoxo, and Aryloxo Derivatives of Metals, Elsevier, 2001 Search PubMed.
- L. Rozes and C. Sanchez, Chem. Soc. Rev., 2011, 40, 1006–1030 RSC.
- P. Coppens, Y. Chen and E. Trzop, Chem. Rev., 2014, 114, 9645–9661 CrossRef CAS PubMed.
- P. D. Matthews, T. C. King and D. S. Wright, Chem. Commun., 2014, 50, 12815–12823 RSC.
- Ł. John and P. Sobota, Acc. Chem. Res., 2014, 47, 470–481 CrossRef PubMed.
- D. Wang, R. Yu, N. Kumada and N. Kinomura, Chem. Mater., 1999, 11, 2008–2012 CrossRef CAS.
- G. A. Seisenbaeva, T. Mallah and V. G. Kessler, Dalton Trans., 2010, 39, 7774–7779 RSC.
- S. Eslava, M. McPartlin, R. I. Thomson, J. M. Rawson and D. S. Wright, Inorg. Chem., 2010, 49, 11532–11540 CrossRef CAS PubMed.
- S. Eslava, F. Hengesbach, M. McPartlin and D. S. Wright, Chem. Commun., 2010, 46, 4701–4703 RSC.
- S. Eslava, B. P. R. Goodwill, M. McPartlin and D. S. Wright, Inorg. Chem., 2011, 50, 5655–5662 CrossRef CAS PubMed.
- Y. Lv, M. Yao, J. P. Holgado, T. Roth, A. Steiner, L. Gan, R. M. Lambert and D. S. Wright, RSC Adv., 2013, 3, 13659–13662 RSC.
- Y.-H. Lai, T. C. King, D. S. Wright and E. Reisner, Chem.–Eur. J., 2013, 19, 12943–12947 CrossRef CAS PubMed.
- C. Artner, A. Koyun, M. Czakler and U. Schubert, Eur. J. Inorg. Chem., 2014, 5008–5014 CrossRef CAS PubMed.
- C. Artner, S. Kronister, M. Czakler and U. Schubert, Eur. J. Inorg. Chem., 2014, 5596–5602 CrossRef CAS PubMed.
- M. Hamid, A. A. Tahir, M. Mazhar, M. Zeller and A. D. Hunter, Inorg. Chem., 2007, 46, 4120–4127 CrossRef CAS PubMed.
- J. Yang, J. Akbarzadeh, C. Maurer, H. Peterlik and U. Schubert, J. Mater. Chem., 2012, 22, 24034–24041 RSC.
- Y. Qu, W. Zhou, Z. Ren, S. Du, X. Meng, G. Tian, K. Pan, G. Wang and H. Fu, J. Mater. Chem., 2012, 22, 16471–16476 RSC.
- Y. Qu, W. Zhou, Z. Ren, G. Wang, B. Jiang and H. Fu, ChemCatChem, 2014, 6, 2258–2262 CrossRef CAS PubMed.
- Y. Qu, W. Zhou and H. Fu, ChemCatChem, 2014, 6, 265–270 CrossRef CAS PubMed.
- J. Mrázek, L. Spanhel, G. Chadeyron and V. Matějec, J. Phys. Chem. C, 2010, 114, 2843–2852 Search PubMed.
- G. Starukh, S. Toscani, S. Boursicot and L. Spanhel, Z. Phys. Chem., 2007, 221, 349–360 CrossRef CAS.
- E. Hosono, S. Fujihara, M. Onuki and T. Kimura, J. Am. Ceram. Soc., 2004, 87, 1785–1788 CrossRef CAS PubMed.
- L. Wang, H. Kang, D. Xue and C. Liu, J. Cryst. Growth, 2009, 311, 611–614 CrossRef CAS PubMed.
- H. T. Kim, Y. Kim, M. Valant and D. Suvorov, J. Am. Ceram. Soc., 2001, 84, 1081–1086 CrossRef CAS PubMed.
- M. Zheng, R. Yu, J. Chen, J. Zhao, G. Liu, X. Xing and J. Meng, J. Am. Ceram. Soc., 2008, 91, 544–547 CrossRef CAS PubMed.
- Y. Chang, Y. Chang, I. Chen, G. Chen and Y. Chai, J. Cryst. Growth, 2002, 243, 319–326 CrossRef CAS.
- H. T. Kim, S. Nahm and J. D. Byun, J. Am. Ceram. Soc., 1999, 82, 3476–3480 CrossRef CAS PubMed.
- H. Obayashi, Y. Sakurai and T. Gejo, J. Solid State Chem., 1976, 17, 299–303 CrossRef CAS.
- V. B. Reddy, S. P. Goel and P. N. Mehrotar, Mater. Chem. Phys., 1984, 10, 365–373 CrossRef CAS.
- S. Wang, M. Lu, F. Gu, C. Song, D. Xu, D. Yuan, G. Zhou and Y. Qi, Inorg. Chem. Commun., 2003, 6, 185–188 CrossRef CAS.
- S. Wang, F. Gu, M. Lu, W. Zou, S. Liu, D. Xu, D. Yuan, G. Zhou and Y. Qi, J. Phys. Chem. Solids, 2004, 65, 1243–1245 CrossRef CAS PubMed.
- S. F. Wang, F. Gu, M. K. Lu, C. F. Song, D. Xu, D. R. Yuan and S. W. Liu, Chem. Phys. Lett., 2003, 373, 223–227 CrossRef CAS.
- M. Pineda, J. L. G. Fierro, J. M. Palaciosa, C. Cilleruelo, E. García and J. Ibarra, Appl. Surf. Sci., 1997, 119, 1–10 CrossRef CAS.
- Z. X. Chen, A. Derking, W. Koot and M. P. Dijk, J. Catal., 1996, 161, 730–741 CrossRef CAS.
- Z. Hong, M. Wei, Q. Deng, X. Ding, L. Jiang and K. Wei, Chem. Commun., 2010, 46, 740–742 RSC.
- O. Yamamoto, T. Sasamoto and M. Inagaki, J. Mater. Res., 1992, 7, 2488–2491 CrossRef CAS.
- X. Jiang, Y. Wang, T. Herricks and Y. Xia, J. Mater. Chem., 2004, 14, 695–703 RSC.
- X. Jiang, T. Herricks and Y. Xia, Adv. Mater., 2003, 15, 1205–1209 CrossRef CAS PubMed.
- R. C. Mehrotra, A. Singh, M. Bhagat and J. Godhwani, J. Sol-Gel Sci. Technol., 1998, 13, 45–49 CrossRef CAS.
- G. J. Gainsford, T. Kemmitt, C. Lensink and N. B. Milestone, Inorg. Chem., 1995, 34, 746–748 CrossRef CAS.
- J. W. Zhang, P. L. Zhu, Z. W. Li, J. M. Chen, Z. S. Wu and Z. J. Zhang, Nanotechnology, 2008, 19, 165605 CrossRef PubMed.
- C. Tian, W. Li, Q. Zhang, K. Pan and H. Fu, Mater. Res. Bull., 2011, 46, 1283–1289 CrossRef CAS PubMed.
- D. Larcher, G. Sudant, R. Patrice and J.-M. Tarascon, Chem. Mater., 2003, 15, 3543–3551 CrossRef CAS.
- E. W. Radoslovich, M. Raupach, P. G. Slade and R. M. Taylor, Aust. J. Chem., 1970, 23, 1963–1971 CrossRef CAS.
- A. M. Cao, J. S. Hu, H. P. Liang and L. J. Wan, Angew. Chem., Int. Ed., 2005, 44, 4391–4395 CrossRef CAS PubMed.
- A. Moezzi, M. B. Cortie, R. Shimmon and A. M. McDonagh, Eur. J. Inorg. Chem., 2013, 5133–5137 CrossRef CAS PubMed.
- O. Yamaguchi, M. Morimi, H. Kawabata and K. Shimizu, J. Am. Ceram. Soc., 1987, 70, C97–C98 Search PubMed.
- A. Moezzi, A. McDonagh, A. Dowd and M. Cortie, Inorg. Chem., 2013, 52, 95–102 CrossRef CAS PubMed.
- A. Kasai and S. Fujihara, Inorg. Chem., 2006, 45, 415–418 CrossRef CAS PubMed.
- C. Sun and D. Xue, CrystEngComm, 2014, 16, 2129–2135 RSC.
- G. Ma, Y. Zhou, X. Li, K. Sun, S. Liu, J. Hu and N. A. Kotov, ACS Nano, 2013, 7, 9010–9018 CrossRef CAS PubMed.
- F. H. Dulin and D. E. Rase, J. Am. Ceram. Soc., 1960, 43, 125–131 CrossRef CAS PubMed.
- J. Yang and J. H. Swisher, Mater. Charact., 1996, 37, 153–159 CrossRef CAS.
- Z. Hong, M. Wei, Q. Deng, X. Ding, L. Jiang and K. Wei, Chem. Commun., 2010, 46, 740–742 RSC.
- C. Ye, S. S. Pan, X. M. Teng, H. T. Fan and G. H. Li, Appl. Phys. A: Mater. Sci. Process., 2008, 90, 375–378 CrossRef CAS.
- Z. Cai, J. Li and Y. Wang, J. Alloys Compd., 2010, 489, 167–169 CrossRef CAS PubMed.
- Y. Yang, X. W. Sun, B. K. Tay, J. X. Wang, Z. L. Dong and H. M. Fan, Adv. Mater., 2007, 19, 1839–1844 CrossRef CAS PubMed.
- Y. Yang, R. Scholz, H. J. Fan, D. Hesse, U. Gösele and M. Zacharias, ACS Nano, 2009, 3, 555–562 CrossRef CAS PubMed.
- S. A. Mayén-Hernández, G. Torres-Delgado, R. Castanedo-Pérez, M. G. Villarreal, A. Cruz-Orea, J. G. M. Alvarez and O. Zelaya-Angel, J. Mater. Sci.: Mater. Electron., 2007, 18, 1127–1130 CrossRef.
Footnote |
| † Electronic supplementary information (ESI) available: FTIR spectrum, XRD pattern, N2 adsorption–desorption isotherm at 77 K, TEM-EDS spectrum, CPMAS 13C NMR spectrum and solution 1H and 13C NMR spectra of zinc titanium glycolate acetate hydrate (Zn2Ti3–GAH) or other samples; XRD patterns and SEM images of Zn2Ti3–GAH after immersing in DMSO, DMF and H2O overnight; MS comparisons of the experimentally obtained isotopic distribution pattern with the calculated pattern of molecule ion peaks of other species detected after treating Zn2Ti3–GAH with DMF; the TG curve of Zn2Ti3–GAH in temperature range of 25–300 °C for showing the point of inflection between step 1 and 2 during thermal evolution; SEM images of products by sampling at different periods of reaction time when synthesizing Zn2Ti3–GAH; determination of the band gaps of Zn2Ti3–GAH and zinc titanate via thermal treatment at varied temperature. See DOI: 10.1039/c5ra18292a |
| This journal is © The Royal Society of Chemistry 2015 |