Safflomin A inhibits neuraminidase activity and influenza virus replication

Miao Yua, Ye Wangb, Li Tianc, Yanyan Wanga, Xizhu Wanga, Weiguo Lianga, Jiyu Yanga, Dahai Yua, Tonghui Ma*d and Xuexun Fang*a
aKey Laboratory for Molecular Enzymology and Engineering of Ministry of Education, College of Life Sciences, Jilin University, 2699 Qianjin Street, Changchun 130012, China. E-mail: fangxx@jlu.edu.cn; Fax: +86-431-85155249; Tel: +86-431-85155249
bSchool of Life Science, Jilin University, 2699 Qianjin Street, Changchun 130012, China
cState Key Laboratory of Electroanalytical Chemistry, Changchun Institute of Applied Chemistry, Chinese Academy of Sciences, Changchun 130022, China
dCollege of Basic Medical Sciences, Dalian Medical University, Dalian 116044, China. E-mail: tonghuima@dlmedu.edu.cn; Fax: +86-0411-86110378; Tel: +86-0411-86110378

Received 27th August 2015 , Accepted 26th October 2015

First published on 26th October 2015


Abstract

Neuraminidase (NA) is a glycoprotein on the surface of the influenza virus that plays an important role in the early processes of virus infection and viral release from the infected cells. NA inhibitors are currently the most effective drugs to treat influenza virus infection. Many traditional Chinese medicines (TCMs) in various formulations have been used in Chinese clinics to treat influenza, however, the effective constituents and the mechanism of action are mostly unknown. In this paper, we have tested almost 300 natural compounds from a Chinese medicinal herbal compound library to evaluate their anti-NA activities in vitro. Safflomin A (SA) was one of the compound detected with NA inhibitory activities. It showed inhibition against neuraminidases from H1N1 and H3N2 of type A and neuraminidase of type B influenza viruses. Enzyme kinetic tests using SA revealed that the types of inhibition against N1 and N2 neuraminidases were noncompetitive. The interaction of SA with the N1 and N2 neuraminidases was analyzed using molecular simulation and docking, which showed that SA was bound in the non-active sites of N1 and N2. SA was also analyzed for its cytotoxicity and anti-viral activities in cell culture. It showed inhibitory effect for viral replication of H1N1 and H3N2 influenza viruses in MDCK cells. Enzymatic analysis indicated that a SA and oseltamivir carboxylate combination treatment was synergistic with combination index (CI) values ranging between 0.49 and 0.52 against neuraminidase of A/New Caledonia/20/1999 (H1N1), and ranging between 0.56 and 0.88 against neuraminidase of A/Fujian/411/2002 (H3N2). These results suggest that an herbal formulation containing SA in combination with oseltamivir carboxylate may serve as a potential therapeutic option to currently available anti-influenza therapeutics.

1 Introduction

Influenza viruses annually cause epidemics and complications, and even significant morbidity and fatality, especially in senior citizens who have underlying cardiopulmonary diseases.1,2 In 2009, worldwide H1N1 influenza epidemics infected millions and caused severe fatality. In February 2013, a novel avian influenza H7N9 virus emerged in China and was found to infect humans.3 There is evidence that influenza pandemics occurred four times in the 20th century and caused 20 to 50 million deaths worldwide.4 Influenza like symptoms typically include headache, sore throat, muscle ache, fatigue and fever. Most patients were critically ill and presented sever pneumonia, acute kidney failure, acute respiratory distress syndrome, diffuse intravascular coagulation and septic shock.4–6

Influenza virus is a highly infectious respiratory virus which could infect human and other animals and is classified into three genera (i.e. influenza A, B and C).7 There are two different types of viral integral glycoproteins, named hemagglutinin (HA) and neuraminidase (NA). The influenza A virus is called by the type of HA (H1-H16) and NA (N1-N9) it contains. The structure of the two proteins change easily through a process of antigenic drift that could result in influenza virus variations. According to the “150-cavity” adjacent to the active site, the NA of influenza A has been divided into two different classes, known as group-1 (comprising N1, N4, N5, N8) and group-2 (comprising N2, N3, N6, N7, N9).8 The NA plays an important role in influenza A virus replication and facilitates the early process of influenza virus infection in human airway epithelium, which can cleave terminal sialic acids of sialoglycans and promote the release of progeny virus from the infected host cell.7–10 Hence, as an ideal target for design of anti-influenza drugs, the NA presents on the surface of the influenza virus has attracted global attention.

Since vaccination is less effective or not available upon the influenza virus variants outbreak, the primary focus of attention has been on drugs. There are only two classes of anti-influenza drugs approved by U.S. FDA for the clinical treatment and prophylaxis: M2 ion channel blockers (amantadine and rimantadine) and neuraminidase inhibitors (oseltamivir, zanamivir and peramivir). According to the U.S. Centers for Disease Control and Prevention, 100% of seasonal H3N2 and 2009 pandemic flu have shown resistance to adamantanes and rimantadine, thus amantadine and rimantadine are no longer recommended for treatment of influenza.11 The neuraminidase inhibitors are currently the only clinically effective drugs to treat influenza. However, all of these synthetic drugs have the side effects and the widely used of these drugs resulted in the emergence of drug-resistant mutant viruses in recent years.12–14 Studies have shown that influenza virus isolated in human resistant to oseltamivir were frequent in Japan than in Europe.15 There were 20% isolates in Europe which was oseltamivir-resistant H1N1 mutants.16 Influenza viruses which has resistant have universal shape of the NA catalytic site. The active site of the NA content 8 functional residues (R118, D151, R152, R224, E276, R292, R371 and Y406) and surrounded by 11 framework residues (E119, R156, W178, S179, D198, I222, E227, H274, E277, N294 and E425).17 Both oseltamivir and zanamivir inhibited NA by competing with the substrate at the catalytic site. One single change of catalytic site of NA could reduce the inhibition of oseltamivir or zanamivir to the influenza virus. H274Y mutation of influenza virus (H1N1) was reported to be oseltamivir resistant.18 Vasiliy P. et al. found neuraminidase D151G mutation of influenza A (H3N2) was more resistant to the zanamivir and the IC50 was almost increased 1500-fold.19 In recent years, the novel avian H7N9 caused more than 227 deaths in the world. This novel H7N9 virus is a triple reassortant virus taking along genes from H7N3, H9N2 and H11N9 or H2N9 avian influenza A viruses.20 Zhou et al. found that the H7N9 virus can bind to both avian-type and human-type receptors.21 The isolated H7N9 with neuraminidase R292K mutation is broad resistance to neuraminidase inhibitors.20,22 Due to lack of the commercial drugs and emergence of oseltamivir-resistant virus, new drugs should be presented to oppose this new fatal influenza virus.

Favipiravir (T-705) is an antiviral drug that selectively inhibits the RNA-dependent RNA polymerase of influenza virus.21 Sleeman et al. found that favipiravir inhibits in vitro replication of a wide range of influenza viruses, including those resistant to currently available drugs.23 Other interesting drug targets, such as nucleoprotein, viral polymerase, and non-structural protein NS1A, have recently been well reviewed by Das and colleagues.24 In 2009, Dias et al. showed that a intrinsic RNA and DNA endonuclease is located in the PA subunit of virus polymerase. Inhibitors targeting of this endonuclease may also emerge as potential new anti-influenza drugs.25

Herbal remedies with the natural and active substances play a role as anti-influenza agents in controlling and treatment of influenza virus. A series of traditional Chinese medicinal (TCM) has been reported with antiviral effects, such as Melia toosendan could inhibit influenza virus through suppression of NA both in vitro and vivo.26 Forsythia suspensa extract against influenza A virus (H1N1) in vitro and in vivo using the cytopathic effect and neutral red dye uptake assays.27 Based on a large amount of studies, a variety of efficiently bioactive compounds isolated from TCMs have been identified to treat influenza.7 In the last few years, researchers had focused on the components of herbs to anti-influenza. Jin-Yuan Ho et al. extracted the ethanolic component from Paeonia lactiflora, which exhibited low IC50 values against influenza virus A/WSN/33 (H1N1) in vitro and vivo. It also has inhibitory activity against H1N1pdm strain which was isolated from clinical oseltamivir-resistant virus.28 The aqueous extracts of H. erectum, M. cochinchinensis and T. chebula reduced the titre of A/Teal/Tunka/7/2010 (H3N8) in vitro.29 Wang et al. used a system pharmacology approach to detect 50 compounds from two herbs aim to map to target-disease and drug-target-pathway networks in silico.30

Computer-based modeling methodology has been widely used to design new drugs. It enhanced efficiency of detection and reduced the cost of experiment. Molecular docking has been usually utilized to drug discovery especially against influenza virus.31 An et al. utilized computational molecular docking to identify potential inhibitors of the H5N1 NA in 20 compounds.32 Tambunan et al. found two ligands that have good IC50 values of the target interaction to H1N1 NA and toxicological properties using simulation results of molecular docking. These two ligands are predicted with no mutagencity or carcinogenicity and have good oral bioavailability.33 We have also taken advantage of homology modeling to simulate the structure of H1N1 NA, the model structure of N1 was used to screen compounds of NPD database34 for potential inhibitors. We found 34 of compounds with low affinity energy, among which, two natural compounds (ZINC02128091 and ZINC02098378) possessed the most favorable interaction energy.35

In this study, we tested 289 natural compounds by NA inhibition assay. Among these compounds, safflomin A (SA) showed NA inhibitory activity and was analyzed for its anti-viral effect by measuring cytopathic effect (CPE) of the influenza A virus. We also determined the type of inhibition of SA towards NA by enzyme kinetics. Moreover, the interaction of SA and influenza NA was analyzed by molecular docking. Finally, combination studies were undertaken to investigate whether SA could act synergistically with oseltamivir carboxylate against the NA of H1N1 and H3N2.

2 Materials and methods

2.1 Reagents

2-(N-Morpholino)ethanesulfonic acid (MES, >99%), dimethylsulfoxide (DMSO), 2′-(4-methylumbelliferyl)-α-D-N-acetylneuraminic acid, sodium salt hydrate (MU-NANA, CAS no. M8639) and 3-[4,5-dimethyl-thiazol-2-yl]-2,5-diphenyl tetrazolium bromide (MTT, >98%) were purchased from Sigma-Aldrich Corporation. Fetal bovine serum (FBS), Dulbecco's modified Eagle's medium (DMEM), TPCK-treated trypsin and trypsin–EDTA were purchased from the Gibco Company. Oseltamivir carboxylate was purchased from Dalian meilun biology technology co. Other chemical reagents were purchased from Beijing Chemical Works.

2.2 Compounds from traditional Chinese medicines (TCMs)

All compounds (analytical reagent, see Appendix) which are ingredients of TCMs were purchased from the Chinese Standard Chemical Networks (http://www.crmrm.com/). Each compound was dissolved in DMSO to the final concentration of 20 mM and stored in 96-well plates numbered α, β, γ, and δ at −80 °C.

2.3 Cells and virus

Madin–Darby canine kidney (MDCK) cells were obtained from Norman Bethune Health Science Center of Jilin University and grown in DMEM supplemented with 10% FBS, 100 μg mL−1 streptomycin, 100 U mL−1 penicillin. Influenza viruses (A/New Caledonia/20/1999 (H1N1), A/Fujian/411/2002 (H3N2), B/Jiangsu/10/2003) which were used as the source of NAs was obtained from Changchun Institute of Biological Products. Each type was propagated in 9 days old embryonated chicken eggs. The allantoic fluid was collected, then centrifuged at 3000 rpm min−1 for 5 min (ref. 36) and the supernatant was stored at −80 °C.

2.4 NA activity assay

NA activity was assayed with MU-NANA as a substrate.37 The supernatant of chicken egg embryonic allantoic fluid were first dissolved in pH 6.5 MES buffer (32.5 mM), which contains 4 mM calcium chloride. For NA activity inhibition assay, 49 μL of the supernatant was incubated with 1 μL DMSO dissolved TCM compound at different concentrations at 37 °C for 30 min in a black 96-well ELISA plate. Then 50 μL of 20 μM MU-NANA were added. TCM compounds with or without 20 μM MU-NANA were also detected the fluorescence intensity as control. Fluorescence intensity was measured using the FLX800 fluorescence microplate reader (Bio-Tek) with excitation wavelength at 360 nm and emission wave length at 450 nm. The detection lasted for 8 min. The fluorescence intensity changing rate of was determined as the NA activity. The level of inhibition was determined by the initial rates of the reaction with or without the compounds added. The median inhibitory concentration (IC50) was defined as the concentration of detected compounds to reduce the NA activity by 50% relative to the reaction mixture containing NA without compounds.

2.5 Median tissue culture infective dose (TCID50) determination

MDCK cells were cultivated in DMEM and re-plated 2 days before infection in 96 wells plates. Serial 10-fold dilutions of the allantonic fluid (H1N1 or H3N2) were prepared, then the diluted fluid was added in MDCK cells which contain 10[thin space (1/6-em)]000 cells per well to incubate for 2 h for virus to infect. The media for dilution was DMEM supplemented with 1 μg mL−1 TPCK-treated trypsin. Treated MDCK cells were washed 3 times by DMEM and cultured in DMEM with TPCK-treated trypsin (1 μg mL−1) for 24 h. 24 h later, MDCK cells were washed 3 times and cultured in DMEM with 2% FBS. After 3 days, MTT assay was used to determinate the virus-induced cytopathic effect (CPE), which indicated the presence of virus, TCID50 was calculated by the Reed–Muench method.

2.6 Cytotoxicity assay

MTT assay was also used to determinate the cytotoxic effects of natural compounds on MDCK cells. MDCK cells were grown in 96 wells plate in DMEM with 10% FBS and subsequently incubated with concentration gradient of compounds for 24 h at 37 °C. Cell viability was detected by 15 μL MTT (5 mg mL−1) in 100 μL DMEM for 4 h and measured the absorbance with spectrophotometer at 570 nm. The half-maximum cytotoxic concentration (CC50) was defined as the concentration which reduced the 50% OD570 of treated cells to untreated cells.

2.7 Viral growth inhibition assay

To detect the antiviral effect of the samples on influenza virus (H1N1 and H3N2), MDCK cells were grown in DMEM medium supplemented with 10% FBS and antibiotics. For the assay, MDCK cells were seeded into 96-well culture plates at a density of 3 × 10³ per well and incubated for 24 h until 75–85% confluency. Monolayer MDCK cells were washed with DMEM medium twice. There are two types of treatment: (1) we used 200 μL aliquot of virus which is at the optimal dose (100 TCID50) mixed with 200 μL concentration gradient of compounds for 2 h at 37 °C. The mixture was added into the wells to infect the MDCK cells. 2 h later, the virus-infected MDCK cells were washed with DMEM medium three times and cultured with DMEM medium with trypsin (1 μg mL−1) and after 24 h, DMEM which contained the 2% FBS was changed; (2) we used 200 μL aliquot of virus at the optimal dose for 2 h at 37 °C in medium without serum. The virus-infected MDCK cells were washed with DMEM medium three times and added different concentrations of compounds for 2 h.26 The cells in the absence of compound without or with virus added were used as control.

For both types of treatment, 2 h later, MDCK cells were also washed with DMEM medium three times and cultured with DMEM medium with trypsin (1 μg mL−1) and after 24 h, DMEM which contained the 2% FBS was changed. Following 3 days incubation, the monolayers were examined for CPE. For the CPE, the monolayers were washed to remove dead cells and debris, MTT assay was used to evaluate the antiviral effect of the anti-NA compounds on influenza virus. Concentration for 50% of maximal effect (EC50) was defined as the concentration of detected compounds to enhance the cell viability by 50% between the cell viability of cells infected influenza virus without compounds and the cell viability of cells with no infection.

After 3 days of incubation, the cells contained cell-associated virus and extracellular virus with DMEM culture solution were frozen and unfrozen 3 times to rupture the cells. Then the solution was centrifuged with 2000 rpm for 5 min.38 The supernatant was transferred, and the quantity of virus was represented by the NA activity. 50 μL of supernatant was added into black 96-well ELISA plate and 50 μL of 20 μM MU-NANA were also added, the rest of operation was carried out as described above. The solution in the absence of compound with virus was used as control.

2.8 The inhibition type of SA on the activity of NA

To determinate the type of inhibition of NA by SA, we performed enzyme kinetics with NAs from influenza virus (H1N1 and H3N2). In NA activity assay, we used 50 μL allantonic fluid which contain of NA of influenza virus (H1N1 or H3N2) as the control and added 100, 150 or 200 μM SA respectively, the mixtures were added into a black Elisa plate and incubated at 37 °C for 30 min. Then 50 μL MU-NANA substrate solution which concentration were 0.5, 1, 1.5, 2 nmol were added into the control or the experiment wells. The fluorescence intensity measured as mentioned in NA activity assay. Based on the reciprocal concentration (X) and the reciprocal fluorescence intensity (Y), the double-reciprocal plot was obtained.

2.9 Molecular docking simulation

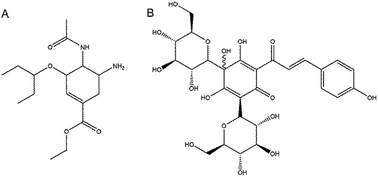
To study the interaction and the conformation of the protein–ligand complex, SA was docked into the N1, N2 NA protein using the AutoDock 4.0 program based on Lamarkian Genetic Algorithm (Scripps Research Institute, La Jolla, CA).39 Due to the lack formation of NA which we used, the crystal structure of N1, N2 which are highly homology (PDB ID: 3TI6_A and PDB ID: 4GZP_A) were obtained from the RCSB Protein Data Bank (http://www.rcsb.org/pdb). The structure of oseltamivir (Fig. 1A) was obtained from PubChem (CID: 65028). The structure of SA (Fig. 1B) was obtained from PubChem (CID: 6443665). The predicted complexes were optimized and ranked according to the empirical scoring function, ScreenScore, which estimated the binding free energy of the ligand receptor complex. Each docking was performed twice, and each operation screened 250 conformations for the protein–ligand complex that were advantageous for docking; each docking had 500 preferred conformations. The most stable conformation distinguished which had the minimal binding energy was shown by Discovery Studio (DS) 3.5 Visualizer.
image file: c5ra17336a-f1.tif
Fig. 1 Chemical structures of compounds. (A) Oseltamivir; (B) safflomin A (SA).

2.10 Drug synergism studies

To analyze the drug synergism on the effect of treatment of NA activities of N1 and N2 with SA and the oseltamivir, alone or in combination, isobologram analysis were used, according to the results by CalcuSyn Windows software (Biosoft, Cambridge, United Kingdom) for dose-effect analysis and synergism/antagonism quantification.40 The conservative isobologram assumes that two drugs have independent or dissimilar modes of actions.41 For two-drug combination design, the combination of the drugs at their equipotent ratio (the ratio of their IC50s) was chosen. A mixture of the two drugs was prepared and the mixture was serially diluted (2-fold dilutions, SA: oseltamivir carboxylate is equal to 1[thin space (1/6-em)]:[thin space (1/6-em)]1, 0.5[thin space (1/6-em)]:[thin space (1/6-em)]1 and 0.25[thin space (1/6-em)]:[thin space (1/6-em)]1 at the concentration of their IC50 values) to obtain a wide dosage range, as indicated in the CalcuSyn standard protocol. For single-drug treatment, serial dilutions were prepared from the serial dilutions of 0.1–0.5 times and 1–4 times of each compound's IC50 value, using the same protocol. 30 μL of dissolved NAs were added into a 96-black plate. After NAs were added, 10 μL of SA at the concentration mentioned above of was added and 10 μL of the oseltamivir carboxylate in the different proportional concentrations were added at 37 °C for 30 min, each concentration was repeated 3 times. Then 50 μL of 20 μM MU-NANA substrate solution was added. The fluorescence intensity was detected same as the NA activity assay.

Dose inhibition curves were drawn for SA and oseltamivir carboxylate, used alone or in combination. The IC50 values were plotted against the fractional concentrations of oseltamivir carboxylate and SA on the x axis and y axis, respectively. The evaluation of drug synergism based on a median-effect equation has been widely used. Using the median-effect equation, dose-effect curves for each drug and combination of drugs were generated and the combination index (CI) were calculated. To determinate the interactions between SA and oseltamivir carboxylate, CI was calculated. CI analysis provides qualitative information on the drug interaction. Its value calculated as described in eqn (A).

 
image file: c5ra17336a-t1.tif(A)

CA,x and CB,x represent the concentrations of drug SA and drug oseltamivir carboxylate used in combination to achieve x% single drug effect. ICx,A and ICx,B are the concentrations for single drug to achieve the same effect.

For two-drug combinations, in the isobologram plot, if the combination data point falls on the diagonal, an additive effect is indicated; if it falls on the lower left, synergism is indicated, whereas if it falls on the upper right, antagonism is indicated. A CI of >1 denotes antagonism, a CI equal to 1 denotes additivity, and a CI of <1 denotes synergism. In particular, CI values in the range of 0.1 to 0.3, 0.3 to 0.7, and 0.7 to 0.85 are considered to indicate strong synergism, synergism, and moderate synergism, respectively.

2.11 Statistical analysis

The results were expressed as mean ± S.E.M. for three independent experiments.

3 Results

3.1 SA inhibit the NA activities of influenza virus

NA is the most effective drug target for influenza virus. There are numbers of herbal medicines used to treat influenza viral infection in traditional Chinese medicinal clinics, however, the compounds that could inhibit NA activity in these herbs have not been systematically tested. We used a natural compound library of 289 compounds which derived from TCMs to screen their NA inhibitory activities. First, NA of HIN1 virus was used in the NA activity assay and each compound was tested once. A representative result was shown in Fig. 2. An inhibition of the NA activity was detected when the fluorescent intensity of the product in the presence of the compound was lower than the control reaction. Then, we used selected compounds (as marked in Fig. 2) which showed inhibitory activity toward the NA of H1N1 to detect IC50 values of NAs for H1N1 and H3N2 of type A and type B influenza virus. The IC50 values were shown in Table 1. In order to eliminate the false positive caused by the natural compound, the fluorescence intensity of selected compounds with or without 20 μM MU-NANA were also detected. No influence on the fluorescence intensity in the presence of these compounds with or without substrate was observed. One compound, SA, showed inhibitory activities toward these NAs. The IC50 values were 143.80 ± 9.13, 155.33 ± 17.37, and 104.72 ± 8.91 μM toward NAs for H1N1 and H3N2 of type A and type B influenza virus, respectively.
image file: c5ra17336a-f2.tif
Fig. 2 Screening of NA (H1N1) inhibitors using compounds in plate δ. 49 μL NA derived from H1N1 were mixed with 1 μL compound at 37 °C for 30 min. 50 μL 20 μM MU-NANA substrate solution was added to detect fluorescence intensity. Imaginary line represented the fluorescence intensity of N1 without compounds. Compounds marked position were detected one which has effective to inhibit N1.
Table 1 Selected compound's IC50 for H1N1, H3N2 and B in Plate δ
Well no. in Plate δ IC50 value towards NA of influenza virus H1N1 (μM) IC50 value towards NA of influenza virus H3N2 (μM) IC50 value towards NA of type B influenza virus (μM)
A8 ≥200 ≥200
B3 164.53 ± 4.05 ≥200 136.51 ± 16.20
C3 143.80 ± 9.13 155.33 ± 17.37 104.72 ± 8.91
C8 ≥200 ≥200
C11 ≥200 ≥200
E9 ≥200 ≥200 ≥200


3.2 Inhibition of influenza A virus growth in MDCK cells by the SA

Since SA showed anti-NA activities, we then tested whether it could protect cells from viral infection. We first examined the effect of SA on the cell viability. MDCK cells were used in the assay with concentration gradient of SA (from 100 to 500 μM). Half-maximum cytotoxic concentration (CC50) of SA after 24 h exposure of MDCK cells to it were shown in Fig. 3 and the CC50 is 414.12 ± 12.58 μM. This result showed that SA had minimal cytotoxicity in low concentrations.
image file: c5ra17336a-f3.tif
Fig. 3 MTT assay was performed to evaluate the cytotoxic effects of SA on MDCK cells. MDCK cells were grown with 0, 100, 200, 300, 400 and 500 μM SA for 24 h at 37 °C. Then added 150 μL of MTT in DMEM, incubating for 4 h and measuring the absorbance at 570 nm. Each point represents the mean ± S.E.M. for three independent experiments.

In the presence of the virus, the MDCK cells viability was reduced. To determine the median tissue culture infective dose (TCID50) of H1N1 or H3N2, MDCK cells were cultivated in DMEM and a serial 10-fold dilutions of the allantonic fluid (containing H1N1 or H3N2) were added for virus to infect. Three days after infection, MTT assay was used to determinate the virus-induced cytopathic effect (CPE), and TCID50 was calculated by the Reed–Muench method. The TCID50 values were 10−4.2 (H1N1) and 10−7.5 (H3N2), respectively.

To determine the anti-viral activity of SA, the MDCK cells were infected 100 TCID50 of virus. Compared with control which has no influenza virus infection, the cell viability was greatly reduced when the MDCK cells were infected with 100 TCID50 of virus, which indicated the H1N1 virus caused severe damage to the MDCK cells (Fig. 4a). To determinate whether the SA protected the MDCK cells from the infection of H1N1 influenza virus, we used two types of treatments. As mentioned in the methods section, SA was added to the MDCK cells upon or post viral infection. The results demonstrated that under both conditions, SA protected MDCK cells from viral damage, the protecting effects increased with the increase of the compound concentration (Fig. 4a). The EC50 of SA measured is 82.36 ± 11.74 μM for the viral infected MDCK cells (Table 2). Thus in agreement with that SA inhibited NA activities, the compound could reduce cell damage caused by influenza virus infection.


image file: c5ra17336a-f4.tif
Fig. 4 SA protected MDCK cells from viral infection. To detect the antiviral effect of SA on H1N1 (a) and H3N2 (b), we used two treatment methods as described in materials and methods: Method 1, influenza virus (H1N1 or H3N2) at 100 TCID50 were mixed with concentration gradient of SA for 2 h before applied to the MDCK cells. Method 2, influenza virus at 100 TCID50 were added into MDCK cells, 2 h later, cells were washed and SA was added. MDCK cells were infected with influenza virus (H1N1 or H3N2) and 0, 50, 100, 150, 200 μM of SA were used in the treatment. Each point represents the mean ± S.E.M. for three independent experiments.
Table 2 The calculation of saffomin A to treat influenza virus
IC50(μM) CC50 (μM) EC50 (μM)
H1N1 H3N2 B H1N1 H3N2
143.80 ± 9.13 155.33 ± 8.91 104.72 ± 8.91 414.12 ± 12.58 82.36 ± 11.74 160.33 ± 2.06


We also used H3N2 virus to infect the MDCK cells in the same way as the H1N1 virus (Fig. 4b). The results were similar to H1N1 virus infected MDCK cells. The EC50 of SA measured is 160.33 ± 2.06 μM for the viral infected MDCK cells (Table 2).

The results of cell viability indicated that SA could protect the MDCK cells from viral damage. Nonetheless, it did not show whether SA suppress the viral replication in MDCK cells. As viral numbers could be represented by the NA activities they carry, we measured the NA activity which reflect the multiplication of virus.42 The NA activities in MDCK cells infected the H1N1 and H3N2 without SA was regarded as 100%. When SA were added with an increased concentration, the cellular NA activities were reduced in both treatment methods against H1N1 or H3N2. Which represented the inhibition of the viral reproduction (Fig. 5). The results also showed that SA reduced the virus yield in MDCK cells in a dose-dependent manner and it were consistent with the results of CPE assay.


image file: c5ra17336a-f5.tif
Fig. 5 Inhibitory effects of SA on influenza virus yield in MDCK cells. MDCK cells were cultured with virus at different concentrations of SA as described in materials and methods. Cell culture supernatants collected and detected for H1N1 virus yield (a) and H3N2 yield (b) by measured NA activity. Virus yield expressed as percent NA activity of culture supernatants of SA-free with virus infected cells. Each point represents the mean ± S.E.M. for three independent experiments.

3.3 The inhibition type of SA on the activity of NA

The inhibition kinetics of NA by SA were studied. Under the experimental conditions employed, the reaction of NA with SA followed Michaelis–Menten kinetics. The double-reciprocal plots of the enzyme inhibited by SA were shown in Fig. 6a (H1N1) and Fig. 6b (H3N2). The results showed that the plots of 1/v versus 1/[S] gave straight lines with different slopes, and the lines intersected at one point on the X-axis. These results suggested that the types of inhibition by SA were noncompetitive. It indicated that SA interacts with NA in a site other than the catalytic center, and this interaction may change the conformation of the NA active site and in turn reduce the activity of NA.
image file: c5ra17336a-f6.tif
Fig. 6 To determinate which type of SA inhibit to the NA of N1 (a) and N2 (b), we used two types of NA with 100[thin space (1/6-em)]150 and 200 μM SA and added substrate solution (final concentration is 0.5, 1, 1.5, 2 nmol). Based on the reciprocal concentration (X) and the reciprocal fluorescence intensity (Y), the double-reciprocal plot was obtained.

3.4 SA bind to non-catalytic site of NA by molecular docking

To study the possible interaction sites of SA and the NAs, we used molecular simulation analysis. The crystal structure of N1, N2 were obtained from the RCSB Protein Data Bank and SA was docked into the N1 or N2 NA protein using the AutoDock 4.0 program based on Lamarkian Genetic Algorithm as described in materials and methods. Our docking results showed that SA bound in the non-catalytic site of N1 and N2, which is different from the control drug, oseltamivir carboxylate. Oseltamivir docked to the center of the active site of N1 and N2. Meanwhile, SA bound at the backside of N1 or N2 (Fig. 7). Fig. 8 showed the details of the compound–NAs complexes. Notably, the locations where SA bound to N1 and N2 were different. The residues His409-Leu412 of N1 formed an alpha helix structure, which was the absent in N2 (Fig. 8). Such structural differences created a deep groove on N2 surface for SA to bind (Fig. 7 black circle).
image file: c5ra17336a-f7.tif
Fig. 7 Schematic drawing of interrelation between inhibitors and NAs by protein contact potential of vacuum electrostations. Blue represents positive charge, red represents negative charge. Inhibitors are oseltamivir (left) and SA (right), showed by stick. Carbon skeleton of inhibitors were painted grey. Oseltamivir located in the center of the active site of NAs, SA bound at the backside of NAs.

image file: c5ra17336a-f8.tif
Fig. 8 Schematic drawing of interrelation between SA and NAs. NAs were showed by ribbon and SA showed by stick. Right figures were the details of square frame in the left figures. That is hydrogen bonds and pi–pi interaction formed between SA and NAs. Hydrogen bonds are shown by green dash line. Pi–pi interactions are shown by orange solid line.

To identify the binding forces contributed to the compound–NAs complexes, the estimated free energy of binding, which including the van der Waals energy, electrostatic energy, H-bond energy, dissolving energy, final total internal energy, torsional free energy, and unbound system's energy, were calculated. The values of the estimated free energy of binding for SA with NAs shown in Table 3 were consistent with the experimental values: the inhibition constant of SA to N1 (143.80 ± 9.13 μM) were lower than to N2 (155.33 ± 8.91 μM), and the calculated free energy of binding for SA with NAs were −6.19 kcal mol−1 for N1 and −5.66 kcal mol−1 for N2.

Table 3 The estimated free energy of binding, IC50 of SA with NAs
NAs Energy (kcal mol−1) IC50 (μM)
N1 −6.19 143.80 ± 9.13
N2 −5.66 155.33 ± 8.91


Hydrogen bonds formed between compound and protein were usually contributed to the stability of the substrate–enzyme complexes, and more hydrogen bonds form a more stable complex. In the present study, the compound–NAs complexes models were visualized by DS4.0 molecular graphics system. Our results shown that SA formed eight hydrogen bonds with both N1 (Fig. 9A) and N2 (Fig. 9B), respectively. From analyzing the hydrogen bonds interaction, some critical NAs residues were identified (Tables 4 and 5). The residues of Ser125, Phe174, Ile188, Asn189, Trp190 and Asn209 of N1 were considered to be important in the interaction. Meanwhile, the presence of five residues, Phe100, Pro126, Cys129, Glu162 and Leu163, were previously identified as conserved residues in SA-N2 interaction.


image file: c5ra17336a-f9.tif
Fig. 9 The binding patterns between inhibitors and NAs. (A) N1, (B) N2. Hydrogen-bond interactions with amino acid main chains are represented by a green dashed arrow directed towards the electron donor. Hydrogen-bond interactions with amino acid side-chains are represented by a blue dashed arrow directed towards the electron donor. Pi interactions are represented by an orange solid line with symbols indicating the interaction. Residues involved in hydrogen-bond, charge or polar interactions are represented by pink circles. Residues involved in van der Waals interactions are represented by green circles. The solvent accessible surface of an interacting residue is represented by a blue halo around the residue. The diameter of the circle is proportional to the solvent accessible surface.
Table 4 Hydrogen bond interaction parameters for SA and N1 residues
Donors atom Receptors atom Distances (Å)
Asn189: HD21 SA: O12 2.12
Asn189: HD21 SA: O15 2.26
Trp190: HN SA: O15 1.70
Asn209: HD22 SA: O13 2.04
SA: H66 Asn209: OD1 2.08
SA: H67 Ile188: O 2.22
SA: H63 Ser125: OG 1.91
SA: H75 Phe174: O 2.14


Table 5 Hydrogen bond interaction parameters for SA and N2 residues
Donors atom Receptors atom Distances (Å)
Cys129: HN SA: O11 1.91
Cys129: HN SA: O3 2.42
Leu163: HN SA: O4 2.17
SA: H56 Cys129: O 2.13
SA: H60 Glu162: OE1 1.75
SA: H63 Phe100: O 1.90
SA: H62 Phe100: O 1.97
SA: H75 Pro126: O 2.13


SA bound to N1 not only by hydrogen bond interaction, but also by a strong conjugation effect (Fig. 9). Normal conjugated effect, also known as pi–pi interaction, was due to the formation of conjugated Pi bond caused by the effect of the molecular nature of the charge. By analyzing the pi–pi interaction results (Table 6), Arg173 of N1 was identified to be important amino acids in the pi–pi interaction.

Table 6 Pi–pi interaction parameters for each SA and N1 residues
End1 End2 Distances (Å)
SA N1: Arg173 5.08
SA N1: Arg173 6.78


By analyzing the estimated free energy of binding, hydrogen bonds interaction and pi–pi interaction, we consider that SA has a strong binding effect with N1 than N2.

3.5 SA and oseltamivir act synergistically against N1 and N2

Oseltamivir carboxylate is widely used in the clinics for the treatment of influenza. It is well know as a potent competitive inhibitor for NA. Since SA inhibit noncompetitively of NA, it is of great interest to know if these two drugs can act synergistically. NAs were mixed with SA and oseltamivir carboxylate to detect the rate of inhibition. The effect of inhibitory rate on SA and oseltamivir carboxylate in combination against N1 and N2 were shown in Fig. 10. The SA-oseltamivir carboxylate combination treatment was significantly more effective than when used alone.
image file: c5ra17336a-f10.tif
Fig. 10 The effect of inhibitory rate on SA and oseltamivir in combination against N1 (A) and N2 (B). For two-drug combination design, the combination of the drugs at their equipotent ratio (the ratio of their IC50s) was chosen. A mixture of the two drugs was prepared and the mixture was serially diluted (2-fold dilutions, SA: oseltamivir carboxylate is equal to 1[thin space (1/6-em)]:[thin space (1/6-em)]1, 0.5[thin space (1/6-em)]:[thin space (1/6-em)]1 and 0.25[thin space (1/6-em)]:[thin space (1/6-em)]1 at the concentration of their IC50 values) to obtain a wide dosage range, as indicated in the CalcuSyn standard protocol. For single-drug treatment, serial dilutions were prepared from the serial dilutions of 0.1–0.5 times and 1–4 times of each compound, using the same protocol. 30 μL of dissolved NAs were added into a 96-black plate. After NAs were added, the concentration mentioned above of 10 μL SA was added and 10 μL the oseltamivir carboxylate in the different proportional concentrations were added at 37 °C for 30 min, each concentration repeated 3 times. Then 50 μL of 20 μM MU-NANA substrate solution was added. The fluorescence intensity was detected as the NA activity assay.

To further analyze the synergistic effect of the two drugs, a log dose-effect curve and median-effect plot were generated for both drugs using the CalcuSyn software (Fig. 11A). The x intercept of the median-effect plot determines the median-effect dose (Dm), which, under the conditions described, is equivalent to the IC50 values of the drug; the Dm were found to 140.89 μM and 2.42 nM for SA and oseltamivir carboxylate against N1, respectively, when administered separately. The Dm values of the two drug were 18 μM and 1.07 nM for SA and oseltamivir against N1, respectively, when the drugs are used in combination, indicating that the doses needed to achieve 50% inhibitory of N1 were approximately 7.8-fold and 2.26-fold lower than those needed in monotherapy for SA and oseltamivir carboxylate, respectively.


image file: c5ra17336a-f11.tif
Fig. 11 Analysis of the SA-oseltamivir combination treatment in NA of H1N1 and H3N2 under single-step and multistep. The treatment was the same as the effect of inhibitory rate on SA and oseltamivir carboxylate in combination against N1 and N2. (A) and (B) Median-effect curve plots for SA (SA), oseltamivir carboxylate (ose), and the combination of the two drugs (SA/ose) against N1 and N2, respectively, were generated with the CalcuSyn software (Fa, affected fraction; Fu, unaffected fraction; D, concentration of drug used). (C) and (D) Conservative isobologram plots of the combination of SA and ose against N1 and N2, respectively. Dose inhibition curves were drawn for SA and oseltamivir carboxylate, used alone or in combination. For each drug, equipotent combination of various doses (ED50, ED75, ED90 values) were determined using the CalcuSyn software and were plotted against the fractional concentrations of SA and ose on the y and x axis, respectively. Combination index (CI) values, represented by points below the lines, indicate synergy.

We also detected the effect of SA and oseltamivir carboxylate against N2 (Fig. 11B). The Dm values were 144.07 μM and 4.248 nM for SA and oseltamivir carboxylate against N2, respectively, when administered separately. However, the Dm values of the two-drug combination were 45.437 μM and 1.05 nM for SA and oseltamivir carboxylate against N2, respectively, when the drugs are used in combination, indicating the doses needed to achieve 50% inhibitory N2 were approximately 3.17-fold and 4.05-fold lower than those needed in monotherapy for SA and oseltamivir carboxylate, respectively (Fig. 11B).

The evaluation of drug synergism based on a median-effect equation has been widely used. CalcuSyn-generated isobolograms based on the two drugs administered in combination at fixed ratios toward N1 and N2 are shown in Fig. 11C and D. The ED50, ED75, and ED90 (50%, 75%, and 90% equipotent doses) plots for each drug ratio fell below the line indicating a synergistic effect of the drug combination on NA activities. CI values were calculated for all conditions (Table 7). Under the used concentrations, the SA-oseltamivir carboxylate combination treatment was synergistic against both N1 and N2, with CI values ranging between 0.49 and 0.52 for N1, and CI values ranging between 0.56 and 0.88 for N2, respectively (Table 7). The CI values are consistent with conservative isobologram plots.

Table 7 Effect of SA-oseltamivir combination treatments in N1 and N2 activities
  CI at indicated ED
ED50 ED75 ED90
H1N1 0.52 0.50 0.49
H3N2 0.56 0.70 0.88


4 Discussion

In this study, we tested 289 natural compounds for their inhibitory activities towards NAs of influenza virus. The NAs in the allantoic fluid of H1N1, and H3N2 of type A virus and type B virus were used in the assay. Among these compounds, we found that SA exhibited inhibitory activities to these NAs (Table 1). However, the IC50 values were different toward these NAs, which was mostly possible due to difference of the residues and structure at the active site of the influenza virus NAs.

Next, we tested the viral inhibitory activity of the NA inhibiting compound SA in H1N1 or H3N2 infected MDCK cells. Although higher concentration of SA caused a reduction in the cell viability (Fig. 3), it also reduced CPE caused by influenza virus in MDCK cells in a dose-dependent manner (Fig. 4 and 5). These results suggest that SA could inhibit viral growth and protect cells from viral induced CPE by NA inhibition. Based on the structural characteristics of the NAs, type A influenza were divided into group-1 (comprising N1, N4, N5, N8) and group-2 (comprising N2, N3, N6, N7, N9). Our results also suggest that SA may reduce cell damage caused by either group-1 or group-2 type A influenza virus.

We also investigated the type of inhibition caused by SA with N1 or N2. According to the results shown in Fig. 6, SA inhibits NAs by a noncompetitive fashion. Molecular docking results were consistent with the enzyme kinetic analysis (Fig. 7). From analyzing the hydrogen bonds interaction, the residues of Ser125, Phe174, Ile188, Asn189, Trp190 and Asn209 of N1 were considered to be important (Table 4), and Phe100, Pro126, Cys129, Glu162 and Leu163 were identified as key residues in SA-N2 interaction (Table 5).

Traditional Chinese medicines (TCMs) have a long history in China to treat influenza. In the past, researchers found some TCMs to treat influenza. Heartleaf Houttuynia herb (Houttuynia cordata Thunb.) was found to inhibit MDCK cell apoptosis induced by H3N2 virus.43 Asiatic toddalia root (Toddalia asiatica Lam.) showed potent antiviral activities against H1N1 virus, with a 50% effective concentration valued of 4.7 mg L−1 in the MTS assay and 0.9 mg L−1 in the quantitative PCR assay.44 Pu et al. used extractive from Hypericum perforatum known as a TCM for anti-bacteria and defervescence against H1N1 virus in vivo and vitro, they found that it could inhibit the H1N1 in MDCK cells with an EC50 value of 40 μg mL−1.45 Despite a number of reports showed that TCMs could be inhibit influenza virus, limited effective compounds in TCMs were reported. As a consequence, the anti-influenza mechanisms for these TCMs were not known. In recent years, researchers have started to detect compounds in TCMs in cells or in animal models. A variety of polyphenols, flavonoids, saponins, glucosides and alkaloids isolated from TCMs have been studied and tested for anti-influenza activity. Hayashi et al. showed the inhibitory effect of trans-cinnamaldehyde (CA), one of the principal constituents of essential oil derived from cinnamomi cortex, on the growth of influenza A virus in vitro and in vivo, they found CA inhibit the influenza growth in dose-dependent manner and it could also inhibit the viral protein synthesis.46 Four diarylheptanoids from the seed of Alpinia katsumadai showed NA inhibitory activities in micromolar range in vitro against H1N1. Katsumadain A which inhibit the NA of H1N1 with IC50 value between 0.9 and 1.64 μM was also a constituent from the seed of Alpinia katsumadai.43

Dao et al. found 4 chalcone derived compounds from Cleistocalyx operculatus exhibited stronger NA inhibitory activities than flavanones, dihydroflavonols and isoflavones. These 4 chalcones had inhibitory effect against NAs from the wild-type and oseltamivir-resistant H1N1 influenza virus (H274Y mutant). The 4 chalcones inhibited N1 in noncompetitive manner and they could protect MDCK cells with a strong protective effect for viral infection and low toxicity to the host MDCK cells.47 In another report, they found 8 chalcone derived compounds from Glycyrrhiza inflata could inhibit NA of influenza virus (H1N1 and H9N2). The 8 chalcones were all noncompetitive inhibitions.48 SA is a chalcone glycoside. Our results showed that SA inhibited N1 and N2 in a noncompetitive manner. We determined the binding site of SA using molecular simulation (Fig. 8), and the result is in agreement with enzyme kinetics.

Some recent studies showed that the inhibitory effect of the anti-influenza drug bind to the catalytic site could be enhanced by another compound binding in the non-catalytic site. For example, the inhibition of on NAs (H9N2, H1N1, and NA mutants) by oseltamivir in the presence of ehinantin binding with NA in a non-catalytic site was strengthened by several folds.46 Because of binding in non-catalytic site, it is likely that SA may have potential to enhance the inhibitory effect of oseltamivir carboxylate against the oseltamivir-resistant mutant.

In contrast to the widely developed anti-influenza drugs, SA interact with NA at a non-catalytic site and it inhibit NA in micromolar range. It protects cell from viral damage and hinders virus replication in vitro. A synergistic antiviral effect was acquired when SA was administered in combination with oseltamivir carboxylate against the neuraminidase activities of N1 and N2 (Fig. 10). Median-effect curves and conservative isobologram analysis also indicated that the SA-oseltamivir carboxylate combination treatment was synergistic, with CI values in the 0.49–0.52 against N1 and 0.56–0.88 against N2 (Fig. 11). Chalcones have been reported to inhibit NA of H1N1, in a noncompetitive manner and enhance the inhibitory effect of oseltamivir.48 SA is a chalcone glycoside derivative. Oseltamivir located in the center of the active site of NAs while SA bound at the backside of NAs (Fig. 7). The different binding to the NA resulted different mode of action. It is most likely that the SA binding caused a change of NA conformation, which lead to a reduced activity of NA and a more efficient inhibition of NA by oseltamivir, thus resulted as synergism of inhibition. SA and oseltamivir carboxylate combination treatment were both synergistic against N1 and N2.

These findings suggest that SA exerts synergistic antiviral activity when using in combination with oseltamivir against NAs of H1N1 and H3N2. It is worthwhile to further test whether the synergism of SA and oseltamivir can overcome the drug resistance caused by the NA mutations and investigate the treatment strategy to add SA to oseltamivir as effective anti-influenza therapeutics.

5 Conclusions

We identified SA from a Chinese medicinal herbal compound library as one of neuraminidase inhibitor. It showed a significant reduction for viral replication in MDCK cells against H1N1 and H3N2 influenza virus. The type of inhibition between SA and N1 or N2 was noncompetitive by the enzyme kinetic tests. The interaction of SA with N1 and N2 was simulated through molecular simulation and docking, which showed that SA bound in the non-active site of N1 and N2. Combination therapy studies were undertaken to investigate the effect of SA when administered in combination with oseltamivir. The results showed that SA-oseltamivir combination treatment resulted in synergism against N1 or N2. These results suggest that an herbal formulation containing SA may serve as an effective supplementary strategy to currently available anti-influenza therapeutics.

Appendix

ID no. Name Molecular weight
110759 Bornyl acetate 196.286
110776 Venillic acid 168.147
11688 Natural borneol 154.249
111512 Isoborneol 154.249
110881 Borneol 154.2
110809 Protocatechuic acid 154.12
100815 Curcumol 236.35
110728 Menthol 198.302
110845 Salicylic acid 138.121
110792 Butyl-phydroxybenzoate 216.209
110831 Gallic acid 1 70.12
110747 Camphor 152.233
110885 Caffeic acid 180.157
111735 Liquidambaric acid 440.65
100528 Guaifenesin 198.216
110808 Catanol 362.329
111541 Fumaric acid 116.072
110810 Protocatechuic aldehyde 179.5
110812 E-10-Hydroxy-3-decylennic acid 186.25
110708 Paeonol 166.174
110755 Ursodeoxycholic acid 392.572
110851 β-Sitosterol 414
110816 Sodium tauroursodeoxycholate 392.58
110815 Sodium Taurocholate 537.686
110806 Chenodesoxuchalic acid 392.572
110803 Cinobufagin 442.545
110744 Sarsasapogenin 416.636
110846 Sodium taurochenodeoxycholic 522.694
110724 Deoxycholic acid 392.572
110718 Recibufogenin 384.508
111638 Ecdysterone 480.634
111731 Fraxetin 208
109711 Columbianadin 328.36
110741 Aesculetin 178.142
110837 Isofraxidin 222.194
110822 Osthol 244.29
110900 Daphnetin 178.142
110826 Imperatorin 270.28
110827 Isoimperatorin 270.28
111511 Scoparone 206.195
42096 6,7-Dimethoxyl-coumarin 206.19
110723 Glycyrrhetinic acid 470.64
110738 Isopsoralen 186.16
111513 7-Methoxy coumarin 176.17
111741 6-Hydroxy-7-methoxycoumarin 192
111711 Praeruptorin A 386
110836 Sesamine 354.353
110835 Ethyl-p-methoxycinnamate 206.238
111568 Linderane 260.285
110854 Dehydroandrographolide 332.434
110797 Andrographolide 350.449
110865 Bilobalide 326.299
111747 Protopanaxadiol 460.6
111655 Andrographolidi natril bisulfis 262.13
110701 Panaxadiol 460.732
111664 Epifriedelanol 428.733
111525 Dehydrocostuslactone 230.302
110760 Alantolactone 232.318
110800 Evodin 470.512
110702 Panaxatriol 476.731
100200 Artesunate 384.43
110761 Isoalantolactone 232.318
110863 Ginkgolide B 424.399
110862 Ginkgolide A 408.399
110864 Ginkgolide C 440.398
1566 Triptolide 360.401
111665 Germacrone 218.335
111518 Cucurbitacin IIa 574.702
110742 Ursolic acid 456.7
110753 Chlorogenic acid 354.309
110880 Pseudolaric acid 430.491
100271 Artemether 298.375
111663 Friedelin 426.717
111517 Gossypol 518.554
111581 Shionone 426.717
1539 Diosgenin 414.621
110709 Oleanolic acid 456.7
111524 Costunolide 232.33
110787 Aloin 418.394
111575 Polydatin 390.384
110794 Rhaponticin 420.41
1110893 Madecassicside 975.121
111582 Cynanchagenin 500.584
110887 Uridine 244.201
111574 Syringin 372.367
111590 Chonglou saponin I 855.021
110892 Asiaticoside 959.122
111536 Tubeimiside I 1319.43
110819 Arctiin 534.552
111571 Isorhamnetin-3-O-nehesperidin 624.56
110745 Notoginsenoside R1 919.101
111523 5-o-Methyl visammioside 452.453
111685 Asperosaponin VI 636.856
110820 Amygdalin 457.429
110841 Pseuoginsenoside F11 801.013
111640 Loganin 390.382
111515 Stevioside 804.872
110844 2,3,5,4′-Tetrahedroxystilbene-2-O-D-glucoside 406.383
111538 Quercitroside 448.377
111522 prim-O-glucosylcimifugin 468.451
111528 Buddleoside 592.55
111553 Ginserg stem and leaf faponins
110778 Saikosaponin D 780.982
110770 Gentiopicrin 356.325
110777 Saikosaponin A 780.982
110736 Paeoniflorin 480.462
111530 Acteoside 624.587
110785 Swertiamain 374.34
111610 Liguiritin 418.394
110821 Forsythin 534.552
110818 Salidroside 300.304
110781 Astragaloside 784.97
110782 Clinodiside A 959.125
110754 Ginsenoside Re 947.154
111580 Methyl Hesperidin 624.587
111592 Chonglou saponin VI 738.906
110870 Sanqi total saponins 872.0
111537 Pinoresinol diglucoside 682.67
110891 Huangshanyao saponins extract
111596 Picroside-II 512.461
111607 Mangiferin 422.34
111695 Sophoricoside 432.37
111670 Echinacoside 786
111714 Sec-o-glucosylhamaudol 438
111745 Picfeltrarraenin IA 762.9
111748 Ginsenoside Rh2 622.6
111742 Sweroside 358.34
111727 Picroside I 492
111738 Daidzin 416
111719 Ginsenoside Rf 801
111686 Ginsenoside Rb3 1079
111629 2′′-O-galloylhyperin 616.48
110871 Sanqi stem and leaf saponins
111593 Chonglou saponin VII 1049.2
100080 Rutin 664.563
110703 Ginsenoside RgI 1602.03
110749 Geniposide 388.366
110715 Baicalin 446.361
110721 Hesperidin 610.561
110734 Jujuboside A 1207.35
111573 Typhaneoside 770.685
110722 Naringin 580.535
110740 Ginsenoside Rb1 1109.29
110804 Ginsenoside Rg3 785.013
111668 Rhamnosylvitexin 578.519
110737 Icariin 676.662
111521 Hyperoside 464.376
110842 Scutellarin 492.473
110879 Adenosine 267.242
111508 D-Xylose 150.13
111506 Arabinose 150.131
110833 Glucose anhydrous 180.16
111504 D-Fructose 180.156
111507 Sucrose 342.296
110795 Aloe-emodin 270.237
110758 Physcion 284.263
110756 Emodin 270.237
110829 1,9-Dihydroxyanthraquinone 240.211
110769 Shikonin 288.295
110852 Cryptonshinone 296.36
111605 Sulfotanshinone sodium 396
110796 Chrysophanol 254.237
110766 Tanshinonel IIA 702.616
110867 Tanshinonel I 294.34
100228 Menadiol acetate 258.269
110884 Mollugin 284.307
110757 Rhein 284.22
111514 Wogonin 284.263
110856 Silymarin 482.436
110762 Alpinetin 270.28
111502 Daidzein 254.237
111554 Vitexicarpin 374.3
111595 Baicalein 270.237
111555 Lysionotin 344.315
110860 Isorhanetin 316.262
110861 Kaempferol 286.236
111557 Irisflorentin 386.352
110850 Farrerol 300.306
100081 Quercetin 302.236
110752 Puerarin 416.378
110763 Cardamonin 270.28
110772 Patchoulialcohol 222.366
111701 Chrysin 254
111520 Luteolin 286.23
110872 Arginine 174.201
111578 L-Hydroxyproline 131.13
110735 Glycine 75.067
110875 L-Citrulline 175.186
110890 Histidine 155.155
110876 Leucine 131.173
110873 DL-Aminopropionic acid 89.09
110889 Threomine 119.18
110874 DL-Aminovaleic acid 117.15
111533 Homoharringtonine 545.621
110779 Papaverine hydrochloride 375.846
100747 Vincamine 354.443
110894 Betaine 117.146
111666 Dihydrocapsaicin 307.428
110886 Adenine 135.127
110775 Piperine 285.338
110784 Sophoridine 248.364
110780 Oxymatrine 264.363
100249 Raceanisodamine 305.38
110805 Matrine 248.364
100121 Theophylline 180.164
100243 Huperzine A 258.316
110774 Sinomenine 329.39
100526 Hydroxycamptothecin 364.352
110801 Rutaecarpine 287.315
100476 Methscopolamine bromide 398.292
111654 Dictamnine 199.205
111652 Oxysophocarpine 262.347
110802 Evodiamine 303.358
100382 Paclitaxel 853.906
110733 Jatrorrhizine hydrochloride 374.887
111718 Chelerythrine 348.36
111651 Cavidine 353.412
111647 Cepharanthin 606.707
100270 Nimodipine 418.44
100336 Tinidazole 247.273
110839 Capsaici 305.412
100135 Glibenclamide 494.004
100412 Sulfagunidine 232.26
110732 Palmatine hydrochloride 391.888
110717 Indirabin 262.263
100547 Lappaconitine adhesive 584.7
110746 Aristolochic acid A 341.272
11071 Indigotin 262.27
110726 Tetrahydropalmatine 355.428
110895 Bullatine A 343.503
100250 Isosorbide dinitrate 236.136
110750 Peimine 431.651
110751 Peinine 429.64
111667 Dehydrocavidine 353
110711 Tetrandrine 622.75
110793 Fangchinoline 608.723
110720 Aconitine 645.737
110883 Trigonelline 137.136
111566 Nuciferine 295.376
110712 Stachydrine hydrochloride 179.644
110853 Protopine 353.369
100465 Methylcantharidinimde 209
111608 Convza Blinii extract
111501 Allantoin 158.116
110807 Gastrodin 286.278
110704 Cordycepin 251.242
110866 Ginkgo biloba extract
100385 Hilieidum 284.26
110877 Catechin 290.268
110843 Diphenyl 154
110878 Epicatechin 290.268
110811 Dracohodin perochlorate 366.75
110896 Succinic acid 118.088
110817 Chuangxiongzine hydrochloride 208.69
100247 Sodium houttuyfonate 302.36
100845 Ligustrazine phosphate 242
110855 Sodium danshensu 220
110857 Schisandrin 432.5
110859 Hupehenine 415.345
110888 Cycloyirobuxinum D 402.364
111535 Resveratrol 390
111637 Safflomin A 612.533
111689 β,β-Dimethylacrylalkannin 370.39
111696 Liensinine perchlorate 610.74
111699 Galangin 270.25
111700 Fraxinellon 232
111702 Sinapine cyanide sulfonate 368
111703 Formonontin 268.27
111712 RaddeaninA 896
111717 1,3-O-dicaffeoylquinic acid 516.45
111721 Oridonin 364.43
111744 1-Hydroxy-3,4,5-trimethoxyxanthone 302
110765 γ-Schisandrin 400.46
110764 Deoxyschizandrin 416.507
110882 Magnoshinin 414.491
110773 Ferulic acid 194.18
111532 Bergenin 328.271
111645 Podophyllotoxin 414.405
111529 Schisantherin 536.57
111660 Loureirin A 286.322
111558 Loureirin B 316.35
111539 Toddalolatone 308.326
110729 Magnolol 266.334
110730 Honokiol 266.334
111561 Fargesin 370.396
100202 Artemisinin 282.332
111559 Cochinchinenin C 514.566
110823 Curcumin 368.38
111594 Total ginkgolic acid 346.49

Acknowledgements

The authors gratefully acknowledge financial support from the National Natural Science Foundation of China (No. 31170742 and No. 31370742) and Fund from Science and Technology Department of Jilin Province (No. 20130206066YY).

Notes and references

  1. A. E. Fiore, D. K. Shay, K. Broder, J. K. Iskander, T. M. Uyeki, G. Mootrey, J. S. Bresee and N. J. Cox, MMWR Recommendations & Reports–Morbidity & Mortality Weekly Report Recommendations & Reports, 2009, vol. 58, pp. 1–52.
  2. K. R. Short, P. C. Reading, L. E. Brown, J. Pedersen, B. Gilbertson, E. R. Job, K. M. Edenborough, M. N. Habets, r. A. Zome, P. W. Hermans, D. A. Diavatopoulos and O. L. Wijburg, Infect. Immun., 2013, 81, 645–652 CrossRef CAS PubMed.
  3. R. Gao, B. Cao, Y. Hu, Z. Feng, D. Wang, W. Hu, J. Chen, Z. Jie, H. Qiu, K. Xu, X. Xu, H. Lu, W. Zhu, Z. Gao, N. Xiang, Y. Shen, Z. He, Y. Gu, Z. Zhang, Y. Yang, X. Zhao, L. Zhou, X. Li, S. Zou, Y. Zhang, X. Li, L. Yang, J. Guo, J. Dong, Q. Li, L. Dong, Y. Zhu, T. Bai, S. Wang, P. Hao, W. Yang, Y. Zhang, J. Han, H. Yu, D. Li, G. F. Gao, G. Wu, Y. Wang, Z. Yuan and Y. Shu, N. Engl. J. Med., 2013, 368, 1888–1897 CrossRef CAS PubMed.
  4. N. L. La Gruta, K. Kedzierska, J. Stambas and P. C. Doherty, Immunol. Cell Biol., 2007, 85, 85–92 CrossRef PubMed.
  5. H. N. Gao, H. Z. Lu, B. Cao, B. Du, H. Shang, J. H. Gan, S. H. Lu, Y. D. Yang, Q. Fang, Y. Z. Shen, X. M. Xi, Q. Gu, X. M. Zhou, H. P. Qu, Z. Yan, F. M. Li, W. Zhao, Z. C. Gao, G. F. Wang, L. X. Ruan, W. H. Wang, J. Ye, H. F. Cao, X. W. Li, W. H. Zhang, X. C. Fang, J. He, W. F. Liang, J. Xie, M. Zeng, X. Z. Wu, J. Li, Q. Xia, Z. C. Jin, Q. Chen, C. Tang, Z. Y. Zhang, B. M. Hou, Z. X. Feng, J. F. Sheng, N. S. Zhong and L. J. Li, N. Engl. J. Med., 2013, 368, 2277–2285 CrossRef CAS PubMed.
  6. Q. Li, L. Zhou, M. Zhou, Z. Chen, F. Li, H. Wu, N. Xiang, E. Chen, F. Tang and D. Wang, N. Engl. J. Med., 2013, 14, 1668–1677 Search PubMed.
  7. X. Wang, W. Jia, A. Zhao and X. Wang, Phytother. Res., 2006, 20, 335–341 CrossRef CAS PubMed.
  8. R. J. Russell, L. F. Haire, D. J. Stevens, P. J. Collins, Y. P. Lin, G. M. Blackburn, A. J. Hay, S. J. Gamblin and J. J. Skehel, Nature, 2006, 443, 45–49 CrossRef CAS PubMed.
  9. T. Betakova, Curr. Pharm. Des., 2007, 13, 3231–3235 CrossRef CAS PubMed.
  10. M. N. Matrosovich, T. Y. Matrosovich, T. Gray, N. A. Roberts and H.-D. Klenk, J. Virol., 2004, 78, 12665–12667 CrossRef CAS PubMed; K. Das, J. M. Aramini, L. C. Ma, R. M. Krug and E. Arnold, Nat. Struct. Mol. Biol., 2010, 17, 530–538 Search PubMed.
  11. L. M. Surhone, M. T. Timpledon and S. F. Marseken, Rimantadine, Betascript Publishing, 2010 Search PubMed.
  12. P. K. Cheng, A. P. To, T. W. Leung, P. C. Leung, C. W. Lee and W. W. Lim, Emerging Infect. Dis., 2010, 16, 155 CrossRef PubMed.
  13. A. C. Hurt, J. Ernest, Y. M. Deng, P. Iannello, T. G. Besselaar, C. Birch, P. Buchy, M. Chittaganpitch, S. C. Chiu, D. Dwyer, A. Guigon, B. Harrower, I. P. Kei, T. Kok, C. Lin, K. McPhie, A. Mohd, R. Olveda, T. Panayotou, W. Rawlinson, L. Scott, D. Smith, H. D'Souza, N. Komadina, R. Shaw, A. Kelso and I. G. Barr, Antiviral Res., 2009, 83, 90–93 CrossRef CAS PubMed.
  14. J. Boon-Long, K. Ikuta, G.-R. Bai and N. Takeda, Bulletin of the Department of Medical Sciences, 2014, vol. 55, pp. 117–127 Search PubMed.
  15. G. Orozovic, K. Orozovic, J. D. Jarhult and B. Olsen, PLoS One, 2014, 9, e89306 Search PubMed.
  16. A. Meijer, A. Lackenby, O. Hungnes, B. Lina, S. van der Werf, B. Schweiger, M. Opp, J. Paget, J. van de Kassteele and A. Hay, Emerging Infect. Dis., 2009, 15, 552 CrossRef PubMed.
  17. M. Samson, A. Pizzorno, Y. Abed and G. Boivin, Antiviral Res., 2013, 98, 174–185 CrossRef CAS PubMed.
  18. T. Baranovich, R. Saito, Y. Suzuki, H. Zaraket, C. Dapat, I. Caperig-Dapat, T. Oguma, I. I. Shabana, T. Saito and H. Suzuki, J. Clin. Virol., 2010, 47, 23–28 CrossRef CAS PubMed.
  19. V. P. Mishin, K. Sleeman, M. Levine, P. J. Carney, J. Stevens and L. V. Gubareva, Antiviral Res., 2014, 101, 93–96 CrossRef CAS PubMed.
  20. Q. Liu, J. Ma, D. R. Strayer, W. M. Mitchell, W. A. Carter, W. Ma and J. A. Richt, Expert Rev. Anti-Infect. Ther., 2014, 12, 165–169 CrossRef CAS PubMed.
  21. J. Zhou, D. Wang, R. Gao, B. Zhao, J. Song, X. Qi, Y. Zhang, Y. Shi, L. Yang, W. Zhu, T. Bai, K. Qin, Y. Lan, S. Zou, J. Guo, J. Dong, L. Dong, Y. Zhang, H. Wei, X. Li, J. Lu, L. Liu, X. Zhao, X. Li, W. Huang, L. Wen, H. Bo, L. Xin, Y. Chen, C. Xu, Y. Pei, Y. Yang, X. Zhang, S. Wang, Z. Feng, J. Han, W. Yang, G. F. Gao, G. Wu, D. Li, Y. Wang and Y. Shu, Nature, 2013, 499, 500–503 CrossRef CAS PubMed.
  22. R. Hai, M. Schmolke, V. H. Leyva-Grado, R. R. Thangavel, I. Margine, E. L. Jaffe, F. Krammer, A. Solorzano, A. Garcia-Sastre, P. Palese and N. M. Bouvier, Nat. Commun., 2013, 4 Search PubMed.
  23. K. Sleeman, V. M. Mishin VPDeyde, Y. Furuta, A. I. Klimov and L. V. Gubareva, Antimicrob. Agents Chemother., 2010, 54, 2517–2524 CrossRef CAS PubMed.
  24. K. Das, J. M. Aramini, L. C. Ma, R. M. Krug and E. Arnold, Nat. Struct. Mol. Biol., 2010, 17, 530–538 CAS.
  25. A. Dias, D. Bouvier, T. Crépin, A. A. Mccarthy, D. J. Hart, F. Baudin, S. Cusack and R. W. H. Ruigrok, Nature, 2009, 458, 914–918,  DOI:2010.1038/nature07745.
  26. L. Tian, Z. Wang, H. Wu, S. Wang, Y. Wang, Y. Wang, J. Xu, L. Wang, F. Qi and M. Fang, J. Ethnopharmacol., 2011, 137, 534–542 CrossRef PubMed.
  27. H. Ge, Y. F. Wang, J. Xu, Q. Gu, H. B. Liu, P. G. Xiao, J. Zhou, Y. Liu, Z. Yang and H. Su, Nat. Prod. Rep., 2010, 27, 1758–1780 RSC.
  28. J. Y. Ho, H. W. Chang, C. F. Lin, C. J. Liu, C. F. Hsieh and J. T. Horng, Viruses, 2014, 6, 1861–1875 CrossRef PubMed.
  29. N. Oyuntsetseg, M. A. Khasnatinov, P. Molor-Erdene, J. Oyunbileg, A. V. Liapunov, G. A. Danchinova, S. Oldokh, J. Baigalmaa and C. Chimedragchaa, BMC Complementary Altern. Med., 2014, 14, 235 CrossRef PubMed.
  30. X. Wang, X. Xu, Y. Li, X. Li, W. Tao, B. Li, Y. Wang and L. Yang, Integrative biology : quantitative biosciences from nano to macro, 2013, vol. 5, pp. 351–371 Search PubMed.
  31. D. A. Gschwend, A. C. Good and I. D. Kuntz, J. Mol. Recognit., 1996, 9, 175–186 CrossRef CAS PubMed.
  32. J. H. An, D. C. W. Lee, A. H. Y. Law, C. L. H. Yang, L. L. M. Poon, A. S. Y. Lau and S. J. M. Jones, J. Med. Chem., 2009, 52, 2667–2672 CrossRef CAS PubMed.
  33. U. S. Tambunan, A. A. Parikesit, Y. Dephinto and F. R. Sipahutar, Acta Pharm., 2014, 64, 157–172 CrossRef CAS PubMed.
  34. Natural Products Database (NPD) http://wiki.compbio.ucsf.edu/wiki/index/php/Natural_products _database. 2011.
  35. Y. Wang, D. Wu, D. Yu, Z. Wang, L. Tian, Y. Wang, W. Han and X. Fang, J. Mol. Model., 2012, 18, 3445–3453 CrossRef CAS PubMed.
  36. P. Ramanujam, W. Tan, S. Nathan and K. Yusoff, Arch. Virol., 2002, 147, 981–993 CrossRef CAS PubMed.
  37. M. Potier, L. Mameli, M. Belisle, L. Dallaire and S. B. Melancon, Anal. Biochem., 1979, 94, 287–296 CrossRef CAS PubMed.
  38. D. F. Smee, J. H. Huffman, A. C. Morrison, D. L. Barnard and R. W. Sidwell, Antimicrob. Agents Chemother., 2001, 45, 743–748 CrossRef CAS PubMed.
  39. G. M. Morris, D. S. Goodsell, R. S. Halliday, R. Huey, W. E. Hart, R. K. Belew and A. J. Olson, J. Comput. Chem., 1998, 19, 1639–1662 CrossRef CAS.
  40. T. C. Chou, M. Hayball and L. Cw., CalcuSyn-windows software for dose-effect analysis and synergism/antagonism quantification, and user's manual, Biosoft, Cambridge, United Kingdom, 1996 Search PubMed.
  41. T. C. Chou and P. Talalay, Eur. J. Biochem., 1981, 115, 207–216 CrossRef CAS PubMed.
  42. D. P. Nayak and U. Reich, J. Virol. Methods, 2004, 122, 9–15 CrossRef CAS PubMed.
  43. U. Grienke, M. Schmidtke, J. Kirchmair, K. Pfarr, P. Wutzler, R. Dürrwald, G. Wolber, K. R. Liedl, H. Stuppner and J. M. Rollinger, J. Med. Chem., 2009, 53, 778–786 CrossRef PubMed.
  44. S. Lu, Y. Qiao, P. Xiao and X. Tan, China J. Chin. Mater. Med., 2005, 30, 998–1001 Search PubMed.
  45. X.-y. Pu, J.-p. Liang, X.-h. Wang, T. Xu, L.-y. Hua, R.-f. Shang, Y. Liu and Y.-m. Xing, Virol. Sin., 2009, 24, 19–27 CrossRef.
  46. K. Hayashi, N. Imanishi, Y. Kashiwayama, A. Kawano, K. Terasawa, Y. Shimada and H. Ochiai, Antiviral Res., 2007, 74, 1–8 CrossRef CAS PubMed.
  47. T. T. Dao, B. T. Tung, P. H. Nguyen, P. T. Thuong, S. S. Yoo, E. H. Kim, S. K. Kim and W. K. Oh, J. Nat. Prod., 2010, 73, 1636–1642 CrossRef CAS PubMed.
  48. T. T. Dao, P. H. Nguyen, H. S. Lee, E. Kim, J. Park, S. I. Lim and W. K. Oh, Bioorg. Med. Chem. Lett., 2011, 21, 294–298 CrossRef CAS PubMed.

This journal is © The Royal Society of Chemistry 2015