DOI:
10.1039/C5RA16936D
(Paper)
RSC Adv., 2015,
5, 86242-86253
Tumor-targeted folate-decorated albumin-stabilised silver nanoparticles induce apoptosis at low concentration in human breast cancer cells†
Received
21st August 2015
, Accepted 27th September 2015
First published on 28th September 2015
Abstract
At the present time, silver nanoparticles (Ag NPs) have been widely used in clinical and household products due to their broad spectrum antibacterial activity. However, the cytotoxicity and genotoxicity associated with Ag NPs at higher concentration hinders their applications in the field of cancer therapy. The current study exploits the folate-mediated delivery of bovine serum albumin (BSA) stabilized Ag NPs and thereby overcomes various drawbacks associated with non-specific targeting. The albumin coating enhanced the stability of the Ag NPs and also provided a surface for folate conjugation via carbodiimide reaction. Physicochemical characterization confirms the formation of folate-decorated albumin-stabilized Ag NPs (FA-BSA-Ag NPs). The prepared nanoparticles show remarkable binding, especially in the case of MCF-7 (FR-positive) cells having abundant folate receptors (FR) on their surface that leads to enhanced cellular internalization as compared to A549 (FR negative) cells. The cell viability assay corroborates the better therapeutic efficacy of the prepared NPs against MCF-7 cells as compared to A549 cells. Flow cytometer analysis reveals an increase in reactive oxygen species (ROS) that leads to oxidative stress-induced apoptosis in both the cell lines. Further cell cycle, morphological and nuclear analysis suggests characteristic apoptosis indications, which was further confirmed by gene expression analysis. Altogether, these studies implied that the tumor-targeted FA-BSA-Ag NPs induce apoptosis in MCF-7 cells at much lower Ag NP concentration. In future, these targeted albumin stabilized Ag NPs could provide a more safe and effective alternative approach in the field of cancer therapy.
Introduction
In recent years, metal and semiconductor nanoparticles have found tremendous applications in the field of nanomedicine.1–3 The triumph of food and drug administration (FDA) approved Acticoat (Ag NP-based wound dressing bandage) developed tremendous interest among the scientific community.4 Since then, silver nanoparticles have been extensively studied either alone or in composite form for their antibacterial and anticancer potential.5–8 Moreover, our previous studies corroborate that, apart from disturbing the membrane integrity and normal function of cells, Ag NPs by themselves or in combination with other therapeutic agents successfully induce apoptosis in various human cancer cells.2 The therapeutic potential of Ag NPs lies in their ability to augment ROS generation and activate mitochondria-dependent apoptosis.9 However, major drawbacks associated with Ag NPs such as genotoxicity and DNA damaging capability, have hindered their therapeutic applications.10,11 This provokes a need to develop a safe and effective system for efficient delivery of Ag NPs with enhanced therapeutic efficacy at the lowest possible concentrations of Ag NPs and thereby provide an alternative mode of cancer therapy.
In this regard, protein-based nanoparticles have emerged as a potential candidate for therapeutic applications because of their high biocompatibility, high water solubility, biodegradability, good availability, easy surface modification, and non-toxic and non-immunogenic properties.1,12,13 With the success of FDA approved Abraxane (albumin-based drug nano-formulation), albumin-based nanoparticles have emerged as a potential candidate in the field of nanotechnology and cancer therapy.14–17 Moreover, the presence of functionally charged groups, including amino and carboxylic groups, offer albumin with various possibilities for surface modification and interaction with various nanoparticles and drug molecules.13 The biocompatible albumin coating around the NPs enhances their stability and consequently provides a surface for the attachment of various functional targeting moieties.
The current conventional therapies have many unresolved challenges including non-specific accumulation of the therapeutic molecules, which results in reduced therapeutic efficacy, enhanced toxicity towards neighbouring tissues and limits the maximum available dose.18 These drawbacks need to be addressed in order to develop an efficient tumor-targeted therapeutic system for cancer therapy. Until now, researchers have exploited natural endocytosis pathways for the efficient delivery of therapeutic agents into cells.19 A vast variety of cancer-specific ligands have been explored so far for the enhanced delivery and retention of therapeutic molecules inside the tumor tissue.20 Among them, folate and its conjugates show tremendous affinity towards the folate binding protein, i.e. FR, which has become a confirmed target for non-destructive cancer-specific delivery of therapeutic molecules.21,22 Folic acid (FA), a natural ligand for FR, is a vital dietary vitamin required for DNA biosynthesis, cell proliferation and metabolism.20 The FR is present specifically in abundance on the surface of a variety of cancer cells, including ovary, breast, kidney, myeloid and brain cells, as compared to normal tissues.23,24 Moreover, the high binding affinity towards FR, small size, non-immunogenicity, high stability, ease of attachment, low cost, high availability and high tumor specificity make it an ideal candidate for targeted cancer imaging and therapy.25–29 To date, a large number of folate-conjugated albumin-based nanoparticles have been successfully synthesized for various targeted cancer diagnosis and therapeutic approaches, as illustrated in Table S1.†26–36 Apart from targeted delivery of anticancer drugs and imaging agents, a variety of folate-conjugated albumin-stabilized inorganic nanoparticles have been extensively utilized due to their unique properties. Among them, gold-based nanostructures have been widely used in targeted cancer imaging and photothermal therapy (PTT), while iron oxide-based nanoparticles have found extensive utilization in magnetic resonance imaging (MRI) and hyperthermia.26–28,32,33 In this paper, the anticancer potential of Ag NPs has been explored by preparing FR-targeted FA-BSA-Ag NPs with enhanced therapeutic efficacy, improved bioavailability, and efficient aqueous solubility by a carbodiimide covalent reaction. This system is further characterized and evaluated for its role in the successful induction of apoptosis in human breast and lung cancer cells in vitro. The results corroborate that the FA-BSA-Ag NPs successfully induce apoptosis, even at lower Ag NP concentration as a result of improved bioavailability.
Experimental section
Materials
BSA and dimethyl sulfoxide (DMSO) were obtained from HIMEDIA. Silver nitrate (AgNO3) and sodium borohydride (NaBH4) were procured from Merck (Germany). The cross-linking agent glutaraldehyde (50 wt% in H2O), propidium iodide (PI), 1-ethyl-3-(3-dimethylaminopropyl)-carbodiimide hydrochloride (EDC), N-hydroxy succinimide (NHS) and 2′,7′-dichlorofluorescein diacetate (DCFH-DA) were procured from Sigma-Aldrich. The cell staining dyes rhodamine B (Rho B) and Hoechst 33342 were purchased from Life Technologies. All other chemicals used were molecular biology grade. MCF-7 (breast cancer cells) and A549 cells (non-small lung cancer cells) were received from the National Centre for Cell Science, Pune, India and maintained in Dulbecco’s modified Eagle’s medium (DMEM) containing 10% calf serum and 1% penicillin–streptomycin in a humidified incubator with 5% CO2 at 37 °C.
Preparation of FA-BSA-Ag NPs
Albumin-stabilized Ag NPs were synthesized using a NaBH4 reduction method as reported earlier.37,38 Briefly, BSA (25 mg mL−1) was dissolved in 10 mL of deionized water and then AgNO3 (50 mM) was added into the above solution at 25 °C under vigorous stirring. The pH of the solution was maintained at pH = 8 with 0.1 M NaOH. After 5 min, silver ions were reduced by drop-wise addition of NaBH4 (10 mM), until the colour of the solution changed from colourless to brown. The solution was stirred overnight in the dark. The BSA-Ag NPs were conjugated with FA according to the standard procedure reported earlier.29–32,34 An active ester intermediate (NHS–folate) was prepared by the reaction of EDC/NHS with the carboxyl groups of FA, which in turn covalently conjugated with the amine groups of BSA. Briefly, FA (27 mg) was dissolved in 2 mL DMSO, followed by addition of EDC (58.6 mg) and NHS (35.2 mg), and allowed to stir in the dark for 3 h. Consequently, the pre-activated FA mixture was slowly added to the BSA-Ag NPs solution under alkaline conditions (pH adjusted to 10 with 1 M NaOH). The solution was allowed to stir overnight in the dark at room temperature. The solution was then continuously dialyzed for 3 days and further purified by using a Sephadex G-25 column to remove excess FA and other reactants. The final solution obtained was filtered and stored in an amber-colored bottle at 4 °C, until further use.
Characterization
UV-visible spectroscopic measurements were done on a Lasany double beam L1 2800 UV-visible spectrometer. Fourier transform infrared spectroscopy (FTIR) spectra were recorded on a Thermo Nicolet FTIR spectrometer using KBr pellets in the range of 4000–400 cm−1. The particle size and morphological analysis and elemental mapping were performed using a field emission scanning electron microscope (FE-SEM, Carl Zeiss ULTRA PLUS) having an energy dispersive X-ray (EDX) detector and a transmission electron microscope (TEM, TECNAI G2 20 S-TWIN) operating at 200 kV. A size distribution histogram of the prepared Ag NPs was analysed using ImageJ (http://rsb.info.nih.gov/ij/download.html). X-ray diffraction (XRD) analysis was carried out by using a Bruker AXS D8 Advance powder X-ray diffractometer (Cu-Kα radiation, λ = 1.5406 Å) in the range of 10–90° at a scan speed of 0.5° min−1. Thermal analysis was conducted on an EXSTAR TG/DTA 6300 at a constant rate of 10 °C min−1 under a controlled nitrogen atmosphere, while the concentration of Ag NPs was analyzed by inductively coupled plasma mass spectroscopy (ICP-MS, Perkin-Elmer ELAN DRC-e).
Cell viability assay
The cytotoxicity of the as-prepared FA-BSA-Ag NPs was evaluated on MCF-7 and A549 cells via 3-(4,5-dimethylthiazol-2-yl)-2,5-diphenyltetrazolium bromide (MTT) assay or cell viability assay. The MTT assay is a mitochondria-based assay dependent on the ability of viable cells to convert the tetrazolium salt to purple-colored formazan crystals. Briefly, 104 cells were seeded in a 96-well plate (Corning, Costar, NY). After overnight attachment, cells were treated with different concentrations of BSA, BSA-Ag NPs and FA-BSA-Ag NPs for 24 h. Following incubation, the spent medium was removed and cells were given a phosphate buffered saline (PBS) wash and then incubated with fresh 100 μL DMEM medium containing 10 μL of MTT dye (5 mg mL−1) for 3–4 h at 37 °C. Finally, the supernatant medium was aspirated and formazan crystals formed were dissolved by adding 100 μL of lysis solution and incubating over a gyratory shaker at room temperature for 30 min. The absorbance of the finally dissolved product was taken at 570 nm and 690 nm by using a multimode reader (Cytation 3, Biotek).
Acridine orange/ethidium bromide (AO/EB) dual staining
In order to differentiate apoptotic nuclei from necrotic nuclei, the FA-BSA-Ag NPs treated A549 and MCF-7 cells were stained with AO/EB dual dye.17 Briefly, 2 × 10⁵ cells per well were seeded in a 6-well plate and allow to adhere. After overnight attachment, cells were treated with desired concentrations of FA-BSA-Ag NPs for 24 h. The treated cells were then given a PBS wash followed by incubation with AO/EB (10 μg mL−1 working concentration) for 5–10 min at 37 °C. Subsequently, the spent medium was removed, a PBS wash was given to remove excess dyes before visualizing the cells and images were captured under different filters using a cell imaging system (EVOS FL, Life Technologies, USA).
Cell morphology analysis by FE-SEM
For cell morphological analysis, A549 and MCF-7 cells were seeded on a sterile glass cover slip and incubated overnight for attachment. The cells were then treated with desired concentrations of FA-BSA-Ag NPs for 24 h and then fixed by using 2% glutaraldehyde for 10 min followed by ethanol gradient fixation. The fixed cells were then air dried and sputter coated with gold before being examined under FE-SEM.
Time-dependent morphological examination
The events of apoptosis, such as nuclear chromatin compaction and cytoskeleton alteration, were examined via Hoechst 33342 and rhodamine B (Hoechst–Rho B) fluorescent dual dye combination. Briefly, 2 × 10⁵ cells per well were seeded in a 6-well plate and after attachment, cells were treated with FA-BSA-Ag NPs for different time periods. After treatment, spent medium was removed and cells were given a brief PBS wash, followed by incubation with 2 μL Hoechst dye (stock concentration 10 mg mL−1) and 5 μL Rho B (stock concentration 1 mg mL−1) at 37 °C for 10–15 min. Thereafter, overlay images were obtained under red and DAPI filters.
In vitro cellular uptake studies
A quantitative analysis of Ag uptake by the A549 and MCF-7 cells was done by using ICP-MS analysis. Briefly, 2 × 10⁵ cells were seeded in a 3.5 cm cell culture plate and after overnight attachment, cells were treated with desired concentrations of FA-BSA-Ag NPs for 3 h. In order to remove all extracellular FA-BSA-Ag NPs, the treated cells were given an extensive PBS wash and then harvested and counted. The cells were finally acid-digested by using concentrated nitric acid for 24 h. The digested sample was then diluted with deionized water and Ag concentration was determined by ICP-MS.
Intracellular ROS generation
A549 and MCF-7 cells were seeded in a 6-well plate and incubated overnight for attachment followed by treatment with desired concentrations of FA-BSA-Ag NPs for 3 h. After treatment, cells were given a brief PBS wash followed by incubation with medium supplemented with 20 μM DCFH-DA dye for 20 min at 37 °C. The cells were then harvested and analyzed immediately by using a flow cytometer (Amnis Flowsight). DCFH-DA is a membrane permeable dye used to measure intracellular ROS activity. Inside the cells, the DCFH-DA is cleaved by intracellular esterases and finally converted into highly fluorescent 2,7-dichlorofluorescein (DCF) in the presence of ROS.3 The fluorescence intensity of DCF is detected in channel 2 (intensity_MC_02). The data were acquired for 10![[thin space (1/6-em)]](https://www.rsc.org/images/entities/char_2009.gif) 000 cells per sample and acquired data were analyzed through Amnis Ideas software.
000 cells per sample and acquired data were analyzed through Amnis Ideas software.
Cell cycle analysis
The effect of FA-BSA-Ag NPs on the cell cycle of A549 and MCF-7 cells was determined by PI staining and consequent analysis by flow cytometry as described earlier.39 Briefly, 2 × 10⁵ cells were seeded in a 6-well plate and incubated overnight at 37 °C for attachment. The cells were then treated with desired concentrations of FA-BSA-Ag NPs for 24 h. The cells were carefully harvested by trypsinization to prevent the loss of floating cells, followed by fixation with 70% alcohol for 15 min on ice. The fixed cells pellet obtained after centrifugation was then incubated with PI staining solution (50 μg mL−1 PI, 1 mg mL−1 RNase A, and 0.05% triton X-100) for 30 min at 37 °C in the dark. The PI-stained cells were then analysed using a flow cytometer to determine the cell cycle distribution. A total of 10![[thin space (1/6-em)]](https://www.rsc.org/images/entities/char_2009.gif) 000 events per sample were captured and analyzed through IDEAS software.
000 events per sample were captured and analyzed through IDEAS software.
Gene expression studies
For gene expression analysis, cells were grown in a 6-well plate followed by treatment with appropriate concentrations of FA-BSA-Ag NPs for 24 h. Thereafter, total RNA was isolated from the cells by using Tri reagent (Sigma Aldrich, USA) and cDNA was synthesized by using Superscript II Reverse Transcriptase (Invitrogen, USA) from 1 μg of denatured RNA at 42 °C for 50 min. Differential expression of apoptotic signalling genes was analyzed by using semi-quantitative reverse transcriptase-polymerase chain reaction (RT-PCR) analysis by taking house-keeping gene β-actin as an internal control. Briefly, 1 μL of the above RT product was taken with gene-specific primers as mentioned in Table S4.† The PCR cycle was carried out in a Veriti 96-well thermal cycler (Applied Biosystems) at 94 °C for 3 min (initial denaturation), followed by a PCR cycle at 94 °C for 30 s (denaturation), at 60 °C for 30 s (annealing), at 72 °C for 1 min (extension) and at 72 °C for 10 min (final extension). The final amplified PCR products were visualized and resolved on 1.2% agarose gel containing ethidium bromide under UV light. The band intensity was quantified by using Image lab 4.0 software.
Results and discussion
Synthesis and characterization of FA-BSA-Ag NPs
The objective of the current study is to develop an albumin-based targeted therapeutic agent, where it serves the dual purpose of acting as a stabilizer of Ag NPs and providing free amino groups for the attachment of targeting moieties such as folic acid, as shown in Fig. 1. The Ag NPs were synthesized by a NaBH4 reduction method in the presence of albumin. The formation of albumin-stabilized Ag NPs was primarily studied by UV-visible spectroscopy, showing the appearance of a typical plasmonic band at 420 nm, as shown in Fig. S1.† In the next step, folic acid, a tumor-targeting moiety, was conjugated to the amine groups present on the surface of the BSA-Ag NPs via EDC/NHS coupling chemistry. The EDC and NHS activate the carboxylic acid groups of the folic acid, which in turn combined with the amine groups of albumin. Fig. S2 and S3† correspond to the elemental distribution and EDS pattern of FA-BSA-Ag NPs, showing the existence of silver in the complex. The size and shape of the prepared NPs was determined by using TEM as shown in Fig. 2(a). The TEM image depicts that the particles are spherical in shape, having an average size of around 8.21 ± 2.98 nm; the size distribution histogram of the FA-BSA-Ag NPs is shown in Fig. 2(b). The bright spots in the selected area electron diffraction (SAED) pattern are attributed to the crystalline nature of the Ag NPs with phases (111), (200), (220) and (311).
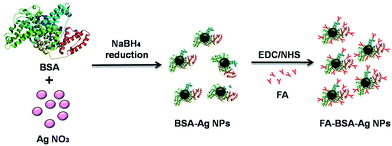 |
| | Fig. 1 A schematic representation of the preparation of FA-conjugated albumin-stabilized silver nanoparticles. The structure of BSA (PDB ID: 3V03) was imported from the RCSB protein data bank. | |
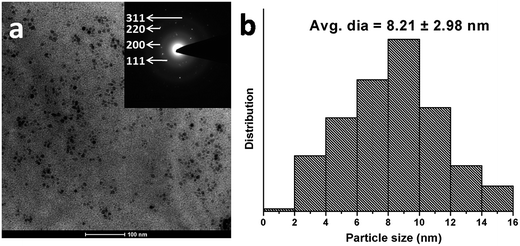 |
| | Fig. 2 Characterization of as-prepared FA-BSA-Ag NPs. (a) TEM image (scale bar: 100 nm) with corresponding SAED pattern (inset). (b) Particle size distribution histogram of FA-BSA-Ag NPs. | |
Fig. 3(b) represents the XRD pattern of the FA-BSA-Ag NPs. A well-defined characteristic diffraction peak appeared at 38.07° that corresponds to the (111) crystal plane of elemental silver, showing the presence of Ag NPs.37 In addition, broader peaks appeared around 20° as a result of the amorphous nature of the coated albumin layer. Moreover, the thermogravimetric (TG) analysis of BSA-Ag NPs, FA-BSA-Ag NPs and BSA alone were carried out under nitrogen atmosphere, illustrating the slower rate of degradation for the albumin-Ag NPs complexes, i.e. BSA-Ag NPs and FA-BSA-Ag NPs, as compared to pristine BSA. From Fig. 3(a), it is clearly evident that the degradation of particles starts from 200 °C and beyond 250 °C a sudden weight loss was observed which is accounted to the loss of small molecules, i.e. ammonia, CO2 etc. Around 400–500 °C, a substantial difference in weight loss was observed, as 21% was left for pristine BSA, 38% was left for FA-BSA-Ag NPs and 40% remained for BSA-Ag NPs, indicating the improved stability of BSA-Ag NPs and FA-BSA-Ag NPs as compared to pristine BSA. Beyond 500 °C, a rapid rate of degradation was noticed in the case of BSA-Ag NPs, which may be as a result of the crystalline nature of Ag NPs. However, a slower rate of degradation was observed for FA-BSA-Ag NPs due to the presence of folic acid. Moreover, beyond 600 °C no significant change was noticed for BSA and BSA-Ag NPs due to char formation, while in the case of FA-BSA-Ag NPs a sudden weight loss was found, thus confirming the presence of folic acid.37
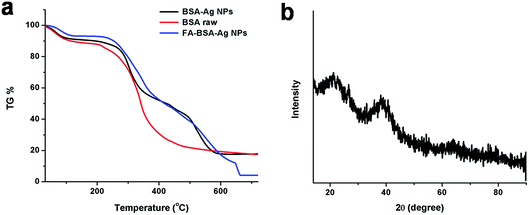 |
| | Fig. 3 (a) TG data curve of BSA (control), BSA-Ag NPs and FA-conjugated BSA-Ag NPs. (b) XRD pattern of FA-BSA-Ag NPs. | |
The conjugation of BSA-Ag NPs with FA is signified by FTIR analysis. The FTIR spectra of FA, BSA-Ag NPs and FA-conjugated BSA-Ag NPs are shown in Fig. 4. The characteristic peaks of BSA-Ag NPs and FA alone are illustrated in Table S2 and S3.†3,40 On comparing the BSA-Ag NPs with FA-BSA-Ag NPs, major shifts in the peaks were observed from 3306.5 to 3331.1, 2959.57 to 2931.51, 1537.43 to 1540.39, 1391.6 to 1397.52 and 1242.2 to 1247.69 cm−1, corresponding to the stretching vibration of –OH groups, stretching vibration of N–H groups, stretching vibration of C–O groups and N–H bending, respectively, which along with other peak shifts confirm the interaction between the FA and BSA-Ag NPs. In the case of the FTIR spectrum of the FA-BSA-Ag NPs, a peak was observed at 1021.06 cm−1 as a result of augmented –CH bending of alkenes and a decline in the anhydride C–O stretching of FA involved in the reaction. Moreover, the appearance of new peaks at 1451.39 cm−1, corresponding to the phenyl ring of folic acid, along with other bands confirms the successful conjugation of FA to the BSA-Ag NPs.41,42
 |
| | Fig. 4 FTIR spectra of (a) BSA-Ag NPs, (b) FA and (c) FA conjugated BSA-Ag NPs. | |
In vitro cytotoxicity
The in vitro cytotoxicity of the BSA-Ag NPs and FA-BSA-Ag NPs was assessed via MTT assay on MCF-7 and A549 cells. An up-regulation of FR is observed in specific cancer cells, such as human breast cancer cells, MCF-7. Thus, the FA-BSA-Ag NPs specifically target the MCF-7 (FR-positive) as opposed to A549 (FR-negative) cancer cells. In Fig. S4† the bare BSA was analyzed for its cytotoxicity against both the cell lines and was found to be non-toxic. After 24 h, more than 90% cell viability was found, which shows the biocompatibility of BSA. Thus, the results suggest that the therapeutic efficacy of FA-BSA-Ag NPs is due to the Ag NPs and not because of the stabilizing agents.
Moreover, the effect of the BSA-Ag NPs and FA-BSA-Ag NPs on the viability of A549 and MCF-7 cells was evaluated by MTT assay. As illustrated in Fig. 5, the results suggest a concentration dependent inhibition of cell viability by BSA-Ag NPs and FA-BSA-Ag NPs. However, the cell inhibition capability of the FA-BSA-Ag NPs was enhanced significantly (around 2.59 fold) for MCF-7 cells as compared to the BSA-Ag NPs, while a small increment was observed (around 1.36 fold) for A549 cells. The IC50 values of the BSA-Ag NPs were found to be 14.21 and 5.97 μg mL−1 and those of the FA-BSA-Ag NPs were found to be 11 and 2.3 μg mL−1 towards A549 and MCF-7 cells, respectively, illustrating that the FA-BSA-Ag NPs exhibit excellent cytotoxicity against both the cell lines as compared to BSA-Ag NPs. However, an enhanced antitumor efficacy and greater suppression effect was observed for MCF-7 (FR-positive) cells treated with FA-BSA-Ag NPs. Thus, the results suggest that the FA modification of BSA-Ag NPs improves the therapeutic efficacy by facilitating the FR-mediated cellular uptake and therefore induces apoptosis at a much lower concentration of Ag NPs.
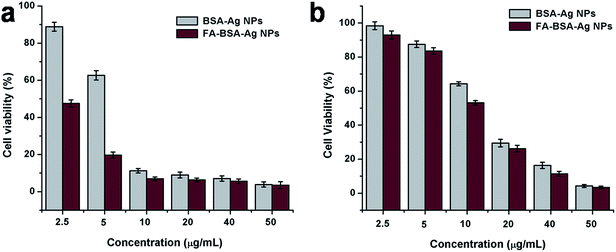 |
| | Fig. 5 Cell viability assay (MTT assay) of BSA-Ag NPs and FA-conjugated BSA-Ag NPs on (a) MCF-7 cells and (b) A549 cells. | |
AO/EB dual staining
The mode of cell death in FA-BSA-Ag NPs treated A549 and MCF-7 cells was determined by staining the cells with a combination of fluorescent DNA intercalating dual dyes (i.e. AO/EB) and then examining them under a fluorescence microscope. The AO dye is taken up by both viable and non-viable cells and gives green fluorescence after binding with double-stranded DNA, while EB can permeate only membrane-compromised cells and binds to the double-stranded DNA to produce red fluorescence. The difference in the permeation capability of both dyes makes it possible to differentiate between viable, apoptotic and necrotic cells.43 The viable healthy cells effectively exclude the EB stain and gives a uniform green-colored fluorescent nucleus due to the presence of AO alone, as shown in Fig. 6(a and e). Similarly, the cells treated with half the IC50 concentration do not show any significant change in the cell morphology and also emit green-colored fluorescence, as shown in Fig. 6(b and d), while the cells treated with IC50 and 2 × IC50 concentrations show typical morphological changes corresponding to apoptosis, such as cytoplasmic constriction, membrane blebbing and nuclear fragmentation.43,44 Fig. 6(c–d and g–h), clearly demonstrate the existence of early apoptosis (EA), characterized by condensed chromatin in the treated cells, along with late apoptosis (LA), characterized by fragmented nuclei and apoptotic bodies. These morphological changes clearly depict the induction of apoptosis in the A549 and MCF-7 cells treated with FA-BSA-Ag NPs. Moreover, the FA modification augmented the apoptosis effect in MCF-7 cells as compared to A549 cells, which may be due to the different expression levels of FR on the surface of the two cell lines. The MCF-7 cells actively adsorbed FA-BSA-Ag NPs via the folic acid-mediated endocytic pathway. Thus, the above results are in correlation with the results obtained from the MTT assay.
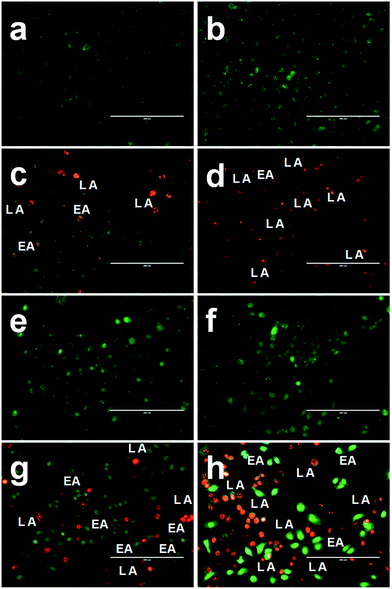 |
| | Fig. 6 Representative images of AO/EB dual staining of (a and e) untreated, (b and f) 0.5 × IC50, (c and g) IC50 and (d and h) 2 × IC50 FA-BSA-Ag NPs treated (a–d) A549 and (e–h) MCF-7 cells, after 24 h of treatment. | |
FE-SEM studies
Further morphological assessment of induction of apoptosis was done in FA-BSA-Ag NPs treated A549 and MCF-7 cells by using FE-SEM analysis. Fig. 7(a and c) clearly depict the characteristic healthy morphology of untreated cells which adhere well to the surface with no substantiation of membrane constriction, while cells treated with FA-BSA-Ag NPs show a loosely attached, rounded, spherical morphology as compared to untreated cells, as shown in Fig. 7(b and d). Moreover, the events of apoptotic cell death, such as membrane blebbing, formation of apoptotic bodies and cytoplasmic constriction were clearly visible in both the cell lines.44
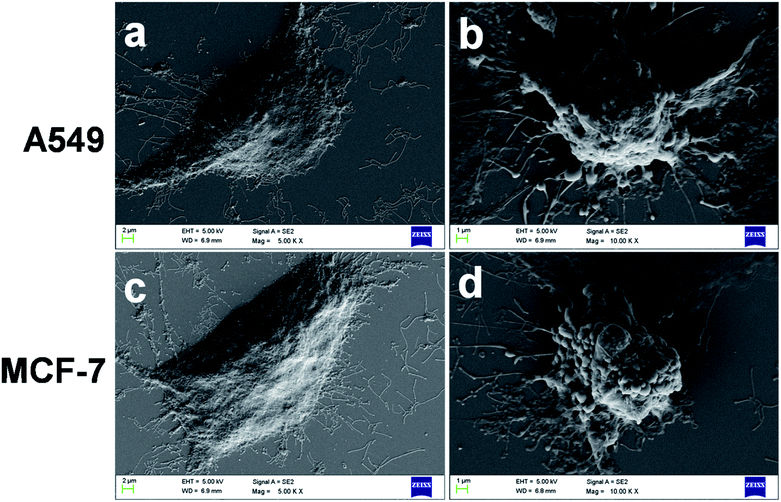 |
| | Fig. 7 Representative FE-SEM images of (a and c) untreated and (b and d) treated A549 and MCF-7 cells. | |
Hoechst–Rho B staining
In addition to AO/EB and FE-SEM analysis, further time-dependent assessment of induction of apoptosis was done by using Hoechst–Rho B staining to monitor the cytoskeleton compaction and nuclear fragmentation. Hoechst 33342 is a membrane-permeable dye that stains the nucleus and emits blue fluorescence on combining with the dsDNA. It is used to differentiate the untreated cells, having normal nuclei, with apoptotic cells, having nuclei with condensed chromatin (pycnotic nucleus).45 On the other hand, Rho B stains the cytoplasm and mitochondria of the cells.43 Fig. 8 and S5† clearly depict the time-dependent chromatin condensation in the nucleus appearing in the form of dark spots (indicated by white arrows) accompanied with simultaneous cytoplasm constriction (as indicated by yellow arrows). Moreover, after 24 h of incubation, a significant number of pycnotic nuclei were observed, suggesting an apoptotic mode of cell death. Altogether, all these morphological analyses suggest the role of FA-BSA-Ag NPs in inducing apoptotic cell death in A549 and MCF-7 cells.
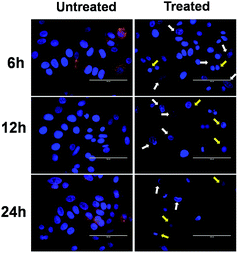 |
| | Fig. 8 Time-dependent overlay images of untreated and FA-BSA-Ag NPs treated (IC50) MCF-7 cells stained with Hoechst 33342 (blue) and co-stained with rhodamine B (red). White arrows indicate chromatin condensation (dark spots) and yellow arrows point towards cytoskeleton compaction. Scale bar: 100 μm. | |
Cellular uptake study
As reported earlier, FA conjugates bind to the FR on cancer cells with same affinity as that of FA alone and get internalized through the plasma membrane via FA-mediated specialized endocytosis and vesicular trafficking.46 In order to quantify the uptake of silver nanoparticles by MCF-7 and A549 cells, ICP-MS analysis was conducted. Both the cell lines were treated with different concentrations of FA-BSA-Ag NPs for 3 h. As shown in Fig. 9, a concentration dependent increase in the Ag NP uptake was observed for both cell lines. However, the amount of Ag NP uptake was found to be significantly higher in the case of MCF-7 as compared to A549 cells, suggesting the successful FA-mediated targeted delivery of Ag NPs in MCF-7 cells. This was held accountable for the higher cytotoxicity in MCF-7 as compared to A549 cells, as observed in the MTT assay.
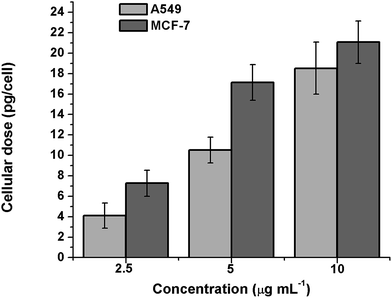 |
| | Fig. 9 Cellular uptake of Ag in A549 and MCF-7 cells treated with different concentrations of FA-BSA-Ag NPs after 3 h. | |
Intracellular ROS determination
ROS-induced oxidative stress is one of the crucial factors responsible for the cytotoxicity of Ag NPs, as reported earlier.47,48 The intrinsic antioxidant defence system protects the body against ROS by keeping a balance between the oxidant/antioxidant levels in cells. However, excessive ROS generation caused due to the impaired antioxidant defence system of the body leads to the induction of oxidative stress, which finally results in DNA damage, mitochondrial dysfunction and apoptotic cell death.3,39 The ROS levels on treatment with FA-BSA-Ag NPs were investigated by using the DCFH-DA assay with a flow cytometer in order to assess their potential role in oxidative stress-mediated cell death. Fig. 10 depicts the levels of ROS generation in FA-BSA-Ag NPs treated MCF-7 and A549 cells. The percentages of ROS producing cells were 2% and 2.4% in untreated MCF-7 and A549 cells, respectively, which increased to 8.4% and 5% on treating the MCF-7 and A549 cells with a 0.5 × IC50 concentration of FA-BSA-Ag NPs. Moreover, in the case of cells treated with IC50 and 2 × IC50 concentrations, a significant increase in the ROS level was found. In MCF-7 cells, the elevated ROS levels at IC50 and 2 × IC50 concentrations were found to be 24.1 and 41.2%, as compared to 18.1 and 26.3% of ROS producing cell population in A549 cells, respectively. These results suggest that the FA-BSA-Ag NPs induced more oxidative stress in MCF-7 as compared to A549 cells due to the FA-mediated targeted delivery of Ag NPs that evokes more ROS generation in MCF-7 cells. The results are in correlation with the MTT and uptake studies.
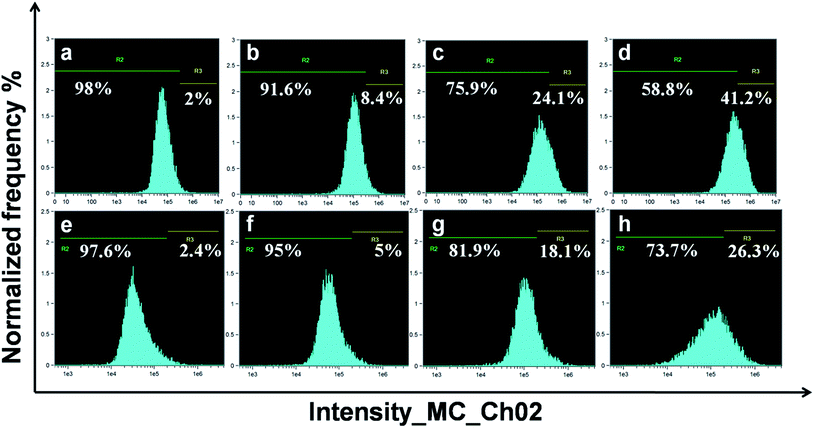 |
| | Fig. 10 Flow cytometric analyses of ROS production in A549 and MCF-7 cells treated with different concentrations of FA-BSA-Ag NPs. | |
Cell cycle analysis
Ag NPs are well known to induce oxidative DNA damage and chromosomal aberrations that result in cell cycle arrest.10,39 The induction of the apoptotic mode of cell death on exposure to FA-BSA-Ag NPs was measured by PI staining, followed by flow cytometric analysis. Fig. 11 demonstrates the effect of the FA-BSA-Ag NPs on the cell cycle distribution pattern of A549 and MCF7 cells incubated with desired concentrations FA-BSA-Ag NPs for 24 h. The results showed that a low concentration of FA-BSA-Ag NPs (i.e. 0.5 × IC50) did not produce any notable change in the cell cycle as compared to the untreated cells; most of the cells were found to be primarily arrested in the G0/G1 phase. However, at higher concentrations (i.e. IC50 and 2 × IC50), a noticeable increase in the sub G0/G1 population accompanied by a decrease in the G0/G1 phase was observed with respect to untreated cells. Moreover, a marked decrease in the S phase was also measured upon exposure to FA-BSA-Ag NPs. Thus, an increase in the sub G0/G1 phase and decrease in the S phase population at IC50 and 2 × IC50 corresponds to the apoptotic mode of cell death.49,50
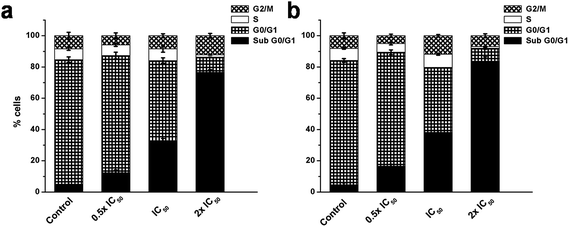 |
| | Fig. 11 Effect of FA-BSA-Ag NPs on cell cycle in (a) A549 and (b) MCF-7 cells evaluated by calculating the percentage of cells in each phase from flow cytometric data. | |
Gene expression analysis
The potential of FA-BSA-Ag NPs to provoke apoptosis in human lung and breast cancer cells was investigated in vitro by means of semi-quantitative RT-PCR analysis. The results suggested the involvement of various pro-apoptotic signalling genes, including caspase 3, bax, bad, c-myc, p53 and anti-apoptotic signalling genes including bcl-xl, as shown in Fig. 12, while β-actin (housekeeping gene) was taken as an internal control, whose expression remains unaltered during the process. As depicted in Fig. 12(a), an up-regulation was observed in the expression of pro-apoptotic genes (indicated by upward arrows), while the expression of anti-apoptotic genes was found to be down-regulated (indicated by a downward arrow). Moreover, the fold change in the expression of genes is shown in Fig. 12(b).
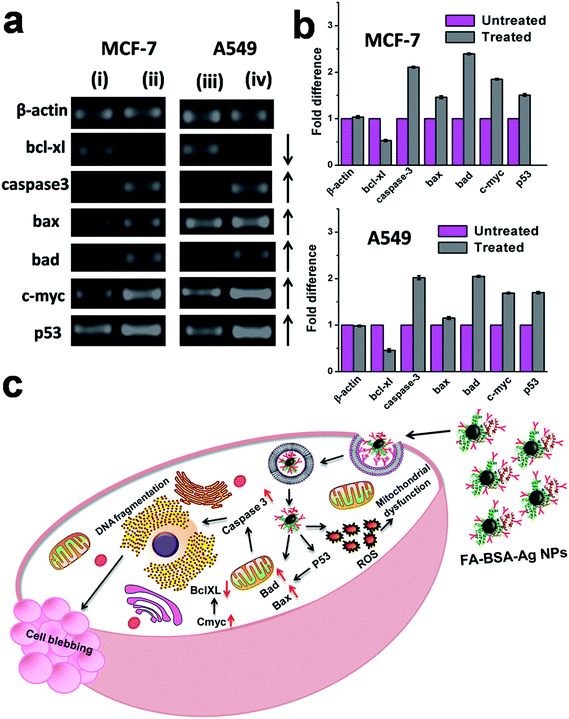 |
| | Fig. 12 (a) Semi-quantitative RT-PCR analysis of apoptotic signalling genes in (i and iii) untreated control MCF-7 and A549 cells, respectively, and (ii and iv) FA-BSA-Ag NPs treated MCF-7 and A549 cells, respectively. (b) Quantitative expression analysis of apoptotic signalling genes in MCF-7 and A549 cells representing the fold increment in the expression of apoptotic signaling genes in treated cancer cells as compared to the control untreated cells. (c) Schematic representation of FA-BSA-Ag NPs induced apoptosis. | |
The apoptotic pathway involved in the FA-BSA-Ag NPs treated cells is shown in Fig. 12(c). The treatment with FA-BSA-Ag NPs leads to membrane destabilization and intracellular ROS generation, which in turn activates the intracellular signalling pathway that finally results in the activation of p53.5,6 The anti-apoptotic bcl-xl (basal cell lymphoma-extra large), a member of the bcl-2 family located on the outer mitochondrial membrane, prevents the cells from entering the apoptotic pathway by blocking the mitochondrial release of cytochrome-c by controlling the membrane permeability either via formation of pores or by creating an ion channel.51 Meanwhile, pro-apoptotic bax (bcl-2-associated X protein) and bad (bcl-2-associated death promoter) promote such release and thereby induce apoptosis by inhibiting the anti-apoptotic function of bcl-xl.52,53 A down-regulation in the expression of bcl-xl along with subsequent up-regulation of bad and bax suggest a successful initiation of apoptosis. Moreover, as reported previously, p53 is found to be involved in the up-regulation of bax.54 An increase in the expression of bax suggests the involvement of p53 in the apoptotic cell death in FA-BSA-Ag NPs treated cells. Further, outer membrane permeabilization (MOMP) results in the translocation of bax from the cytosol to mitochondria, which leads to the release of cytochrome c, a pro-apoptotic molecule, into the cytoplasm via pore formation.54 Finally, the cytochrome c activates caspase-3 (cysteine-aspartic acid proteases), a key factor both in the initiation and execution of apoptosis and also accountable for the cellular DNA fragmentation during apoptosis.55–57 An up-regulation in the expression of caspase-3 suggests its role in the apoptosis in FA-BSA-Ag NPs treated cells. In addition to that, an increased expression of C-myc, a well-known inducer of apoptosis, was also observed, which further validates p53-mediated apoptotic cell death. Our results were found to be in correlation with previous studies.5,9 Thus, the above mentioned gene expression profiles clearly demonstrated p53-mediated apoptotic cell death along with consequent cell blebbing in the FA-BSA-Ag NPs treated A549 and MCF-7 cells.
Conclusions
In the present study, folate-decorated albumin-stabilized Ag NPs are synthesized. The albumin coating not only provides stability but also provides charged amino groups required for folic acid conjugation. The physicochemical characterization demonstrates the successful folate modification of NPs necessary for their targeted delivery. The MTT assays revealed the higher therapeutic efficacy of folate-modified NPs as compared to unmodified NPs against FR-positive human breast cancer cells. The cellular uptake study reveals enhanced uptake in MCF-7 cells as compared to A549 cells due to the cancer specific targeting of the Ag NPs. Moreover, the morphological and nuclear analysis suggests successful initiation of apoptosis in both the cancer cell lines. Further, flow cytometer and gene expression analysis corroborates the efficient induction of apoptosis by two separate mechanistic ways, including ROS production and induction of the apoptotic signalling pathway in both the cancer cell lines. Thus, the current studies proposed that the folate-modified albumin-stabilized Ag NPs elicit an anti-proliferative response and induce apoptosis in FR-positive cells at a much lower concentration and thereby reduce the complications that hinder their role in future nanomedicine and cancer therapeutic applications.
Acknowledgements
This work was supported by the Science and Engineering Research Board (No. SR/FT/LS-57/2012) and Department of Biotechnology (No. BT/PR6804/GBD/27/486/2012), Government of India. BB is thankful to the Ministry of Human Resource Development, Government of India, for a fellowship. Sincere thanks to the Department of Chemical Engineering and Institute Instrumentation Centre, IIT Roorkee for the various analytical facilities provided.
References
- U. K. Sukumar, B. Bhushan, P. Dubey, I. Matai, A. Sachdev and P. Gopinath, Int. Nano Lett., 2013, 3, 45–53 CrossRef.
- P. Gopinath, S. K. Gogoi, A. Chattopadhyay and S. S. Ghosh, Nanotechnology, 2008, 19, 075104 CrossRef CAS PubMed.
- B. Bhushan and P. Gopinath, J. Mater. Chem. B, 2015, 3, 4843–4852 RSC.
- V. C. Mazurak, R. E. Burrell, E. E. Tredget, M. T. Clandinin and C. Field, J. Burns, 2007, 33, 52 CrossRef PubMed.
- P. Gopinath, S. K. Gogoi, P. Sanpui, A. Paul, A. Chattopadhyay and S. S. Ghosh, Colloids Surf., B, 2010, 77, 240–245 CrossRef CAS PubMed.
- P. Dubey, I. Matai, S. U. Kumar, A. Sachdev, B. Bhushan and P. Gopinath, Adv. Colloid Interface Sci., 2015, 221, 4–21 CrossRef CAS PubMed.
- P. Dubey, B. Bhushan, A. Sachdev, I. Matai, S. U. Kumar and P. Gopinath, J. Appl. Polym. Sci., 2015, 132, 42473 CrossRef PubMed.
- I. Matai, A. Sachdev, P. Dubey, S. U. Kumar, B. Bhushan and P. Gopinath, Colloids Surf., B, 2014, 115, 359–367 CrossRef CAS PubMed.
- Y. H. Hsin, C. F. Chen, S. Huang, T. S. Shih, P. S. Lai and P. Chueh, Toxicol. Lett., 2008, 179, 130–139 CrossRef CAS PubMed.
- P. V. Asharani, G. L. K. Mun, M. P. Hande and S. Valiyaveettil, ACS Nano, 2009, 3, 279 CrossRef CAS PubMed.
- P. V. Asharani, Y. L. Wu, Z. Gong and S. Valiyaveettil, Nanotechnology, 2008, 19, 255102 CrossRef CAS PubMed.
- B. Bhushan, U. K. Sukumar, I. Matai, A. Sachdev, P. Dubey and P. Gopinath, J. Biomed. Nanotechnol., 2014, 10, 2950–2976 CrossRef CAS PubMed.
- P. Gopinath, S. Uday Kumar, I. Matai, B. Bhushan, D. Malwal, A. Sachdev and P. Dubey, Cancer Nanotheranostics, Springer Briefs in Applied Acience and Technology, 2015, pp. 1–93 Search PubMed.
- N. K. Ibrahim, N. Desai, S. Legha, P. Soon-Shiong, R. L. Theriault, E. Rivera, B. Esmaeli, S. E. Ring, A. Bedikian, G. N. Hortobagyi and J. A. Ellerhorst, Clin. Cancer Res., 2002, 8, 1038–1044 CAS.
- E. Miele, G. P. Spinelli, E. Miele, F. Tomao and S. Tomao, Int. J. Nanomed., 2009, 4, 99–105 CrossRef CAS.
- M. R. Green, G. M. Manikhas, S. Orlov, B. Afanasyev and A. M. Makhson, Ann. Oncol., 2006, 17, 1263–1268 CrossRef CAS PubMed.
- B. Bhushan, P. Dubey, S. Uday Kumar, A. Sachdev, I. Matai and P. Gopinath, RSC Adv., 2015, 5, 12078–12086 RSC.
- F. H. Wang, D. R. Zhang, C. X. Duan, L. J. Jia, F. F. Feng, Y. Liu, Y. C. Wang, L. L. Hao and Q. Zhang, Carbohydr. Polym., 2011, 84, 1192–1200 CrossRef CAS PubMed.
- A. Gabizon, A. T. Horowitz, D. Goren, D. Tzemach, F. Mandelbaum-Shavit, M. M. Qazen and S. Zalipsky, Bioconjugate Chem., 1999, 10, 289–298 CrossRef CAS PubMed.
- Y. J. Lu and P. S. Low, Adv. Drug Delivery Rev., 2002, 54, 675–693 CrossRef CAS.
- C. P. Leamon and P. S. Low, Proc. Natl. Acad. Sci. U. S. A., 1991, 88, 5572–5576 CrossRef CAS.
- J. Sudimack and R. J. Lee, Adv. Drug Delivery Rev., 2000, 41, 147–162 CrossRef CAS.
- R. J. Lee and P. S. Low, Biochim. Biophys. Acta, 1995, 1233, 134–144 CrossRef.
- C. M. Paulos, M. J. Turk, G. J. Breur and P. S. Low, Adv. Drug Delivery Rev., 2004, 56, 1205–1217 CrossRef CAS PubMed.
- C. P. Leamon and J. A. Reddy, Adv. Drug Delivery Rev., 2004, 56, 1127–1141 CrossRef CAS PubMed.
- H. Chen, S. Li, B. Li, X. Ren, D. M. Mahounga, S. Cui, Y. Gu and S. Achilefu, Nanoscale, 2012, 4, 6050–6064 RSC.
- M. Z. Fahmi, K. L. Ou, J. K. Chen, M. H. Ho, S. H. Tzing and J. Y. Chang, RSC Adv., 2014, 4, 32762–32772 RSC.
- H. Hao, Q. Ma, F. He and P. Yao, J. Mater. Chem. B, 2014, 2, 7978–7987 RSC.
- H. Meng, J. Y. Chen, L. Mi, P. N. Wang, M. Y. Ge, Y. Yue and N. Dai, JBIC, J. Biol. Inorg. Chem., 2011, 16, 117–123 CrossRef CAS PubMed.
- C. Du, D. Deng, L. Shan, S. Wan, J. Cao, J. Tian, S. Achilefu and Y. Gu, Biomaterials, 2013, 34, 3087–3097 CrossRef CAS PubMed.
- J. Li, R. Cai, N. Kawazoe and G. Chen, J. Mater. Chem. B, 2015, 3, 5806–5814 RSC.
- R. Yang, Y. An, F. Miao, M. Li, P. Liu and Q. Tang, Int. J. Nanomed., 2014, 4, 4231–4243 CrossRef PubMed.
- Q. F. Lin, S. F. Leung, K. H. Tsui, B. Hua and Z. Y. Fan, Nanoscale Res. Lett., 2013, 8, 170 CrossRef PubMed.
- L. Qi, Y. Guo, J. Luan, D. Zhang, Z. Zhao and Y. Luan, J. Mater. Chem. B, 2014, 2, 8361–8371 RSC.
- C. Su, H. Li, Y. Shi, G. Wang, L. Liu, L. Zhao and R. Su, Int. J. Pharm., 2014, 474, 202–211 CrossRef CAS PubMed.
- A. Martinez, E. Muniz, C. Teijon, I. Iglesias, J. M. Teijon and M. D. Blanco, Pharm. Res., 2014, 31, 1264–1274 CrossRef CAS PubMed.
- A. Gebregeorgis, C. Bhan, O. Wilson and D. Raghavan, J. Colloid Interface Sci., 2013, 389, 31–41 CrossRef CAS PubMed.
- D. Zhang and H. Yang, Appl. Phys. A, 2013, 112, 739–745 CrossRef CAS.
- S. Sharma, S. Chockalingam, P. Sanpui, A. Chattopadhyay and S. S. Ghosh, Adv. Healthcare Mater., 2014, 3, 106 CrossRef CAS PubMed.
- M. G. El-Wahed, M. S. Refat and S. M. El-Megharbel, Spectrochim. Acta, Part A, 2008, 70, 916–922 CrossRef PubMed.
- A. Ray Chowdhuri, S. Tripathy, C. Haldar, S. Chandra, B. Das, S. Roy and S. K. Sahu, RSC Adv., 2015, 5, 21515–21524 RSC.
- A. Mewada, S. Pandey, M. Thakur, D. Jadhav and M. Sharon, J. Mater. Chem. B, 2014, 2, 698–705 RSC.
- S. U. Kumar, I. Matai, P. Dubey, B. Bhushan, A. Sachdev and P. Gopinath, RSC Adv., 2014, 4, 38263–38272 RSC.
- S. Rello, J. C. Stockert, V. Moreno, A. G’amez, M. Pacheco, A. Juarranz, M. Canete and A. Villanueva, Apoptosis, 2005, 10, 201–208 CrossRef CAS PubMed.
- S. Allen, J. Sotos, M. J. Sylte and C. J. Czuprynski, Clin. Diagn. Lab. Immunol., 2001, 8, 460–464 CAS.
- S. S. Wang and P. S. Low, J. Controlled Release, 1998, 53, 39–48 CrossRef CAS.
- Y. H. Lee, F. Y. Cheng, H. W. Chiu, J. C. Tsai, C. Y. Fang, C. W. Chen and Y. J. Wang, Biomaterials, 2014, 35, 4706–4715 CrossRef CAS PubMed.
- P. Chairuangkitti, S. Lawanprasert, S. Roytrakul, S. Aueviriyavit, D. Phummiratch, K. Kulthong, P. Chanvorachote and R. Maniratanachote, Toxicol. In Vitro, 2013, 27, 330–338 CrossRef CAS PubMed.
- C. Riccardi and I. Nicoletti, Nat. Protoc., 2006, 1, 1458–1461 CrossRef CAS PubMed.
- Z. Darzynkiewicz, S. Bruno, B. G. Del, W. Gorczyca, M. A. Hotz, P. Lassota and F. Traganos, Cytometry, 1992, 13, 795–808 CrossRef CAS PubMed.
- A. J. Minn, P. Vélez, S. L. Schendel, H. Liang, S. W. Muchmore, S. W. Fesik, M. C. Fill and B. Thompson, Nature, 1997, 385, 353–357 CrossRef CAS PubMed.
- E. H. Yang, J. Zha, J. Jockel, L. B. Boise, C. B. Thompson and S. J. Korsmeyer, Cell, 1995, 80, 285–291 CrossRef CAS.
- L. H. Boise, M. Gonzalez-Garcia, C. E. Postema, L. Ding, T. Lindsten, L. A. Turka, X. Mao, G. Nunez and C. B. Thompson, Cell, 1993, 74, 597–608 CrossRef CAS.
- K. G. Wolter, Y. Hsu, C. L. Smith, A. Nechushtan, X. Xi and R. J. J. Youle, Cell Biol., 1997, 139, 1281–1292 CrossRef CAS.
- X. Liu, C. N. Kim, J. Yang, R. Jemmerson and X. Wang, Cell, 1996, 86, 147–157 CrossRef CAS.
- M. O. Hengartner, Nature, 2000, 407, 770–776 CrossRef CAS PubMed.
- S. L. Fink and B. T. Cookson, Infect. Immun., 2005, 73, 1907–1916 CrossRef CAS PubMed.
Footnote |
| † Electronic supplementary information (ESI) available. See DOI: 10.1039/c5ra16936d |
|
| This journal is © The Royal Society of Chemistry 2015 |
Click here to see how this site uses Cookies. View our privacy policy here. ![[thin space (1/6-em)]](https://www.rsc.org/images/entities/char_2009.gif) 000 cells per sample and acquired data were analyzed through Amnis Ideas software.
000 cells per sample and acquired data were analyzed through Amnis Ideas software.
![[thin space (1/6-em)]](https://www.rsc.org/images/entities/char_2009.gif) 000 events per sample were captured and analyzed through IDEAS software.
000 events per sample were captured and analyzed through IDEAS software.


