
Self-delivery nanoparticles from an amphiphilic covalent drug couple of irinotecan and bendamustine for cancer combination chemotherapy†
Ping Huanga,
Minxi Hua,
Linzhu Zhoua,
Yao Wanga,
Yan Panga,
Gangsheng Tongb,
Wei Huang*a,
Yue Sua and
Xinyuan Zhua
aSchool of Chemistry and Chemical Engineering, State Key Laboratory of Metal Matrix Composites, Shanghai Jiao Tong University, 800 Dongchuan Road, Shanghai 200240, P. R. China. E-mail: hw66@sjtu.edu.cn
bInstrumental Analysis Center, Shanghai Jiao Tong University, 800 Dongchuan Road, Shanghai 200240, P. R. China
First published on 6th October 2015
Abstract
Over the past several decades, combination cancer chemotherapy has attracted scientists' extensive concern. Herein we constructed a drug self-delivery system with 100% drug content for combined cancer chemotherapy. In detail, the hydrophilic anticancer drug irinotecan (Ir) was directly coupled with the hydrophobic anticancer drug bendamustine (Bd) by esterification to form an amphiphilic covalent drug couple (Ir–Bd). Due to the amphiphilic property, Ir–Bd can self-assemble into nanoparticles (NPs) in water with an average diameter around 90.8 nm. Ir–Bd NPs show longer blood retention half-lifes, facilitate the accumulation of drugs in tumor tissues and promote cellular uptake comparing with free Bd or Ir. Benefiting from nanoscale characterizations, they can be efficiently uptaken by tumor cells to realize the self-delivery of both anticancer drugs without any carriers. Under the influence of the acidic environment within tumor cells, the ester bond between Ir and Bd is cleaved by hydrolyzation to release both free drugs of Ir and Bd simultaneously, which shows a marked synergistic action against tumor cells compared to that of single free Ir or Bd because of the non-overlapping toxicity profile of Ir and Bd. In addition, the multidrug resistance (MDR) of tumor cells can also be avoided efficiently by profiting from the nanoscale characteristic of Ir–Bd NPs.
1. Introduction
Cancer has become a worldwide devastating disease, which results in over eight million deaths each year.1 Currently, chemotherapy is still considered one of the main treatments. Although hundreds of small molecular anticancer drugs have been used widely in clinical, the conventional single chemotherapeutic drug usually exhibits a lack of a high efficacy and MDR after repeated treatments because of the complexity and heterogeneity of various tumors.2–4 Therefore, combined chemotherapy has been developed and used in clinical in order to overcome the limitations associated with the monochemotherapy.5–7 However, the traditional combined chemotherapy via simply mixing various small molecular anticancer drugs often presents a limited synergistic efficacy because of their inherent problems, including low bioavailability, minimal biodistribution, rapid blood/renal clearance, and undesirable side effects. To address the challenge, thousands of nanoscale drug delivery systems,8–10 including liposomes,11–14 dendrimers,15 micelles,16–18 polymer NPs,19–27 and inorganic NPs,28–33 have been used for cancer combined therapy. Compared to the delivery of a single anticancer drug, the co-delivery of several drugs by nanocarriers to the same tumor cells in vitro and in vivo has shown a marked synergistic effect and a suppression of MDR. For example, Nguyen and co-workers34 delivered DOX and cisplatin together to cancer cells by using a polymer–lipid hybrid nanoparticle. The evaluation results showed that the high synergistic therapeutic efficacy was achieved. Jing et al.35 prepared a kind of composite micelle containing cisplatin and paclitaxel through the co-assembling of two different polymer–drug conjugates. These composite micelles displayed a synergistic effect to inhibit the proliferation of cancer cells in vitro. Li and co-workers36 reported a type of pH-sensitive polymeric micelles to co-deliver a P-gp inhibitor and DOX, which revealed a significant inhibition effect on the growth of drug-resistant cancer cells in vitro and in vivo. In despite of the above-mentioned advantages, there are several unpredictable drawbacks existing in combined therapy by using nanocarriers, such as (1) the drug loading content is low, (2) the side effect is caused by nanocarriers, (3) most nanocarriers are hardly approved by the Food and Drug Administration (FDA). Eventually most of them are difficult to be applied in clinical.In this work, we designed and synthesized an amphiphilic drug couple composed of small molecular anticancer drugs Ir and Bd. Ir is a hydrophilic derivate of camptothecin and can kill cancer cells via binding to DNA topoisomerase I and preventing DNA religation.37,38 Furthermore, Bd is a promising hydrophobic alkylating agent to treat various cancers.39,40 As described in Scheme 1, the hydrophilic Ir and the hydrophobic Bd were coupled via an ester bond to form Ir–Bd. We expect it can self-assemble into NPs in water with 100% drug loading content on the basis of its amphiphilic characteristics and Ir–Bd NPs enter cancer cells by endocytosis without any drug carriers. Under the acidic microenvironment of cancer cells, the ester bond between Ir and Bd is cleaved by hydrolysis to release free Ir and Bd simultaneously to kill cancer cells. In addition, the MDR of tumor cells would be circumvented too on the benefit of the nanoscale characteristics of Ir–Bd NPs and finally the synergistic chemotherapeutic effect is achieved.
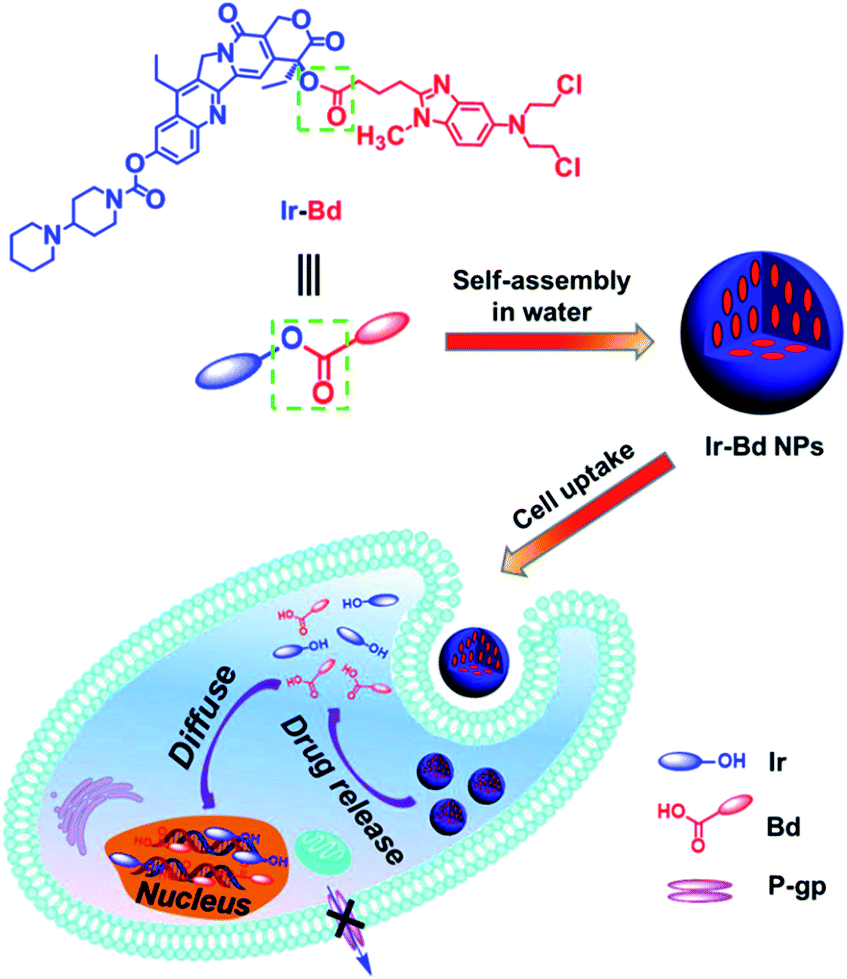 | ||
| Scheme 1 Schematic illustration of the chemical structure of amphiphilic covalent drug couple (Ir–Bd); self-assembly of Ir–Bd into NPs; Ir–Bd NPs enter tumor cells by endocytosis; Ir and Bd are released via ester bond hydrolysis in tumor cells and then diffuse into nucleus. | ||
2. Instruments and measurements
2.1 Nuclear magnetic resonance (NMR)
1H and 13C NMR spectra were recorded on a Varian Mercury Plus 400 MHz spectrometer with deuterium chloroform (CDCl3) as a solvent.2.2 Dynamic light scattering (DLS)
DLS measurements were performed on a Malvern Zetasizer 3000 HS (Malvern Instruments, Ltd) equipped with a 125 mW laser light and operated at λ = 633 nm. All samples were measured at a scattering angle of 90°.2.3 Transmission electron microscopy (TEM)
TEM studies were performed with a JEOL 2010 instrument at 120 kV. A little of sample solution (0.5 mg mL−1) was sprayed onto the carbon-coated copper grid. Then, the grid was immersed into liquid nitrogen and frozen-dried in vacuum at −50 °C before measurement.2.4 Ultraviolet-visible (UV-Vis) absorption spectrum
UV-Vis absorption spectra of the sample solutions were measured at room temperature by using a Thermo Electron-EV300 UV-Vis spectrophotometer. The slit-width was set as 1 nm with a scan speed of 480 nm min−1.2.5 Fluorescent spectrum
Fluorescent spectra were recorded on QC-4-CW spectrometer, made by Photon technology international, Int. USA/CAN. The excitation wavelength was set at 360 nm, which was chosen according to the maximum intensity obtained in the excitation spectra. Step increment was set as 2 nm, and scan speed was set at 480 nm min−1.2.6 Liquid chromatography-mass spectrometry (LC-MS)
LC-MS was performed on a Water ACQUITY UPLC system equipped with a binary solvent delivery manager and a sample manager, coupled with a Waters Q-TOF Premier Mass Spectrometer equipped with an electrospray interface (Waters Corporation, Milford, MA). An Acquity BEH C18 (100 mm × 2.1 mm i.d., 1.7 m, Waters, Milford, USA) analytical column was used and equipped with an ACQUITY UPLC BEH C18 (1.7 m) Vanguard precolumn.3. Experimental section
3.1 Materials
N,N′-Dicyclohexylcarbodiimide (DCC, 99%, J&K), 4-(dimethylamino)pyridine (DMAP, 99%, J&K), and 3-(4,5-dimethylthiazol-2-yl)-2,5-diphenyl tetrazolium bromide (MTT, 98%, Sigma) were used as received without further purification. Bendamustine hydrochloride (Bd·HCl) was purchased from Xi'an Zijingtang Company. Irinotecan (Ir) was obtained from Shanghai Knowshine Pharmachemical Inc. Alexa Fluor® 488 annexin V/dead cell apoptosis assay kit was purchased from Invitrogen and used as received. Dialysis bag (MWCO, 1000 g mol−1) was purchased from Shanghai Lvniao Technology Co. Ltd. Dichloromethane (CH2Cl2), chloroform (CHCl3) and triethylamine (TEA) was dried over calcium hydride (CaH2) and distilled just before use. All other reagents and solvents were purchased from the domestic suppliers and used as received.3.2 Synthesis of Ir–Bd
Bd·HCl (592 mg, 1.5 mmol), TEA (0.22 mL, 1.5 mmol) and DCC (412 mg, 2 mmol) were dissolved in dried CHCl3 (30 mL), and the mixture was stirred at 0 °C. After 30 min, Ir (750 mg, 1.5 mmol) and DMAP (122 mg, 1 mmol) in 30 mL CHCl3 were added and stirred for 48 h at room temperature in the dark. Then the reaction mixture was filtered to remove white solid (dicyclohexylurea) and the filtrate was concentrated under vacuum. The crude product was purified by column chromatograph using dichloromethane/methanol (CH2Cl2![[thin space (1/6-em)]](https://www.rsc.org/images/entities/char_2009.gif) :CH3OH, 10:1, v/v) as the eluent. The product was collected and the solvent was removed by rotary evaporation to give a yellow solid (956 mg, 69%). 1H NMR (400 MHz, CDCl3) δ (ppm): 8.15–8.13 (d, J = 9.2 Hz, 1H), 7.83–7.82 (d, J = 2.4 Hz, 1H), 7.59–7.56 (dd, J = 2.4 Hz, J = 2.4 Hz, 1H), 7.16 (s, 1H), 7.14–7.12 (d, J = 8.8 Hz, 1H), 7.07–7.06 (d, J = 2.4 Hz, 1H), 6.76–6.76 (dd, J = 2.4 Hz, J = 2.4 Hz, 1H), 5.71–5.67 (d, J = 17.2 Hz, 1H), 5.43–5.38 (d, J = 17.2 Hz, 1H), 5.23 (s, 2H), 4.45–4.32 (dd, J = 13.6 Hz, J = 12.8 Hz, 2H), 3.72–3.68 (m, 3H), 3.63–3.59 (m, 8H), 3.17–3.11 (m, 4H), 3.09–3.02 (t, J = 25.2 Hz, 1H), 2.94–2.90 (t, J = 14.8 Hz, 2H), 2.73–2.64 (m, 2H), 2.556 (s, 4H), 2.29–2.20 (m, 2H), 2.17–2.08 (m, 2H), 1.93 (s, 2H), 1.65–1.59 (m, 8H), 1.40–1.36 (t, J = 15.6 Hz, 3H), 0.98–0.94 (t, J = 14.8 Hz, 3H). 13C NMR (100 MHz, CDCl3) δ (ppm): 172.48, 167.93, 157.53, 154.69, 153.18, 151.58, 150.51, 147.14, 146.27, 145.64, 143.85, 142.68, 131.70, 129.77, 127.71, 127.30, 126.12, 119.89, 114.83, 110.29, 109.96, 103.42, 96.06, 76.22, 67.28, 62.94, 54.98, 50.35, 49.51, 44.20, 43.85, 41.09, 33.16, 31.89, 29.90, 27.73, 27.04, 26.13, 25.06, 23.95, 23.37, 22.60, 14.23, 7.83. ESI-MS m/z (M + H+) calcd 926.3858, found 926.3878 (M + H+).
:CH3OH, 10:1, v/v) as the eluent. The product was collected and the solvent was removed by rotary evaporation to give a yellow solid (956 mg, 69%). 1H NMR (400 MHz, CDCl3) δ (ppm): 8.15–8.13 (d, J = 9.2 Hz, 1H), 7.83–7.82 (d, J = 2.4 Hz, 1H), 7.59–7.56 (dd, J = 2.4 Hz, J = 2.4 Hz, 1H), 7.16 (s, 1H), 7.14–7.12 (d, J = 8.8 Hz, 1H), 7.07–7.06 (d, J = 2.4 Hz, 1H), 6.76–6.76 (dd, J = 2.4 Hz, J = 2.4 Hz, 1H), 5.71–5.67 (d, J = 17.2 Hz, 1H), 5.43–5.38 (d, J = 17.2 Hz, 1H), 5.23 (s, 2H), 4.45–4.32 (dd, J = 13.6 Hz, J = 12.8 Hz, 2H), 3.72–3.68 (m, 3H), 3.63–3.59 (m, 8H), 3.17–3.11 (m, 4H), 3.09–3.02 (t, J = 25.2 Hz, 1H), 2.94–2.90 (t, J = 14.8 Hz, 2H), 2.73–2.64 (m, 2H), 2.556 (s, 4H), 2.29–2.20 (m, 2H), 2.17–2.08 (m, 2H), 1.93 (s, 2H), 1.65–1.59 (m, 8H), 1.40–1.36 (t, J = 15.6 Hz, 3H), 0.98–0.94 (t, J = 14.8 Hz, 3H). 13C NMR (100 MHz, CDCl3) δ (ppm): 172.48, 167.93, 157.53, 154.69, 153.18, 151.58, 150.51, 147.14, 146.27, 145.64, 143.85, 142.68, 131.70, 129.77, 127.71, 127.30, 126.12, 119.89, 114.83, 110.29, 109.96, 103.42, 96.06, 76.22, 67.28, 62.94, 54.98, 50.35, 49.51, 44.20, 43.85, 41.09, 33.16, 31.89, 29.90, 27.73, 27.04, 26.13, 25.06, 23.95, 23.37, 22.60, 14.23, 7.83. ESI-MS m/z (M + H+) calcd 926.3858, found 926.3878 (M + H+).
3.3 Preparation of Ir–Bd NPs
Ir–Bd NPs were prepared by using the dialysis method with a dialysis bag (MWCO = 1000). In brief, 6 mg Ir–Bd was dissolved in 0.2 mL of dimethylsulfoxide (DMSO) and stirred at room temperature for 5 min. Then, 8 mL of deionized water was momentarily added into the above solution under the vigorous stirring and then kept stirring continuously for 5 min. Subsequently, the solution was transferred into the dialysis bag and dialyzed against deionized water for 8 h, during which the water was renewed every 2 h. The volume of the solution was increased to 12 mL by adding deionized water with a final concentration of 0.5 mg mL−1 for further experiments.3.4 Critical aggregation concentration (CAC) measurement
The CAC of Ir–Bd was measured by the dye solubilization method using 1,6-diphenyl-1,3,5-hexatriene (DPH) as a UV probe by monitoring the absorbance at 313 nm.41 The concentration of Ir–Bd was designed from 0.2 to 2.5 × 10⁻⁵ mg mL−1 and the finial concentration of DPH was set as 5.0 × 10⁻⁶ mol L−1. UV-Vis absorption spectra of all the solutions were recorded on Perkin-Elmer Lambda 20/2.0 UV/Vis spectrometer.3.5 In vitro drug release study
Typically, 2 mL of Ir–Bd NPs (0.5 mg mL−1) was transferred into a membrane tubing (MWCO = 1000), then incubated at 37 °C in 60 mL PBS (pH 7.4 or 5.0) containing (or not) esterase (5 mg, 30 U mL−1) and stirred slightly in the dark. At predetermined time intervals, the 3 mL of external buffer solution was withdraw and replaced with 3 mL of fresh PBS (pH 7.4 or 5.0) containing (or not) esterase (5 mg, 30 U mL−1). The amount of released Ir was determined by using fluorescence measurement (QC-4-CW spectrometer, excitation at 360 nm).3.6 Cell culture
HeLa cell (a human cervix carcinoma cell line), MCF-7 cell (a human breast adenocarcinoma cell line) and the cytokine-induced killer (CIK) cells were cultured in Dulbecco's Modified Eagle's medium (DMEM). The culture mediums contain 10% FBS heat-inactivated fetal bovine serum (FBS) (56 °C, 30 min) and antibiotics (50 units per mL penicillin and 50 units per mL streptomycin). Cells were cultured under a humidified atmosphere at 37 °C containing 5% CO2.3.7 In vitro degradation of Ir–Bd
HeLa cells were seeded in 6-well plates at 5.0 × 10⁵ cells per well in 2 mL of complete DMEM and allowed to attach for 24 h. The cells were treated with Ir–Bd NPs at a concentration of 20 μM for 6 h at 37 °C. Then, the culture medium was removed, and cells were washed for three times with cold phosphate buffer solution (PBS). After the last wash, 1 mL of methanol and cold PBS mixture (v/v, 1:1) was added to each well, and the cells were mechanically removed from the wells using a cell scraper. Then, the cells were transferred to a 15 mL polypropylene centrifuge tube. The tube was placed in thermostatic ice bath at 0 °C, and then sonicated the cell suspension with alternative cycles of 20 s pulses after every 10 s intervals for 10 min using ultrasonicator probe (Vibra cell 750). After sonication, the cell suspensions were centrifuged for 10 min at 4 °C and 1500 rpm. Then the supernatant was collected by centrifugation, evaporated and lyophilized. The obtained sample was dissolved in acetonitrile and centrifuged for 5 min at 5000 rpm. Finally, the supernatant was analyzed using LC-MS.
3.8 Cell internalization
The cellular uptake behaviours were observed by using HeLa cells on confocal laser scanning microscopy (CLSM). In brief, HeLa cells were seeded in 6-well plates at 2.0 × 10⁵ cells per well in 2 mL of complete DMEM and incubated overnight, followed by removing culture medium and adding Bd, Ir and Ir–Bd NPs solutions (0.5 mL DMEM medium) at the concentration of 20 μM. After incubation at 37 °C for 4 h, culture medium was removed, and cells were washed with PBS for two times. Subsequently, the cells were fixed with 4% formaldehyde for 30 min at room temperature, and the slides were rinsed with PBS three times. And then the cells were treated with 0.5% triton solution at 0 °C for 15 min. Subsequently, the cells were treated with 0.1 mg mL−1 RNAs at 37 °C for 20 min. Finally, 1 mL 2 μg mL−1 propidium iodide (PI) solution was added and the cells were cultured at 37 °C for 15 min. The slides were rinsed with cold PBS for three times. The resulting slides were mounted and observed with a LEICA TCS SP8 fluorescence microscopy.3.9 In vitro anticancer activity
The HeLa cells, MCF-7 cells and MCF-7/ADR cells were employed for evaluating the anticancer activity of Ir–Bd NPs. The cells were seeded into 96-well plates at 8 × 10³ cells per well in 200 μL of culture medium. After 24 h incubation, the medium was removed and replaced with 200 μL of a medium containing serial dilutions of Ir–Bd NPs, Ir, Bd, or Ir/Bd mixture from 0.1 to 50 μM for MCF-7 cells and the serials dilutions from 0.1 to 300 μM for MCF-7/ADR cells. The cells without the treatment were used as negative control. The cells were cultured for another 72 h. Then, 20 μL of 5 mg mL−1 MTT assay stock solution in PBS was added to each well. After the cells were incubated for 4 h, the medium containing unreacted MTT was carefully removed. Then, the obtained blue formazan crystals were dissolved in 200 μL per well DMSO, and the absorbance was measured in a BioTek Synergy H4 hybrid reader at a wavelength of 490 nm. The blank was subtracted to the measured optical density (OD) values, and the cell viability was expressed as % of the values obtained for the untreated control cells.3.10 Immunotoxicity study
The cytokine-induced killer (CIK) cells were used to assess the toxicity of Ir–Bd NPs. The cells were seeded into 96-well plates at 8 × 10³ cells per well in 200 μL of culture medium. After 12 h incubation, the cells were added with 50 μL medium containing serial dilutions of Ir–Bd NPs from 0.1 to 50 μM. The cells without the treatment were used as a control. The cells were grown for 72 h and then 20 μL CCK-8 solution was added to each well. Plates were incubated at 37 °C and 5% CO2 for another 3.5 h. The absorbance was measured in a BioTek Synergy H4 hybrid reader at a wavelength of 450 nm. The blank was subtracted to the measured optical density (OD) values, and the cell viability was expressed as % of the values obtained for the untreated control cells.3.11 The accumulation and efflux assay of Ir–Bd NPs
MCF-7 cells and MCF-7/ADR cells were seeded in 24-well (5 × 10⁴ cells per well) and allowed to incubate for 24 h. Then the cells were treated with Bd, Ir and Ir–Bd NPs for 1, 2 and 4 h at the same concentration (25 μM) at 37 °C. At the end of experiment, the cells were washed for three times with ice-cold PBS and trypsinized, resuspended in 500 μL PBS. Data for 1.0 × 10⁴ gated events were collected and analysis was performed by means of a BD LSRFortessa flow cytometer. The fluorescent intensity was calculated by CellQuest software, and untreated cells were used as control.For drug efflux assay, MCF-7 cells and MCF-7/ADR cells were first cultured with Bd, Ir and Ir–Bd NPs for 4 h. Then, the medium was removed and the cells were washed with cold PBS for twice, followed by incubation with fresh medium for various time. The amounts of Bd, Ir and Ir–Bd in cells were determined by BD LSRFortessa flow cytometer.
3.12 Cell apoptosis study
HeLa cells were seeded in 6-well plates at 5.0 × 10⁵ cells per well in 2 mL of complete DMEM and cultured for 24 h. The cells were treated with Ir, Bd, Ir/Bd mixture and Ir–Bd NPs at the same concentration (25 μM) for 24 h. HeLa cells without the treatment were used as a negative control. For quantitative measurement of apoptosis, treated cells were harvested and washed twice with ice-cold PBS, stained with Alexa Fluor® 488 annexin V and PI according to the manufacturer's instructions. Cell apoptosis was analyzed by flow cytometry (BD FACSCalibur, USA), and 1 × 10⁴ events per sample were counted.3.13 Caspase-3 activity assay
HeLa cells were seeded in 10 cm cell culture dishes at 3.0 × 10⁶ cells per well in 10 mL of complete DMEM and cultured for 18 h, followed by removing the culture medium and adding 10 mL solution of DMEM with Bd, Ir, Ir/Bd mixture, and Ir–Bd NPs at the same concentrations of 20 μM, respectively. HeLa cells without any treatment were used as control. After 18 h incubation, cells were rinsed by PBS twice. Then, 2 mL of cold PBS was added to each well, and then the cells were scraped and collected in centrifuge tube. The cell suspensions were centrifugated at 800 rpm for 5 min at 4 °C. Subsequently, the supernatants were removed. The cells were resuspended in 200 μL of cell lysis buffer and kept on ice for 30 min at 4 °C, the micro-centrifuge tubes were adopted for the centrifugation of lysates at 10000 rpm for 2 min at 4 °C. BCA protein assay was provided to test the content of protein in the supernatant and then adjusted the protein content of every sample to the same concentration. 70 μL of the protein solution was distributed to each well of a 96-well plate. Then, 50 μL of 2× reaction buffer (containing 10 mM DTT) and 5 μL of the DEVD-p NA caspase-3 substrate were added into each sample to ensure the final concentration (200 μM). Each sample sets three parallel tests. After incubating for 2 h at 37 °C, the protein activity was analyzed by monitoring the absorbance at 405 nm with BioTek Synergy H4. The caspase-3 protein activity was calculated as fold of the measured optical density (OD) values obtained from untreated control cells, and all the values of samples should subtract the OD value of the blank.
3.14 Animals and tumor models
Study protocols involving animals were approved by the Animal Ethics Committee of Shanghai Jiao Tong University School of Medicine. SD rats (∼200 g) and 72 Balb/c female nude mice (4 weeks of age) were supplied by Chinese Academy of Sciences (Shanghai). The female nude mice were injected subcutaneously in the right flank region with 100 μL cell suspension containing 6 × 10⁶ HeLa cells.3.15 Pharmacokinetics and biodistribution
For pharmacokinetic studies, SD rats (∼200 g) were randomly divided into Bd, Ir and Ir–Bd NPs groups (n = 4). The aqueous solutions of Bd, Ir and Ir–Bd NPs were intravenously injected via tail vein at a dose of 10 mg kg−1. The blood samples (0.5 mL) were taken from the eye socket at the 5 min, 1 h, 2 h, 4 h, 8 h, and 12 h time points after injection. The plasma was obtained by centrifugation at 3000 rpm for 10 min and stored at −20 °C. We treated 200 μL plasma two times with 200 μL acetonitrile and methanol mixture (1:1, v/v). The solvent solutions separated by centrifugation were pooled. The samples of Bd, Ir and Ir–Bd were directly examined by using fluorescence spectroscopy. The amounts of Bd, Ir and Ir–Bd, were obtained from standard curves previously obtained by analysis of blood samples containing known amounts of Bd, Ir and Ir–Bd.
To assess the tissue distribution of Bd, Ir and Ir–Bd NPs, the HeLa tumor-bearing mice were intravenously injected via tail vein with Bd, Ir and Ir–NPs at a dose of Bd (3.9 mg kg−1), Ir (6.3 mg kg−1) and Ir–Bd NPs (10 mg kg−1). Mice were sacrificed by cervical vertebra dislocation at 0.5 h, 3 h and 6 h after drug administration (n = 3 at each time point), and the heart, liver, spleen, lung, kidney and tumor were collected. Tissue samples were rinsed in saline, blotted using paper towel, weighed and stored at −80 °C before being homogenized. Bd, Ir and Ir–Bd were extracted from the homogenate using 2 mL dichloromethane and methanol (1:1, v/v). The organic phases were collected and dried, and the samples were dissolved in acetonitrile for analysis. The samples of Bd, Ir and Ir–Bd were directly examined by using fluorescence spectroscopy. The amounts of Bd, Ir and Ir–Bd were obtained from standard curves previously obtained by analysis of tissues samples containing known amounts of Bd, Ir and Ir–Bd.
4. Results and discussion
4.1 Synthesis and characterization of Ir–Bd
The amphiphilic drug couple Ir–Bd was synthesized by esterification at room temperature and its detailed synthetic route was shown in ESI Fig. S1.† The chemical structure of Ir–Bd was first characterized by 1H and 13C NMR spectra and the results were shown in Fig. 1. As a comparison, the 1H and 13C NMR spectra of Ir were also shown in Fig. 1. The peak at 4.17 ppm (a) attributed to hydroxyl proton of Ir disappears completely and the proton signal at 7.64 ppm (b) ascribed to the pyridone ring proton of Ir shifts to 7.16 ppm (b′) in the 1H NMR spectrum of Ir–Bd. In addition, all the signals attributed to the protons of Bd can be found in the 1H NMR spectrum of Ir–Bd (Fig. 1a). In Fig. 1b, the signal at 174.06 ppm (a) corresponding to –OCO– (lactonic ring) and 73.06 ppm (c) corresponding to HO–CCO– (lactonic ring) of Ir shift to 167.93 ppm (a′) and 76.22 ppm (c′) respectively in the 13C NMR spectrum of Ir–Bd. Moreover, the signal at 172.48 ppm (b) is ascribed to –OCOCH2CH2CH2– (carbonyl group) in the newborn ester bond of Ir–Bd after esterification.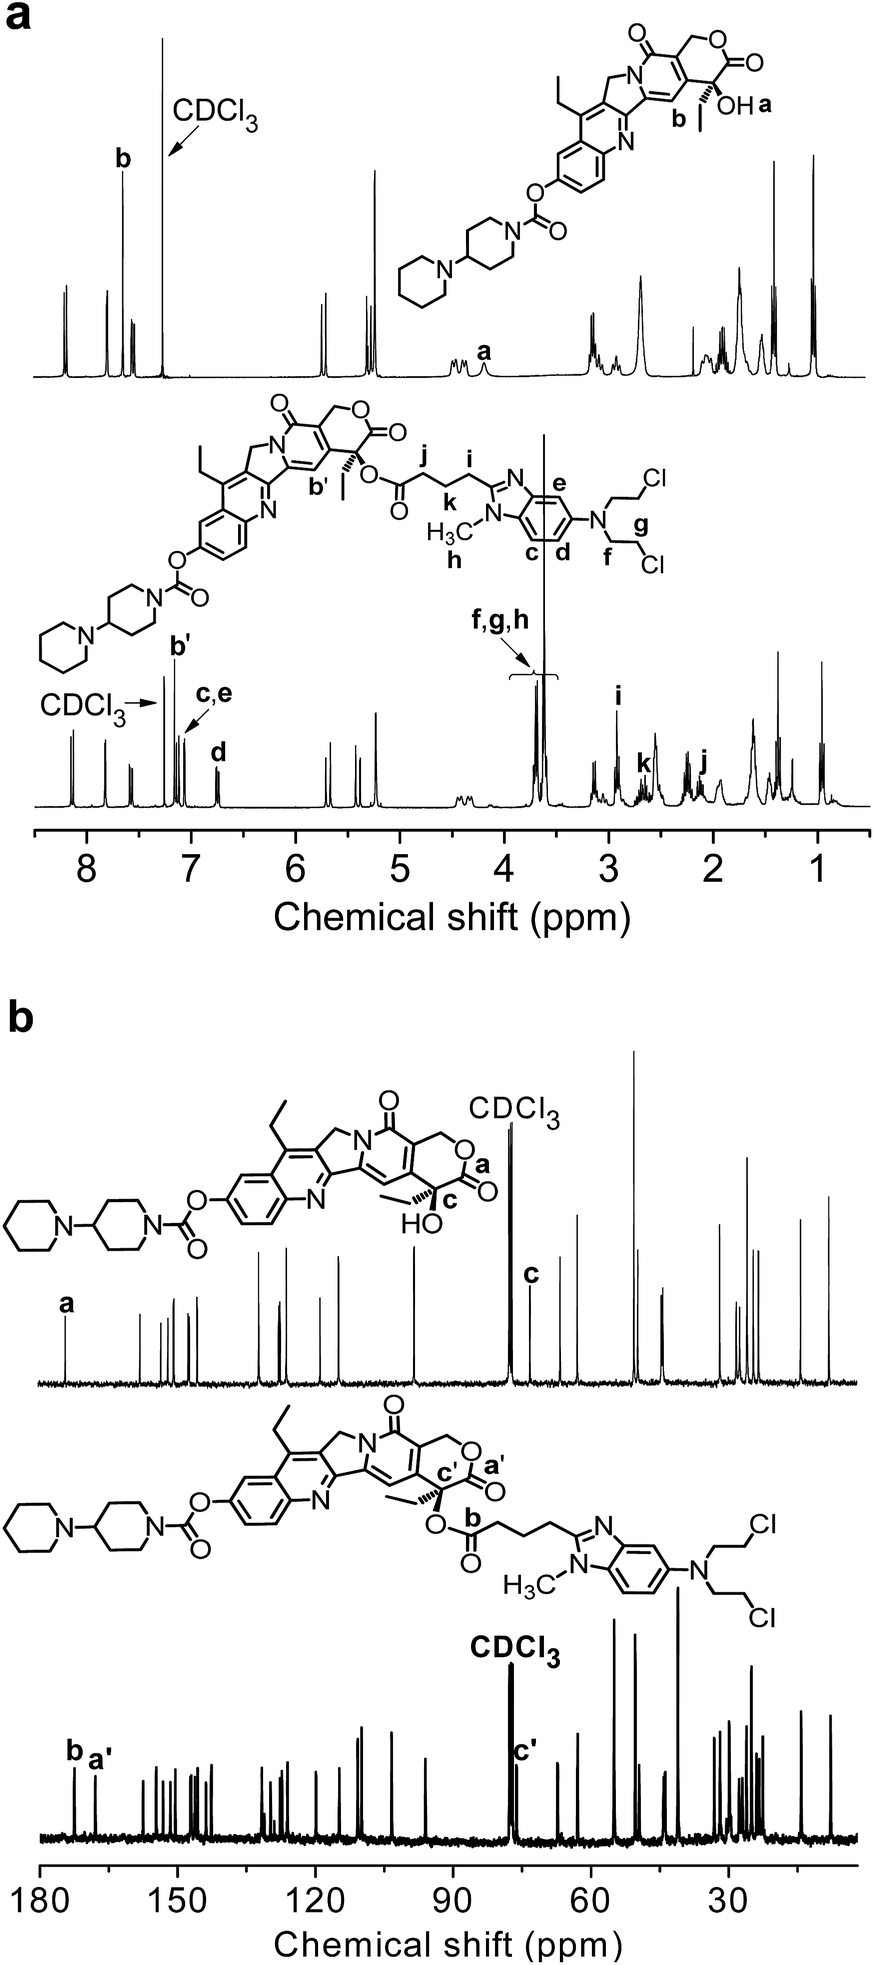 | ||
| Fig. 1 (a) 1H NMR and (b) 13C NMR spectra of Ir (top) and Ir–Bd (bottom) in CDCl3. | ||
The purity and molecular weight of Ir–Bd were further confirmed by LC-MS measurement and the results were shown in the Fig. 2. As shown in the Fig. 2a, LC profile gives only one retention time of Ir–Bd at 3.98 min, suggesting the high purity of Ir–Bd. And the MS spectrum in Fig. 2b shows that the molecular weight of Ir–Bd (m/z, M + H+) is 926.3878, which is consistent with the theoretically calculated value (m/z, M + H+, 926.3858). Ir–Bd was also characterized by UV-Vis spectrophotometer and fluorescence spectroscopy (Fig. S2 and S3a†). All experimental results confirm that Ir–Bd has been synthesized successfully.
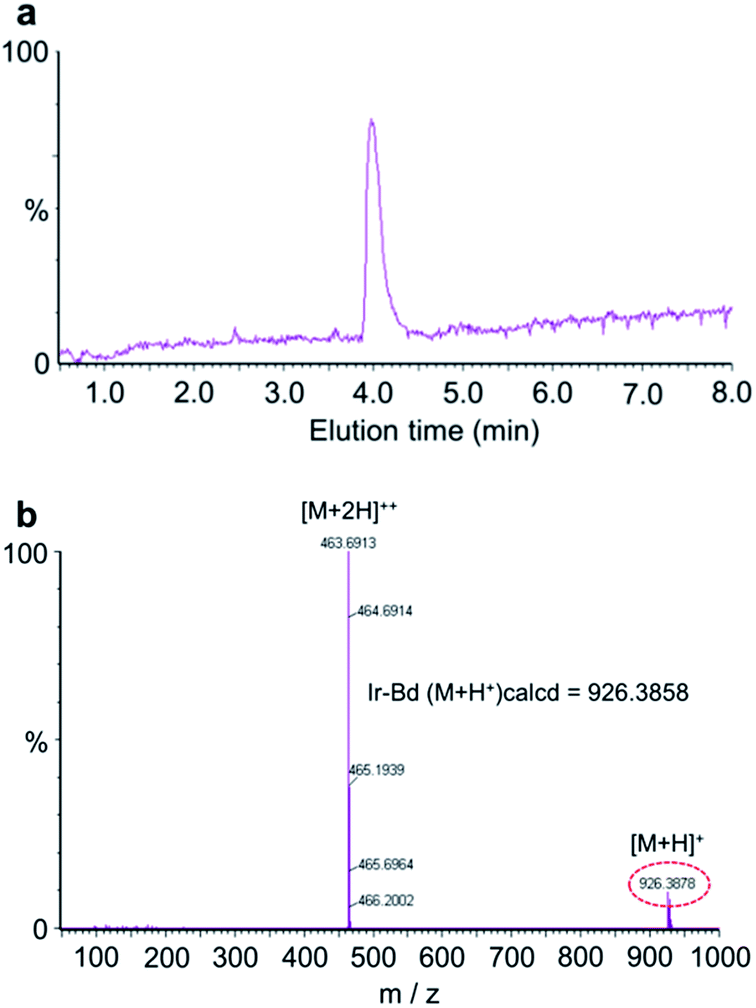 | ||
| Fig. 2 (a) LC profile and (b) mass spectrum of Ir–Bd. | ||
4.2 Preparation and characterization of Ir–Bd NPs
Due to the amphiphilic nature, Ir–Bd tends to self-assemble into NPs in aqueous solution. Ir–Bd NPs were prepared by addition of water rapidly into the DMSO solution of Ir–Bd, and then dialysed in water to remove DMSO. The size and morphology of Ir–Bd NPs were investigated by DLS and TEM measurements. The DLS curve in Fig. 3a shows the formation of Ir–Bd NPs with unimodal size distribution and an average hydrodynamic diameter of approximate 90.8 nm. Besides, the stability of Ir–Bd NPs was confirmed by DLS measurement at different time interval. The results demonstrate that Ir–Bd NPs are quite stable in aqueous solution for one month storage at least (Fig. S4†). The TEM image in Fig. 3b indicates that Ir–Bd self-assembles into spherical NPs with an average size of approximate 87.5 nm, which is in accord with the result determined by DLS.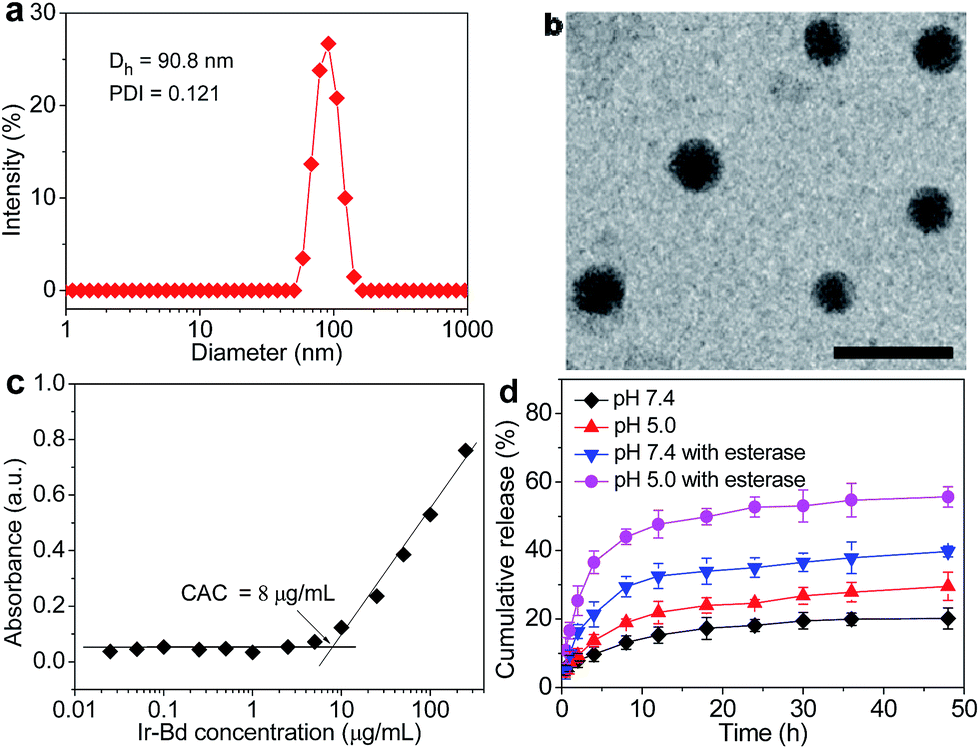 | ||
| Fig. 3 (a) DLS curve of Ir–Bd NPs shows the diameter distribution of the NPs, the polydispersity index (PDI = 0.121), and the average size (Dh = 90.8 nm). (b) TEM image of Ir–Bd NPs. Scale bars: 200 nm. (c) Variations of the absorbance of DPH at 313 nm with Ir–Bd concentration at 25 °C. (d) In vitro Ir release profiles from Ir–Bd NPs under different pH values (5.0 and 7.4) containing esterase (or not) at 37 °C. | ||
CAC is a key parameter to investigate the self-assembly process of amphiphilic Ir–Bd in water. It was measured employing the hydrophobic dye solubilization method. As depicted in Fig. 3c, the absorbance intensity of DPH is almost constant at the low concentration of Ir–Bd. With increasing the concentration of Ir–Bd, the absorbance at 313 increases dramatically reflecting the solubilization of dye in a hydrophobic domain of NPs. According to the intersecting of the two straight lines, the CAC value of Ir–Bd is about 8 μg mL−1.
4.3 In vitro drug release
The in vitro drug release behavior of Ir–Bd NPs was estimated by dialysis in PBS different pH (7.4 or 5.0) containing (or not) esterase (30 U mL−1) at 37 °C. The cumulative release curve of Ir under different condition is shown in Fig. 3d. At the pH value of 7.4 without esterase, only less than 20% drug is released within 48 h, which indicated that Ir–Bd NPs with high stability at physiological environment. However, at pH 5.0 without esterase, approximate 30% of Ir is released within the same period. It reveals that the ester bond is ready to hydrolyze at an acidic environment. In addition, the release rate and content of Ir are raised remarkably with the esterase under the physiological and acidic condition. Especially, amount of released drug is up to 56% under an acidic condition containing esterase, which is attributed to the esterase and acid simultaneously exerted on the ester bond between Ir and Bd.In order to determine whether Ir–Bd was converted into free Ir and Bd via the degradation of ester bond in live cells, HeLa cells were incubated with Ir–Bd NPs for 4 h and then LC-MS technique were used to monitor the cellular extracts. The mixed Ir and Bd was used as a control (Fig. S5†). The LC-MS results of cellular extra in Fig. S6† shows the existence of Ir and Bd after incubation with Ir–Bd NPs, which confirms the ester bond between hydrophilic anticancer drug and hydrophobic anticancer drug is hydrolyzed to release both free Ir and Bd after entering into tumor cells.
4.4 Cell internalization
The cellular uptake of Ir–Bd NPs by HeLa cells was monitored by using fluorescence microscopy to verify Ir–Bd NPs could effectively enter into cancer cells. The cellular uptake of free Bd and Ir was used as control. On the base of the intensive fluorescence of Bd and Ir, Ir–Bd NPs can also emit strong blue fluorescence so that they can be used as fluorescence probes for cell imaging (Fig. S3b†). HeLa cells were treated with Bd, Ir and Ir–Bd NPs for 4 h before observation. The cell nuclei were stained by employing PI as a red dye for 15 min. The CLSM results were shown in Fig. 4. It can be observed the existence of blue fluorescence from Bd, Ir and Ir–Bd NPs after 4 h incubation with HeLa cells, which indicate that Bd, Ir and Ir–Bd NPs can enter to tumor cells. On the other hand, the blue fluorescence of Ir–Bd NPs is obviously stronger than that of Bd and Ir, which indicates Ir–Bd NPs can be internalized by cells efficiently.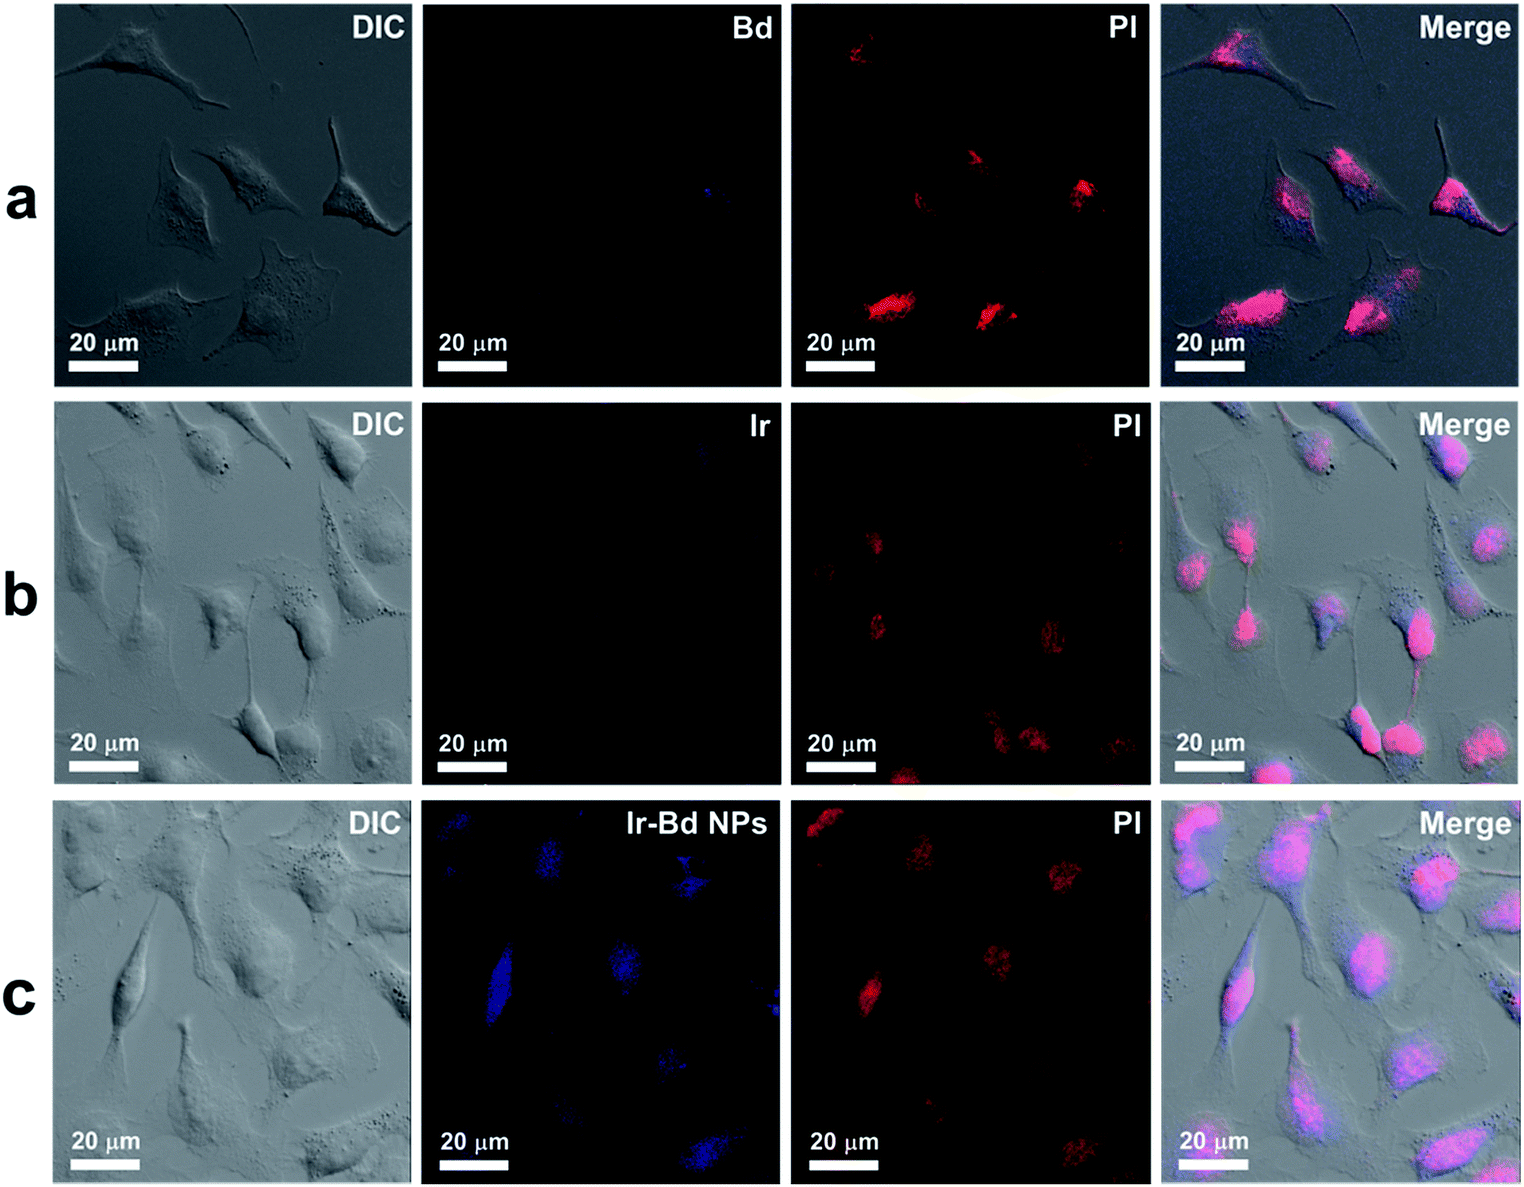 | ||
| Fig. 4 CLSM images of HeLa cells incubated with (a) Bd, (b) Ir and (c) Ir–Bd NPs for 4 h. Cells nuclei are stained with PI. | ||
4.5 Cytotoxicity and synergism assay
In order to evaluate the therapeutic effect of Ir–Bd NPs, the in vitro anticancer activity on HeLa cancer cells was tested by MTT assay and compared to Bd, Ir, and Ir/Bd mixture. The concentrations in the culture medium were varied from 0.1 to 50 μM for Ir–Bd NPs, Bd, Ir, and Ir/Bd mixture. The cells without any treatment were used as the control. As shown in Fig. 5a, the cell viability after treatment with Ir and Ir/Bd mixture is general the same but much lower than that treatment with free Bd. While the therapeutic effect of Ir–Bd NPs to cancer cells is higher than that of Ir and Ir/Bd mixture at higher concentration. The result may attribute to the nanoscale characteristics of Ir–Bd NPs. When the concentration of Ir–Bd is higher than the CAC value, it self-assembles into NPs. Ir–Bd NPs could accumulate in the tumor cells by cellular uptake, and the released free Ir and Bd might play a synergistic action.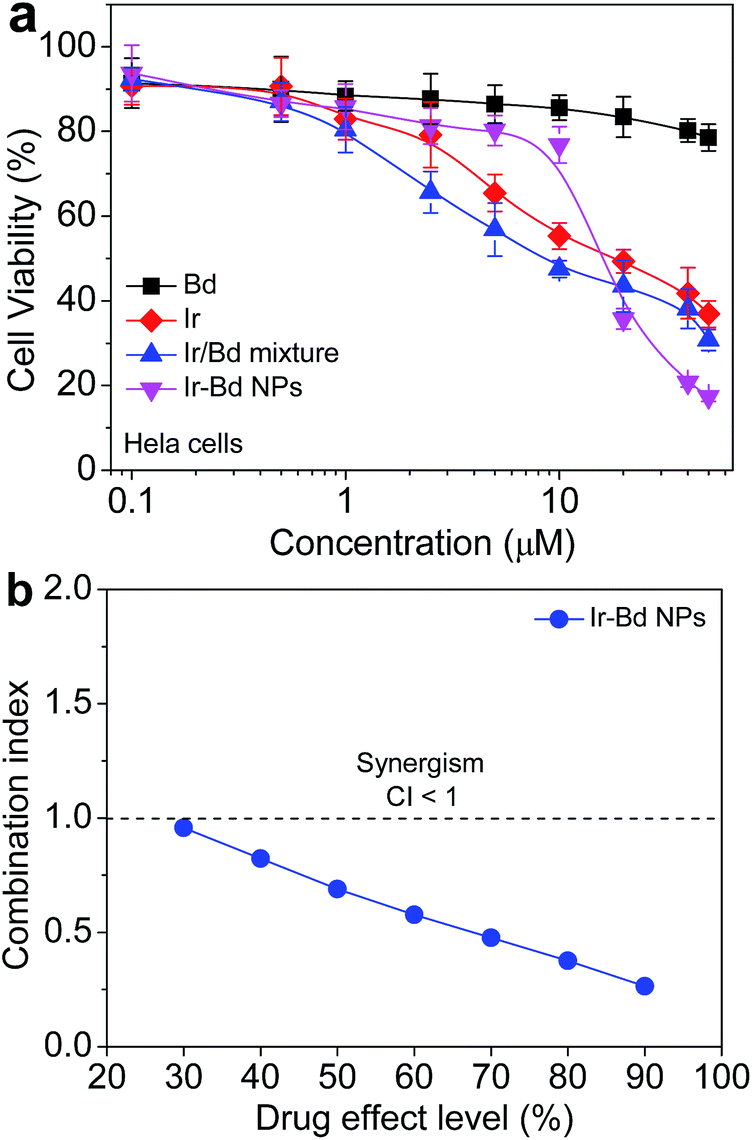 | ||
| Fig. 5 (a) Viability of HeLa cells incubated with Bd, Ir, Ir/Bd mixture, and Ir–Bd NPs measured by MTT assay and the cells without any treatment were used as control. The data are presented as average ± standard error (n = 6). (b) Combination index (CI) plots for Ir–Bd NPs against HeLa cells. | ||
To further verify drug synergistic effect of Ir–Bd NPs, the combination index (CI), which could supply quantitative information about the extent of drug interactions, is calculated from the following equation42,43
4.6 Multidrug resistance
The formation of multidrug resistance has become a major impediment to successful clinical treatment of cancers, whereby cancer cells can develop an ability to resist the cytotoxicity of anticancer drugs.44,45 The cancer cells with MDR can effuse various small molecular anticancer drugs out of themselves through drug transporters such as P-glycoprotein (P-gp), and leading to the intracellular drug level below the toxic concentration.46 Currently, anticancer agents in nanometer scale have emerged as a promising strategy to overcome MDR, because they can bypass the P-gp efflux pump and efficiently accumulate in tumor cells. Therefore, we investigated the accumulation and efflux assay of free Bd, Ir and Ir–Bd NPs with drug-resistant MCF-7/ADR cells and drug-sensitive MCF-7 cells. As a result of the high expression of P-gp, the accumulation of free Bd or Ir in MCF-7/ADR cells was extremely low even incubation for 4 h. However, Ir–Bd NPs could be internalized by the cells through the endocytic pathway and escaped from the effect of P-gp mediated drug efflux, which results in a significant cellular accumulation in MCF-7/ADR cells (Fig. 6a). Contrarily, the accumulation of the above drug formulations in MCF-7 cells is relatively high and increased with the incubation time extending (Fig. 6b).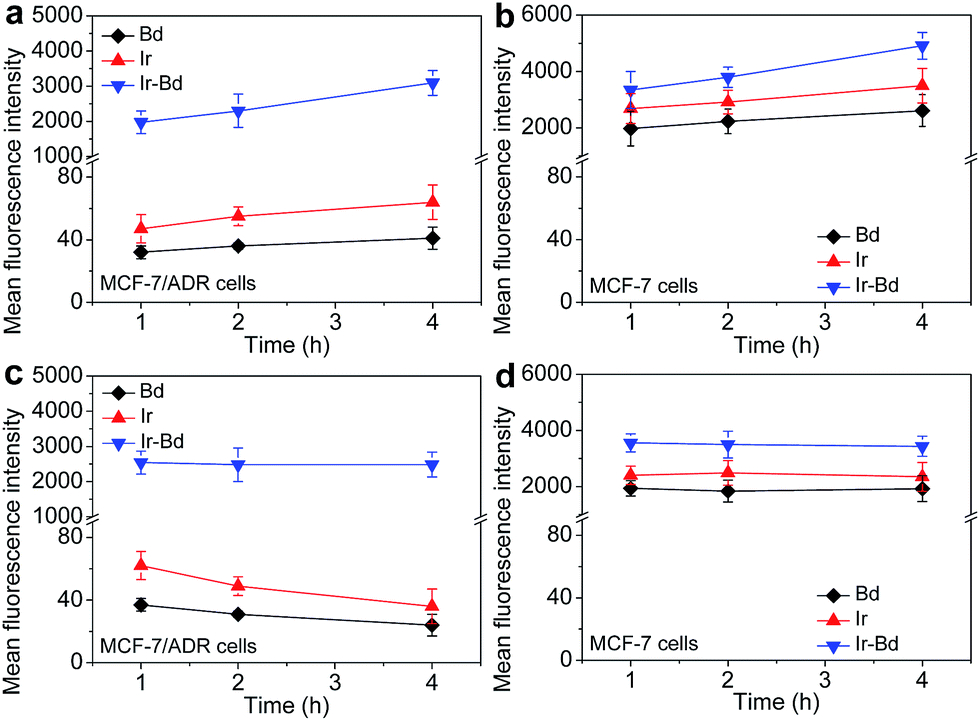 | ||
| Fig. 6 (a and b) The accumulation of Bd, Ir and Ir–Bd NPs in MCF-7/ADR cells (a) and MCF-7 cells (b) after incubation with Bd, Ir and Ir–Bd NPs for various times. (c and d) The efflux of Bd, Ir and Ir–Bd NPs from MCF-7/ADR cells (c) and MCF-7 cells (d). Cells were first treated with Bd, Ir and Ir–Bd NPs for 4 h, and then incubated with fresh medium for different time. The data are presented as average ± standard error (n = 3). | ||
For drug efflux assay, the cells were first incubated with Bd, Ir, or Ir–Bd NPs for 4 h respectively, then incubated with fresh medium for various time. As shown in Fig. 6c, the amount of Bd or Ir in MCF-7/ADR cells is very low and continuously decreased with the incubation time increased due to the effect of P-gp drug efflux mechanism. While the intracellular concentration of Ir–Bd in MCF-7/ADR cells is much higher and no obvious decrease is observed. In contrast, owing to the low expression of P-gp, the concentration of Bd and Ir in MCF-7 cells is remarkably higher than that in MCF-7/ADR cells and no significant changes within 4 h incubation. But the intracellular concentration of Ir–Bd NPs in MCF-7/ADR cells and MCF-7 cells is nearly the same (Fig. 6d).
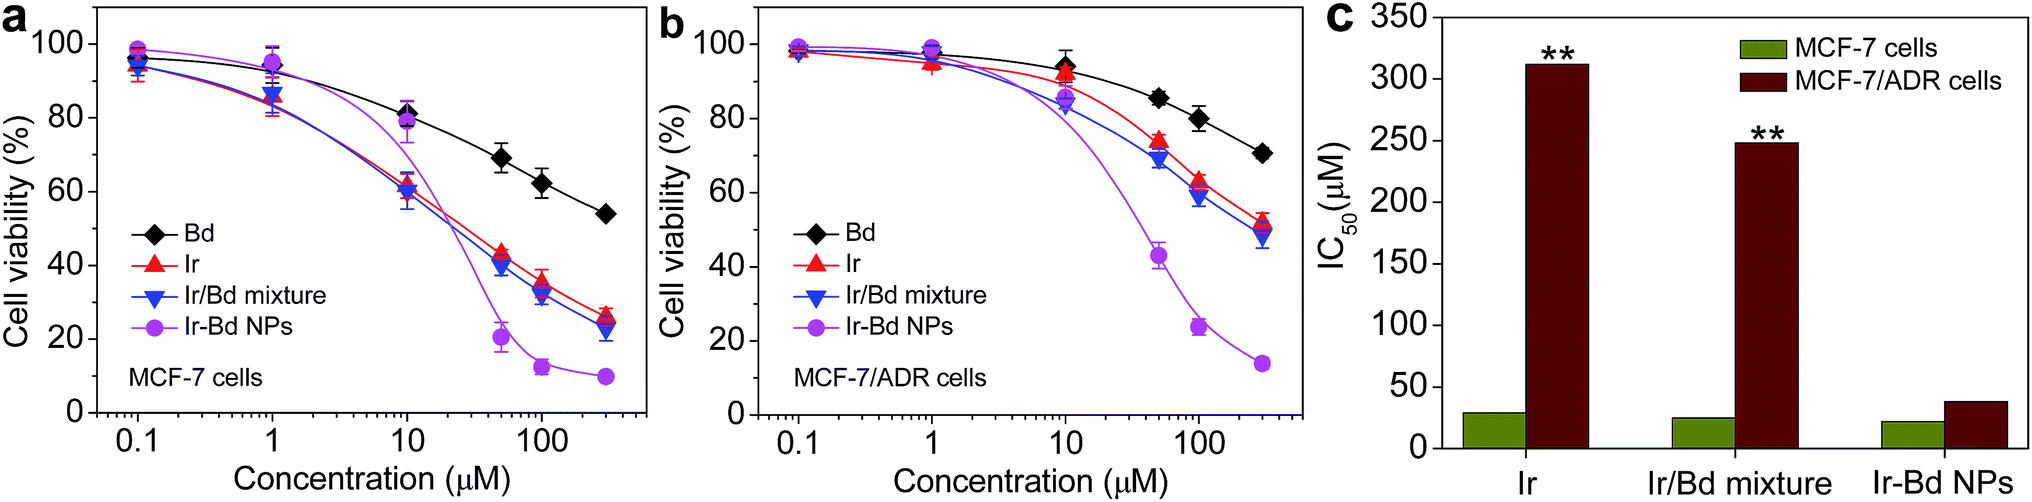
The multidrug combined chemosensitization has also considered as an efficient approach to overcome MDR.47 The synthesized Ir–Bd NPs consist of two different anticancer drugs. Hence, it is considered that Ir–Bd NPs would effectively circumvent the MDR of tumor cells by simultaneously releasing two drugs in cells via the hydrolysis of ester bond. To verify this hypothesis, the in vitro cytotoxicity of various different drug formulations was evaluated in sensitive MCF-7 cells and resistant MCF-7/ADR cells by MTT assay and the half maximal inhibitory concentration (IC50) values were calculated simultaneously. In MCF-7 cells, the cytotoxicity of Ir/Bd mixture is similar with that of free Ir, which is higher than that of free Bd but lower than that of Ir–Bd NPs when the concentration is higher than the CAC value of Ir–Bd (Fig. 7a). The result is similar to that of HeLa cells. However, in MCF-7/ADR cells, the cytotoxicity of Ir–Bd NPs is remarkable higher than of free Bd, Ir, and Ir/Bd mixture (Fig. 7b). The IC50 values of Ir and Ir/Bd mixture in MCF-7 cells are 28 μM and 25 μM, and in MCF-7/ADR cells are 312 μM and 248 μM, respectively. And the resistant indices of free Ir and Ir/Bd mixture are 11.14 and 9.92 (Fig. 7c). Interestingly, the IC50 of Ir–Bd NPs in MCF-7/ADR cells is significantly decrease to 38 μM and the resistant index is only 1.72 (Fig. 7c). These results demonstrate that Ir–Bd NPs could effectively reduce the MDR of MCF-7/ADR cells.
 | ||
| Fig. 7 (a and b) In vitro cell cytotoxicity of Bd, Ir, Ir/Bd mixture and Ir–Bd NPs to MCF-7 cells and MCF-7/ADR cells determined by MTT assay. The data are presented as average ± standard error (n = 6). (c) IC50 values of free Ir, Ir/Bd mixture, and Ir–Bd NPs in MCF-7 and MCF-7/ADR cells (**p < 0.01). | ||
4.7 Cell apoptosis assay and caspase-3 protein activity study
Generally, most small molecular chemotherapy drugs kill cancer cells by inducing cell apoptosis firstly. The FITC-Annexin V/PI apoptosis detection kit was used to confirm whether the death of cancer cells treating with Ir–Bd NPs was associated with apoptosis. HeLa cells were treated with Bd, Ir, Ir/Bd mixture, and Ir–Bd NPs for 24 h at the same concentration of 25 μM and then stained by FITC-Annexin V/PI. The untreated cells were used as control. Flow cytometry data show that the apoptotic percentage is 11.36%, 24.22%, 27.21%, and 53.28% induced by Bd, Ir, Ir/Bd mixture, and Ir–Bd NPs (Fig. 8a and b). The result demonstrates that Ir–Bd NPs can induce cell apoptosis efficiently and the apoptotic rate caused by Ir–Bd NPs is higher than that induced by other drug formulations at the same concentration.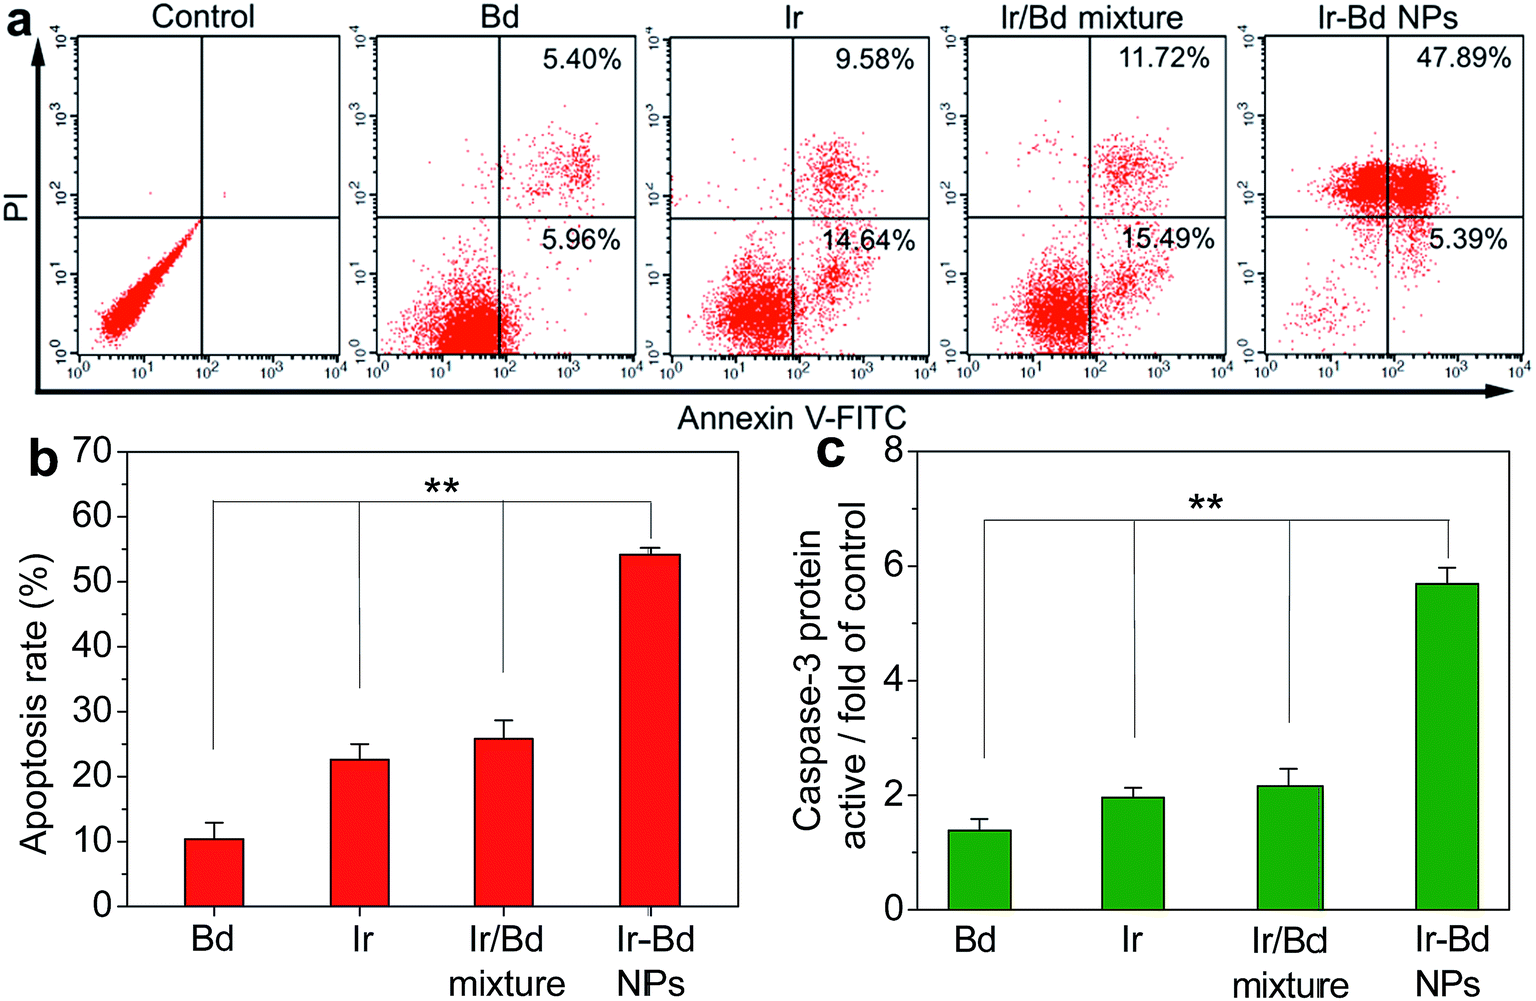 | ||
| Fig. 8 (a) Flow cytometric results for apoptosis of HeLa cells treated with Bd, Ir, Ir/Bd mixture and Ir–Bd NPs at the same concentration of 25 μM for 24 h. Lower left, living cells; lower right, early apoptotic cells; upper right, late apoptotic cells; upper left, necrotic cells. (b) Relationship of the ratio of apoptotic HeLa cells and various treatments based on the results of flow cytometry analysis. The data are presented as average ± standard error (n = 3) (**p < 0.01). (c) Caspase-3 protein activity in HeLa cells activated by Bd, Ir, Ir/Bd mixture and Ir–Bd NPs at the same concentrations of 25 μM for 18 h. Cells without any treatment were used as a control and the data are presented as average ± standard error (n = 3) (**p < 0.01). | ||
It is well known that caspase family plays a major action in apoptosis. Among them, caspase-3 has been thought as a key effector of cell apoptosis and the expression of caspase-3 could be up-regulated by activating with cytotoxic drugs.48,49 To know whether the caspase-3 was activated by Ir–Bd NPs, the protein expression of caspase-3 in HeLa cells was evaluated by using the substrate of Ac-DEVD-pNA. The cells were incubated with Bd, Ir, Ir/Bd mixture, and Ir–Bd NPs for 18 h at the same concentration of 25 μM and the cells without any treatment of drugs were used as control. As shown in Fig. 8c, the caspase-3 protein activity in HeLa cells increases slightly when treated with Bd, Ir, and Ir/Bd mixture and the caspase-3 protein activity only increases to 1.4-fold, 2.1-fold, 2.2-fold of the control cells, respectively. However, the caspase-3 protein activity in HeLa cells treated with Ir–Bd NPs remarkably increases up to 5.7-fold of control cells. The results confirm that Ir–Bd NP is the most effective form of drug to promote the activation of caspase-3 in HeLa cells comparing to others.
4.8 Blood retention time and biodistribution studies of Ir–Bd NPs
The pharmacokinetic study was undertaken by intravenous injection of Bd, Ir, and Ir–Bd NPs to Sprague-Dawley (SD) rats (∼200 g). The time profiles of Bd, Ir, and Ir–Bd NPs in plasma were shown in Fig. 9a. Ir–Bd NPs are still retained at higher concentration in the bloodstream for more than 12 h. On the contrary, free Bd or Ir is eliminated quickly from the blood circulation system after intravenous injection. On the same condition, the concentration of Bd or Ir is only 1/12 of that of Ir–Bd NPs in the bloodstream. The longer circulation time of Ir–Bd NPs facilitates the accumulation of drugs at the tumor tissue through the enhanced permeability and retention (EPR) effect.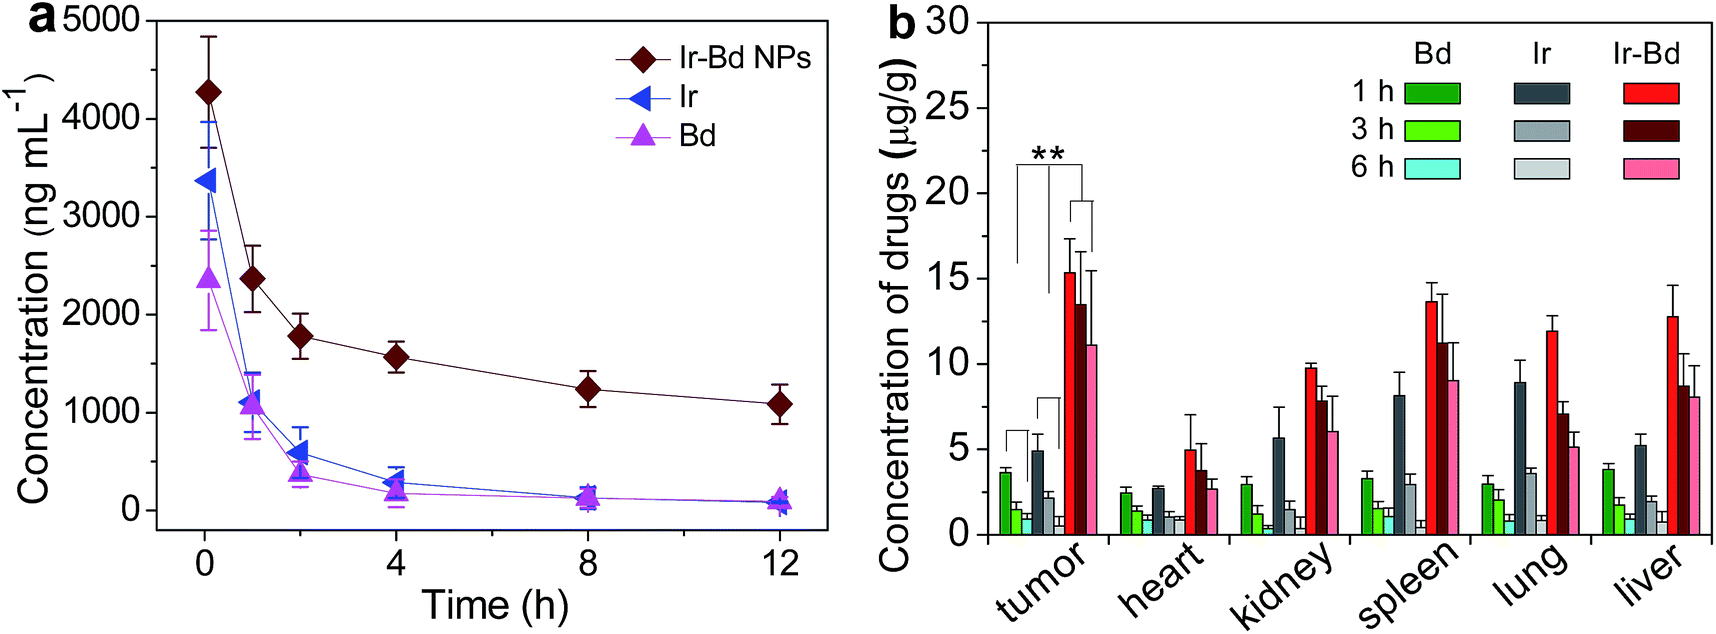 | ||
| Fig. 9 (a) Representative plasma concentration–time profiles of Bd, Ir, and Ir–Bd NPs after i.v. injection into rats (a dose of 10 mg kg−1). The data are presented as the average ± standard error (n = 4). (b) Tissue distribution of Bd, Ir, and Ir–Bd after intravenous injection of Bd (3.9 mg kg−1), Ir (6.3 mg kg−1), and Ir–Bd NPs (10 mg kg−1) in nude mice. Data are presented as average ± standard error (n = 4), and the statistical significance level is **p < 0.01. | ||
In order to evaluate the amount of Ir–Bd in the tumors and other organs, the HeLa tumor-bearing mice were sacrificed after intravenous injection with different time intervals. The tumor-bearing mice treated with free Bd or Ir was used as a control. The biodistribution profiles of Bd, Ir and Ir–Bd were shown in Fig. 9b. It is obvious that a large amount of Ir–Bd accumulate in tumor, lung, liver, spleen, and kidney at the first 3 h. After 6 h post injection, the content of Ir–Bd obviously decreases in kidney, and lung, whereas the downward trend in tumor, liver and spleen is slower. After a tail-vein injection of Bd and Ir, Ir mainly accumulates in the lung and spleen, followed by kidney, liver and heart up to 3 h. After 6 h, the Ir concentration in the spleen and kidney decreases quickly. In contrast, Bd largely accumulates in the liver, followed by spleen, lung, kidney, and heart. Compared to that of Ir–Bd, the concentration of free Bd and Ir is lower in the tumor and other organs. These data suggest that Ir–Bd NPs can be accumulated in tumors probably by passive targeting through the EPR effect.
5. Conclusions
In summary, an amphiphilic drug couple Ir–Bd have been prepared for highly effective cancer combination chemotherapy. Ir–Bd can self-assemble into stable nanoparticles in water and exhibits longer blood retention time than that of the corresponding free drugs in the bloodstream, which facilitates to the accumulation of drugs in tumor tissues and promotes the cellular uptake. Benefiting from the nanoscale characteristics, Ir–Bd NPs can be easily self-delivered and achieve a high drug concentration in cancer cells, which leads to higher cell cytotoxicity, cell apoptosis rate, and caspase-3 protein activity than that of the corresponding free drugs. Importantly, Ir–Bd NPs could effectively circumvent the MDR of tumor cells. After hydrolysis of Ir–Bd NPs, the released free Ir and Bd can kill cancer cells through different mechanisms of action, resulting in a better efficacy of combination cancer chemotherapy. This small molecular anticancer drug self-delivery system has a potential application for cancer treatment in clinic.Acknowledgements
The authors thank Lei Feng (Instrumental Analysis Center of Shanghai Jiao Tong University) for LC-MS assay. The authors gratefully acknowledge the financial supports provided by the National Basic Research Program (No. 2013CB834506, 2012CB821500), National Natural Science Foundation of China (No. 21174086, 21074069, 91127047, 21374062, 21204048).Notes and references
- R. Siegel, J. Ma, Z. Zou and A. Jemal, Ca-Cancer J. Clin., 2014, 64, 9–29 CrossRef PubMed.
- D. Manasi, C. Mohanty and S. K. Sahoo, Expert Opin. Drug Delivery, 2009, 6, 285–304 CrossRef PubMed.
- M. Chandana, D. Manasi, R. K. Jagat and K. S. Sanjeeb, Curr. Drug Delivery, 2011, 8, 45–58 CrossRef.
- A. Persidis, Nat. Biotechnol., 1999, 17, 94–95 CrossRef CAS PubMed.
- J. Lehár, A. S. Krueger, W. Avery, A. M. Heilbut, L. M. Johansen, E. R. Price, R. J. Rickles, G. F. Short 3rd, J. E. Staunton, X. Jin, M. S. Lee, G. R. Zimmermann and A. A. Borisy, Nat. Biotechnol., 2009, 27, 659–666 CrossRef PubMed.
- H. M. McDaid and P. G. Johnston, Clin. Cancer Res., 1999, 5, 215–220 CAS.
- F. Calabrò, V. Lorusso, G. Rosati, L. Manzione, L. Frassineti, T. Sava, E. D. Di Paula, S. Alonso and C. N. Sternberg, Cancer, 2009, 115, 2652–2659 CrossRef PubMed.
- P. Parhi, C. Mohanty and S. K. Sahoo, Drug Discovery Today, 2012, 17, 1044–1052 CrossRef CAS PubMed.
- C. W. Su, C. S. Chiang, W. M. Li, S. H. Hu and S. Y. Chen, Nanomedicine, 2014, 9, 1499–1551 CrossRef CAS PubMed.
- F. Greco and M. J. Vicent, Adv. Drug Delivery Rev., 2009, 61, 1203–1213 CrossRef CAS PubMed.
- N. R. Patel, A. Rathi, D. Mongayt and V. P. Torchilin, Int. J. Pharm., 2011, 416, 296–299 CrossRef CAS PubMed.
- X. Ding, K. Cai, Z. Luo, J. Li, Y. Hu and X. Shen, Nanoscale, 2012, 4, 6289–6292 RSC.
- W. Dai, W. Jin, J. Zhang, X. Wang, J. Wang, X. Zhang, Y. Wan and Q. Zhang, Pharm. Res., 2012, 29, 2902–2911 CrossRef CAS PubMed.
- S. Biswas, N. S. Dodwadkar, P. P. Deshpande and V. P. Torchilin, J. Controlled Release, 2012, 159, 393–402 CrossRef CAS PubMed.
- R. K. Pathak and S. Dhar, J. Am. Chem. Soc., 2015, 137, 8324–8327 CrossRef CAS PubMed.
- E. Wang, H. Xiong, D. Zhou, Z. Xie, Y. Huang, X. Jing and X. Sun, Macromol. Biosci., 2014, 14, 588–596 CrossRef CAS PubMed.
- Y. Li, J. Lin, H. Wu, Y. Chang, C. Yuan, C. Liu, S. Wang, Z. Hou and L. Dai, Mol. Pharmaceutics, 2015, 12, 769–782 CrossRef CAS PubMed.
- H. Song, H. Xiao, M. Zheng, R. Qi, L. Yan and X. Jing, J. Mater. Chem. B, 2014, 2, 6560–6570 RSC.
- S. Aryal, C. M. Hu and L. Zhang, Mol. Pharmaceutics, 2011, 8, 1401–1407 CrossRef CAS PubMed.
- M. Li, Z. Tang, S. Lv, W. Song, H. Hong, X. Jing, Y. Zhang and X. Chen, Biomaterials, 2014, 35, 3851–3864 CrossRef CAS PubMed.
- L. Cai, G. Xu, C. Shi, D. Guo, X. Wang and J. Luo, Biomaterials, 2015, 37, 456–468 CrossRef CAS PubMed.
- T. Ramasamy, H. B. Ruttala, J. Y. Choi, T. H. Tran, J. H. Kim, S. K. Ku, H. G. Choi, C. S. Yong and J. O. Kim, Chem. Commun., 2015, 51, 5758–5761 RSC.
- M. Jia, Y. Li, X. Yang, Y. Huang, H. Wu, Y. Huang, J. Lin, Y. Li, Z. Hou and Q. Zhang, ACS Appl. Mater. Interfaces, 2014, 6, 11413–11423 CAS.
- L. Liao, J. Liu, E. C. Dreaden, S. W. Morton, K. E. Shopsowitz, P. T. Hammond and J. A. Johnson, J. Am. Chem. Soc., 2014, 136, 5896–5899 CrossRef CAS PubMed.
- R. Sun, Y. Liu, S. Li, S. Shen, X. Du, C. Xu, Z. Cao, Y. Bao, Y. Zhu, Y. Li, X. Yang and J. Wang, Biomaterials, 2015, 37, 405–414 CrossRef CAS PubMed.
- N. Kolishettia, S. Dharc, P. M. Valenciad, L. Q. Lind, R. Karnike, S. J. Lippard, R. Langer and O. C. Farokhzad, Proc. Natl. Acad. Sci. U. S. A., 2010, 107, 17939–17944 CrossRef PubMed.
- P. S. Pramod, R. Shah, S. Chaphekar, N. Balasubramanian and M. Jayakannan, Nanoscale, 2014, 6, 11841–11855 RSC.
- H. Meng, M. Wang, H. Liu, X. Liu, A. Situ, B. Wu, Z. Ji, C. Chang and A. E. Nel, ACS Nano, 2015, 19, 3540–3557 CrossRef PubMed.
- H. Lu, Y. Chang, N. Fan, L. Wang, N. Lai, C. Yang, L. Wu and J. A. Ho, Biomaterials, 2015, 42, 30–41 CrossRef CAS PubMed.
- F. Muhammad, A. Wang, M. Guo, J. Zhao, W. Qi, G. Jie, J. Gu and G. Zhu, ACS Appl. Mater. Interfaces, 2013, 5, 11828–11835 CAS.
- Z. Xu, S. Liu, Y. Kang and M. Wang, Nanoscale, 2015, 7, 5859–5868 RSC.
- D. Liu, H. Zhang, B. Blanco, E. Mäkilä, V. Lehto, J. Salonen, J. Hirvonen and H. A. Santos, Small, 2014, 10, 2029–2038 CrossRef CAS PubMed.
- V. Shanmugam, Y. Chien, Y. Cheng, T. Liu, C. Huang, C. Su, Y. Chen, U. Kumar, H. Hsu and C. Yeh, ACS Appl. Mater. Interfaces, 2014, 6, 4382–4393 CAS.
- S. Lee, T. V. O'Halloran and S. T. Nguyen, J. Am. Chem. Soc., 2010, 132, 17130–17138 CrossRef CAS PubMed.
- H. Xiao, H. Song, Q. Yang, H. Cai, R. Qi, L. Yan, S. Liu, Y. Zheng, Y. Huang, T. Liu and X. Jing, Biomaterials, 2012, 33, 6507–6519 CrossRef CAS PubMed.
- X. Duan, J. Xiao, Q. Yin, Z. Zhang, H. Yu, S. Mao and Y. Li, ACS Nano, 2013, 7, 5858–5869 CrossRef CAS PubMed.
- I. Husain, J. L. Mohler, H. F. Seigler and J. M. Besterman, Cancer Res., 1994, 54, 539–546 CAS.
- P. Huang, D. Wang, Y. Su, W. Huang, Y. Zhou, D. Cui, X. Zhu and D. Yan, J. Am. Chem. Soc., 2014, 136, 11748–11756 CrossRef CAS PubMed.
- J. Chen, K. Przyuski, R. Roemmele and R. P. Bakale, Org. Process Res. Dev., 2011, 15, 1063–1072 CrossRef CAS.
- T. Zhang, P. Huang, L. Shi, Y. Su, L. Zhou, X. Zhu and D. Yan, Mol. Pharmaceutics, 2015, 12, 2328–2336 CrossRef CAS PubMed.
- S. Y. Park, B. R. Han, K. M. Na, D. K. Han and S. C. Kim, Macromolecules, 2003, 36, 4115–4124 CrossRef CAS.
- T. C. Chou, Cancer Res., 2010, 70, 440–446 CrossRef CAS PubMed.
- Z. Li, Y. Liu, X. Wang, L. Liu, J. Hu, G. Luo, W. Chen, L. Rong and X. Zhang, ACS Appl. Mater. Interfaces, 2013, 5, 7995–8001 CAS.
- M. M. Gottesman, Annu. Rev. Med., 2002, 53, 615–627 CrossRef CAS PubMed.
- M. M. Gottesman, T. Fojo and S. E. Bates, Nat. Rev. Cancer, 2002, 2, 48–58 CrossRef CAS PubMed.
- G. Tian, X. Zheng, X. Zhang, W. Yin, J. Yu, D. Wang, Z. Zhang, X. Yang, Z. Gu and Y. Zhao, Biomaterials, 2015, 40, 107–116 CrossRef CAS PubMed.
- Q. He, Y. Gao, L. Zhang, Z. Zhang, F. Gao, X. Ji, Y. Li and J. Shi, Biomaterials, 2011, 32, 7711–7720 CrossRef CAS PubMed.
- D. R. Green, Cell, 1998, 94, 695–698 CrossRef CAS.
- E. Krepela, Neoplasma, 2001, 48, 332–349 CAS.
Footnote |
| † Electronic supplementary information (ESI) available: Synthesis route, UV/Vis spectrum, and fluorescence emission spectrum of Ir–Bd; fluorescence emission spectrum, and stable experiment of Ir–Bd NPs; total ion chromatography (TIC) of Ir, Bd, and the cell extracts; immunotoxicity study. See DOI: 10.1039/c5ra16511c |
| This journal is © The Royal Society of Chemistry 2015 |