 Open Access Article
Study of decomposition products by gas chromatography-mass spectrometry and ion chromatography-electrospray ionization-mass spectrometry in thermally decomposed lithium hexafluorophosphate-based lithium ion battery electrolytes
Vadim
Kraft
,
Waldemar
Weber
,
Martin
Grützke
,
Martin
Winter
and
Sascha
Nowak
*
University of Münster, MEET Battery Research Center, Institute of Physical Chemistry, Corrensstraße 46, 48149 Münster, Germany. E-mail: sascha.nowak@uni-muenster.de; Fax: +49 251 83 36032
First published on 15th September 2015
Abstract
In this work, the thermal decomposition of a lithium ion battery electrolyte (1 M LiPF6 in ethylene carbonate/ethyl methyl carbonate, 50/50 wt%) with a focus on the formation of organophosphates was systematically studied. The quantification of non-ionic dimethyl fluorophosphate and diethyl fluorophosphate was performed with synthesized standards by gas chromatography-mass spectrometry. Due to absence of commercially available or synthesized standards for the monitoring of ionic methyl fluorophosphate, ethyl fluorophosphate and ethylene phosphate a method working with ion chromatography-electrospray ionization-mass spectrometry was developed, where dibutyl phosphate was used as an internal standard. In addition, an ion chromatography conductivity detection method with short analysis time for simultaneous determination and quantification of F−, PF6− and BF4− was developed. The formation and degradation of analytes was studied to show the dependence of different temperatures, electrolyte volumes and separator materials. The thermal aging experiments were carried out in gas-tight aluminum vials at 80 °C for three weeks. After the storage time, the samples were diluted with the appropriate analysis solvents and investigated with gas chromatography-mass spectrometry, ion chromatography and ion chromatography-electrospray ionization-mass spectrometry. Finally, the thermal degradation of the electrolyte at 85 °C after five days in aluminum and glass vials was studied.
1 Introduction
The investigation of the chemical and electrochemical aging occurring in lithium ion batteries (LIBs) is a central point for the further development of novel and improved battery materials and battery cells as aging is influencing cycling stability, power fading and safety.1 This includes, inter alia, the analysis of the electrolyte decomposition products formed by aging processes. Currently, the electrolytes based on LiPF6 dissolved in organic carbonates are the most established in industry.2,3 Despite the advantages of LiPF6 like high solubility in the organic carbonate solvents,4 high electrochemical stability,5 excellent solid electrolyte interphase (SEI) formation properties6 and aluminum current collector protection,7,8 this conducting salt is unfortunately also known for its low chemical and thermal instability in organic carbonates.5–8 The thermal decomposition was in focus of many research groups and is still an ongoing issue of debate. By application of different analysis techniques numerous aging products were identified, including HF,9–13 inorganic or organic phosphates (OPs),11,14–18,41 CO2,15,19,20 dicarboxylates,42,43 diols40 and alkyl fluorides.12,15,19,41,45 The negative impact of HF on the battery performance resulting from dissolution of manganese in LiMnO2 (ref. 21) or LiNi1/3Co1/3Mn1/3O2 (ref. 22) cathodes or the deterioration of the SEI on the anode23 was proven. Other decomposition products like organic fluorophosphates are critical due to their high toxicity.15 Dimethyl fluorophosphate (DMFP) and diethyl fluorophosphate (DEFP) were frequently detected by several groups.12,15,17,18 Due to presence of fluoride in their structure, which is a good leaving group, both compounds are effective nerve agents and have similar toxicity to diisopropyl fluorophosphate,24 which is used as sarin imitator.25,26With few exceptions, the previous analysis of thermal decomposition products was performed non-quantitatively. The quantification experiments were focused on the monitoring of HF formation measured with spectroscopic ellipsometry9,10 or by titration.12 In previous works, we applied gas chromatography-mass spectrometry (GC-MS) and two dimensional-ion chromatography-mass spectrometry (IC/IC-ESI-MS)44 for identification of non-ionic and ionic OPs generated at elevated temperatures. The aging was performed at 95 °C with the aim to produce various analytes establishing a comprehensive picture of the decomposition mechanism. Furthermore, the quantification of DMFP and DEFP after 48 h aging time could be accomplished with GC-MS. The quantification of ionic OPs was not possible due to the absence of commercially available or synthesized analytical standards, but a method for the monitoring of the concentration change was developed. In the present work, we apply a GC-MS method developed by us with focus on quantification of DMFP and DEFP to the systematical study of the thermal decomposition at different temperatures and using various electrolyte volumes. In addition, the influence of different separator and storage materials on aging is studied. Ion chromatography-electrospray ionization-mass spectrometry (IC-ESI-MS) is chosen as a supporting method, in which instead of an absolute quantification, the aging is monitored relative to DBP as an internal standard (IS). In addition, IC with conductivity detection is applied to monitor PF6− and other inorganic decomposition products.
In most published reports about thermal decomposition of electrolytes nuclear magnetic resonance spectroscopy (NMR) glass tubes were used.14,15,27–29 As shown by Handel et al., compared to polymeric materials, glass accelerates the degradation.12 It was proposed, that SiO2 undergoes a reaction with HF resulting in the production of water, which in turn leads to more LiPF6 degradation. The electrolyte storage container for our previous experiments and present work is made from aluminum. Although reactions similar to the reaction with glass may be expected from Al, as the surface aluminum oxide can be attacked by HF30 leading to increased concentration of decomposition products, a study of thermal electrolyte aging in the presence of aluminum is for several reasons of high interest. Aluminum is the essential part of a lithium ion battery as current collector for cathodes8 and it is a promising material for some battery parts, for instance the cell cans. As shown by Chen et al., aluminum coated cans have much higher resistance vs. oxidation at high voltages compared to stainless positive cans, which reflects in a dramatically improved initial coulombic efficiency.31 Furthermore, the coating of LiNi0.05Co0.15Mn0.4O2 with Al2O3 enhances the battery performance32 and Al2O3 coated separators have increased thermal stability, which is especially important for applications in electric vehicles.33 Finally, the electrolytes studied in our work, are commercially available in aluminum bottles. For all these reasons, the aging behavior in aluminum and glass vials was studied and compared.
Herein, we present a basic and reliable method for systematical investigations of OPs generated in LiPF6-based LIB electrolytes at 80–85 °C. Besides the toxicological aspects of the OPs, it can be additionally applied for monitoring the thermal aging degree of the electrolyte.
2 Experimental part
2.1 Chemicals and materials
A battery grade SelectiLyte™ electrolyte LP50 was purchased from BASF (Ludwigshafen, Germany). The electrolyte consists of 1 M LiPF6 dissolved in ethylene carbonate/ethyl methyl carbonate (EC/EMC, 50/50 wt%). Deionized water for the preparation of IC eluents, of standard solutions and for dilution of analytes was produced with a Milli-Q water system using a LC-PAK cartridge (Bedford, USA). Sodium carbonate (Certipur) and sodium bicarbonate (for analysis) for IC measurements were purchased from Merck (Darmstadt, Germany). Acetonitrile (ACN) (HPLC gradient grade) was ordered from VWR (Bruchsal, Germany). Dibutyl phosphate (DBP) (97.0% purity) was ordered from Sigma-Aldrich (Steinheim, Germany). The GC equipment was run with helium (purity 6.0) as the carrier gas (Westfalen Gas, Germany). Dichloromethane (DCM) (HiPerSolv) was purchased from Merck (Darmstadt, Germany). The fluoride standard solution (1000 ppm) (TraceCERT®) was purchased from Sigma-Aldrich (Steinheim, Germany). LiPF6 (battery grade) and LiBF4 were ordered from BASF (Ludwigshafen, Germany). For the thermal aging experiments 10 mL aluminum vials with butyl/polytetrafluoroethylene (PTFE) screw caps from Leicht & Appel GmbH (Bad Gandersheim, Germany) and 10 mL glass vials with butyl/polytetrafluoroethylene (PTFE) screw caps from Macherey-Nagel (Düren, Germany) were used. The aging experiments with materials were performed with filters based on polyolefin (FS 2226) of Freudenberg Vliesstoffe (Weinheim, Germany) and glass fiber (WhatmanTM GF/D) of GE Healthcare Life Science (Little Chalfont, Great Britain).2.2 Karl Fischer titration and aging of electrolytes
The water content in the electrolytes was measured with an 851 Titrando Karl Fisher Coulometer (Metrohm, Herisau, Switzerland). The instrument was controlled with the software Tiamo 2.3 from the same company. The water content in electrolyte was determined to 20.1 ppm. The LP50 electrolyte samples were stored in gas-tight aluminum or glass vials at different temperatures.2.3 GC-MS conditions, sample preparation and quantification of analytes
GC MS experiments were done on a Shimadzu GC-MS-QP2010 Ultra a Restek Rxi-5ms column (30 m × 0.25 mm × 0.25 μm). The system was run with helium as the carrier gas with a column flow of 1 mL min−1, a split of 1![[thin space (1/6-em)]](https://www.rsc.org/images/entities/char_2009.gif) :
:![[thin space (1/6-em)]](https://www.rsc.org/images/entities/char_2009.gif) 100 and the following column oven program were used: starting with 40 °C for 1 min, the temperature was increased with a rate of 3 °C min−1 to 60 °C and then with 30 °C min−1 to 210 °C, held for 1.0 min. An electron impact (EI) ionization mode was used with a filament voltage of 70 V and a detector voltage of 1.5 kV. For sample preparation, 25 μL of a sample was added in a 1 mL polypropylene Safe-Lock tube, diluted in 1 mL dichloromethane and centrifuged for 5 minutes at 8500 rpm to remove the solid LiPF6. The centrifuged solution was transferred into a 1 mL GC glass vials and measured by GC-MS. For quantification of DMPF and DEPF an external five-point calibration (R2 > 0.99) with synthesized standards (purity > 99%) in a range of 1 to 50 ppm was used. Each standard solution and sample was measured three times. The mass fragment m/z 98 was used for the calibration of DMFP and m/z 113 for DEFP. The limits of detection (LOD) and limits of quantification (LOQ) were calculated according to DIN 32645: DMPF (1.0 ppm, 2.0 ppm), DEPF (1.2 ppm, 2.3 ppm).
100 and the following column oven program were used: starting with 40 °C for 1 min, the temperature was increased with a rate of 3 °C min−1 to 60 °C and then with 30 °C min−1 to 210 °C, held for 1.0 min. An electron impact (EI) ionization mode was used with a filament voltage of 70 V and a detector voltage of 1.5 kV. For sample preparation, 25 μL of a sample was added in a 1 mL polypropylene Safe-Lock tube, diluted in 1 mL dichloromethane and centrifuged for 5 minutes at 8500 rpm to remove the solid LiPF6. The centrifuged solution was transferred into a 1 mL GC glass vials and measured by GC-MS. For quantification of DMPF and DEPF an external five-point calibration (R2 > 0.99) with synthesized standards (purity > 99%) in a range of 1 to 50 ppm was used. Each standard solution and sample was measured three times. The mass fragment m/z 98 was used for the calibration of DMFP and m/z 113 for DEFP. The limits of detection (LOD) and limits of quantification (LOQ) were calculated according to DIN 32645: DMPF (1.0 ppm, 2.0 ppm), DEPF (1.2 ppm, 2.3 ppm).
2.4 IC and IC-ESI-MS conditions, sample preparation and quantification of analytes
All ion chromatographic investigations were carried out with 850 Professional IC instruments of Metrohm with a chemical suppression and conductivity detection (Herisau, Switzerland). The samples were injected with an 889 IC sample center. The IC systems were controlled with the software MagIC Net 3.0 (Metrohm, Herisau, Switzerland). The injection volume for all IC measurements was 10 μL. For sample preparation, 10 μL were diluted in 1 mL water. The quantification of PF6−, BF4− and F− was performed with an aqueous solution of 2.3/2.2 mM Na2CO3/NaHCO3 and 25% ACN isocratically. The separation was carried out on a Metrosep A Supp 4-250/4.0 column using a guard column Metrosep A Supp 4/5 Guard/4.0 with a flow of 1 mL min−1 and a column oven temperature of 40 °C. For quantification of BF4− and F− an external seven-point calibration (R2 > 0.99) with prepared or commercially available stock solutions in a range of 0.1 to 25 ppm (BF4− and F−) or 0.01 to 2.5 mM were used. Each standard solution and sample was measured twice. For the study of ionic organophosphates an aqueous solution of 4.5/4.3 mM Na2CO3/NaHCO3 and a gradient step with ACN were applied. The percentage of acetonitrile was changed as follows: 0 min, 25%; 9 min, 25%; 12 min, 45%; 20 min, 45%; 21 min, 25%; 30 min, 25%. The analysis was carried out on Metrosep A Supp 7-250/4.0 and a guard column Metrosep A Supp 4/5 Guard/4.0 with a flow of 0.7 mL min−1 and a column oven temperature of 40 °C. The mass spectrometric measurements were performed using a triple quadrupole/linear ion trap instrument 3200 LC/MS/MS (AB Sciex, Framingham, USA). The ESI-MS instrument was controlled with the software Analyst 1.5.2 from the same producer. The applied ion spray voltage was −4250 V. The curtain, nebulizer and dry gas were applied with 30, 35 and 40 psi, respectively. The measurements were performed with the declustering potential of 25 V and the entrance potential of −10 V. The source was heated to 450 °C. The experiments were performed in a multiple monitoring mode (MRM) with a collision energy of −30 eV. For sample preparation, 10 μL of a real sample were diluted in 1 mL ACN and spiked with 5 μL of the DBP solution (1000 vppm). For the measurements the parent ions of three OPs with the fragment m/z 79 were chosen. The m/z ratios of parent ions were as followed: methyl fluorophosphate (MFP) 113.0, ethyl fluorophosphate (EFP) 127.0, ethylene phosphate (EP) 123.0. LOD and LOQ were calculated according to DIN 32645: PF6− (9.8 ppm, 29.7 ppm), BF4− (0.8 ppm, 2.4 ppm), F− (0.1 ppm, 0.3 ppm). All sample preparations were carried out in a dry room (max. 20 ppm H2O).3 Results
3.1 Determination and quantification of thermal decomposition products by GC-MS, IC and IC-ESI-MS
Fig. 1 shows a typical GC-MS chromatogram in a selective ion monitoring (SIM) mode of the LP50 electrolyte after storage at 80 °C for 21 days. DMFP, ethyl methyl fluorophosphate (EMFP) and DEFP are detected at the retention times of 4.2, 6.0 and 8.4 min, respectively. In addition, the retention times for trimethyl phosphate (TMP) (tR 9.5 min, m/z 110) and triethyl phosphate (TEP) (tR 11.5 min, m/z 155) were identified using commercially available standards. The reliable identification of organophosphates by the retention time and elucidation of fragmentation pattern using a GC-MS was performed according to Weber et al.18 The work describes the detection of trialkyl phosphates, but only in strongly aged electrolytes. Since the concentration of all trialkyl phosphates was below the limit of detection during our study, the focus was on DMFP and DEFP.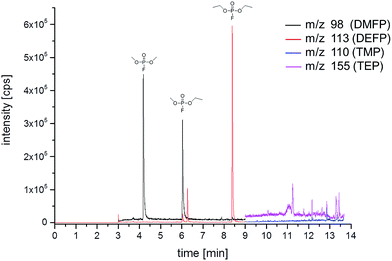 | ||
| Fig. 1 GC-MS chromatogram (SIM mode) of the LP50 electrolyte after storage for 21 days in a 10 mL aluminum vial at 80 °C. | ||
To support the GC-MS results, we applied additional IC-ESI-MS measurements. A different fraction of decomposition products constitutes the ionic phosphates, which structure was elucidated by MS/MS experiments after thermal aging at 95 °C.16 To investigate the aging processes in details, three target ionic phosphates have been chosen: methyl fluorophosphate (MFP, m/z 113), ethyl fluorophosphate (EFP, m/z 127) and ethylene phosphate (EP, m/z 123), which are present in the spectra of thermally degraded electrolytes with sufficient intensity. Since standards for the ionic OPs are not commercially available, a method for monitoring the concentration change was developed. Instead of an absolute quantification, a relative quantification has been carried out using the constant concentration of IS in the investigated samples. The organic phosphate DBP is an appropriate candidate as IS. It is commercially available and has advantageously a similar retention time compared to the studied analytes. The signal ratio of the analyzed peak areas (analyte/IS) is calculated and applied as an independent value for the comparison of the different samples. In addition, to increase the sensitivity and specificity of the ESI-MS detection, the measurements were performed in the multiple reaction modus (MRM) mode. Since PO3− has been identified as the characteristic fragment of all OPs,16m/z 79 was chosen for reliable determination of the analytes. The same mass fragment is obtained from DBP in the MS/MS experiment. An additional parameter to increase the sensitivity of the ESI-MS method is a high content of organic co-solvents like methanol or ACN in the eluent.34 Therefore, the IC method was further developed with a high eluent content of ACN (25% in a period of 0–9 min) on a high capacity A Supp 7 column. The IC-ESI-MS chromatogram is presented in Fig. 2. The retention times under these conditions are: EP (8.5 min), MFP (10.4 min), EFP (10.9 min), DBP (12.6 min). Despite the application of a high capacity separation column, the analytes still have a high co-elution degree.
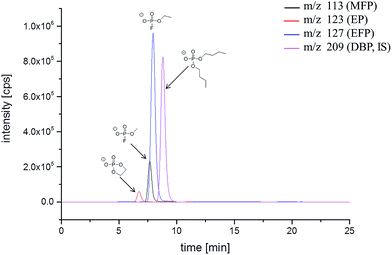 | ||
| Fig. 2 IC-ESI-MS chromatogram (MRM mode) of the LP50 electrolyte after storage in a 10 mL aluminum vial at 80 °C for 21 days. | ||
Additional to the ESI-MS detection, conductivity measurements have been carried out simultaneously. The corresponding chromatogram is shown in Fig. 3. The comparison of the retention times of the detected OPs with the retention time of fluoride indicates that at least EP co-elutes with F−, complicating the quantification of fluoride content by conductivity. Beside EP, numerous other OPs have a high co-elution degree with fluoride.16 Nevertheless, the fluoride content was investigated after the aging experiments and will be discussed below.
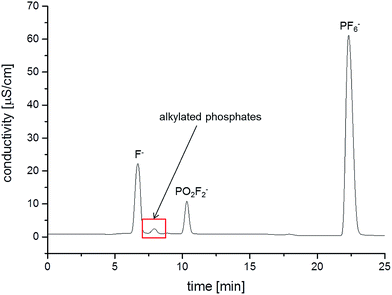 | ||
| Fig. 3 IC/conductivity chromatogram of the LP50 electrolyte after storage in a 10 mL aluminum vial at 80 °C for 21 days. | ||
3.2 Influence of the electrolyte volume and the temperature on the formation of organophosphates
Commercially available aluminum vials were chosen as a standard electrolyte sample container. The general aim was to find suitable experimental conditions for the analysis of longer samples series (e.g. overnight experiments). To investigate the influence on the degradation formation due to different sample volumes in the storage vials, an experiment with ten LP50 samples ranging from 1 to 10 mL was carried out. The results obtained by GC-MS and IC-ESI-MS measurements are shown in Fig. 4. The volume of the headspace phase correlates with the concentration (GC-MS) or concentration change (IC-ESI-MS) of the formed OPs. Since the occurring PF5 is a very reactive compound, its further chemical degradation can take place in the solvent as well in the gas phase. Therefore, the highest degradation degree is observed when using 1 to 5 mL electrolyte.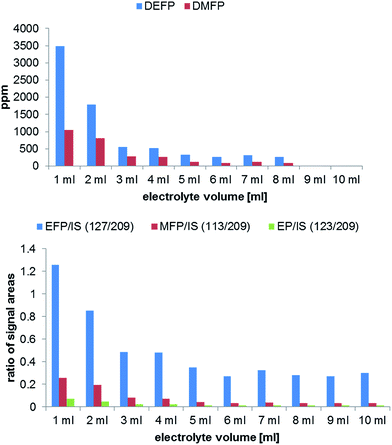 | ||
| Fig. 4 Analysis of OP formation by GC-MS (top) and IC-ESI-MS (bottom) in dependence on the used electrolyte volume performed in 10 mL aluminum vials after aging at 80 °C for 21 days. | ||
An additional important aspect is the influence of the temperature on the electrolyte aging. In Fig. 5 a clear dependence on the applied temperature is observable. As shown, the temperatures of 20 °C and 40 °C generate only very low amounts of degradation products. In contrast to the GC-MS results, a change in the concentration can be detected by IC for all temperatures. At 80 °C the highest amount of OPs is generated, however, the relative standard deviation for DEFP and EFP is also higher under these thermal conditions. It can be concluded, that 60–80 °C temperature range is the most suitable for a comprehensive aging study.
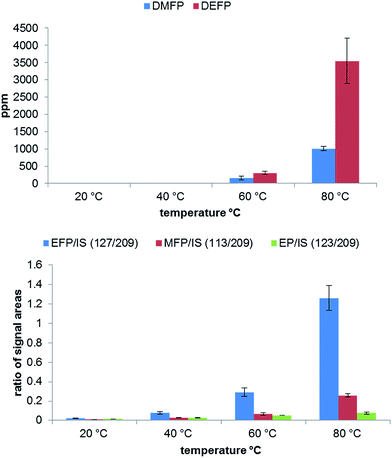 | ||
| Fig. 5 Analysis of OP formation by GC-MS (top) and IC-ESI-MS (bottom) in dependence on the applied temperature performed in 10 mL aluminum vials after aging at 80 °C for 21 days. | ||
In addition, the formation of fluoride for the same samples was studied. The calculated content of F− is shown in Fig. 6. The obtained results for the F− concentration are in very good agreement to the results for the detection of non-ionic and ionic OPs. Therefore, it is possible to investigate the aging of the electrolytes by only monitoring the fluoride formation. Nevertheless, it is important to remark, that the F− peak in IC chromatograms co-elutes with ionic organophosphates as mentioned above. For the investigated samples, the content of ionic organophosphates is very low, thus their influence on the F− content can be neglected (the differences between the individual compounds are in the same magnitude as the determined standard deviation). For samples with a high degradation degree it is possible, that the calculated F− content has a positive bias due to the presence of co-eluted compounds and alternative methods like the determination with a fluoride selective electrode have to be applied to validate the obtained fluoride values.
A different theoretically suitable analyte for monitoring the thermal aging by conductivity is the PF6− anion. Although the LiPF6 salt is highly hygroscopic, the degradation process is inhibited by adding high amounts of water as analysis solvent.35 Therefore, battery grade LiPF6 was dissolved in water and used as stock solution for the quantification of PF6−. In Fig. 7 the calculated concentrations of PF6− after 21 days aging time at 80 °C are shown. During the experiment with different electrolyte volumes only very low changes of the concentration were observed. The experiment at different temperatures correlates with the previously quantified OPs and fluoride content in dependence of the temperature. At 20 °C no degradation of PF6− takes place, while at elevated temperatures a low decrease of its concentration can be observed. Nevertheless, the observed differences are small and comparable to the determined standard deviation.
 | ||
| Fig. 7 Quantitative analysis of PF6− degradation in dependence on the electrolyte volume (left) or the applied temperatures (right) performed in 10 mL aluminum vials after aging at 80 °C for 21 days. | ||
3.3 Influence of the separator materials and the storage container materials on the thermal aging
To study the influence of two materials, which are frequently as separators in publications,8,36–38 on the thermal decomposition of the LP50 electrolyte, the polyolefin and glass fiber filters were placed in 1 mL electrolyte. With both methods, GC-MS and IC-ESI-MS no concentration change of the OPs in the case of the polyolefin material could be obtained (Fig. 8), which is explainable with the thermal and chemical inertness of the polyolefin fiber. In comparison, the presence of a glass fiber material induces strong decomposition of the electrolyte, which reflects in a massive formation of OPs. Because of this massive formation, the fluoride content could not reliably quantified. In addition, it was found that the concentration of PF6− decreased from 1.02 M to 0.70 M. It was stated by Handel et al., that the accelerated thermal degradation bases on the progressive production of water, which originates from the reaction of the LiPF6 hydrolysis product HF with SiO2.12 Since the glass fiber material contains supposedly boron oxide, it can be concluded that boron oxide reacts with HF in a similar way as SiO2, resulting in BF4− formation. The presence of BF4− was verified by ESI-MS measurements, whereas both boron isotope signals with m/z 86 and 87 (for 10BF4 and 11BF4) were detected. Furthermore, a LiBF4 standard was used for the final assignment.The thermal aging studies described in literature were performed so far in glass material such as NMR tubes at 85 °C.15,28,39 In order to repeat and review the experiments, we investigated the formation of OPs in aluminum vials compared to glass vials at the same temperature and analyzed the generated OPs by GC-MS and IC-ESI-MS (Fig. 9). Similar to the experiment with the glass fiber filter, the glass based storage container causes strong formation of the OPs due to the described above reaction of SiO2. Furthermore, the content of PF6− is decreased significantly (from 1.02 M to 0.43 M). The extent of decomposition in aluminum vials is much smaller (from 1.02 M to 0.98 M); the decomposition products remain in the order of the calculated standard deviation. Quantification of fluoride could not be carried out due to the high content on OPs disturbing F− analysis (see Fig. 10). This chromatogram also perfectly demonstrates the difficulties of F− detection and quantification in presence of high content of OPs. In the samples in contact with glass, BF4− was detected and quantified (0.32 wt%).
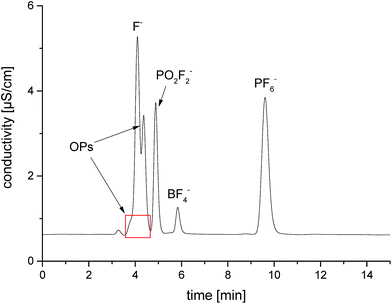 | ||
| Fig. 10 IC/conductivity chromatogram of the LP50 electrolyte after storage in a glass 10 mL vial at 85 °C for 5 days. | ||
In literature, the formation of BF4− from lithium bis(oxalato)borate (LiBOB) or lithium difluoro(oxalato)borate (LiDFOB) has been reported after an aging experiment of a LiPF6-based electrolyte at 85 °C.28,39 No information about the chemical nature of the NMR tubes used for this thermal aging experiment was available. We suspect, by the identification and quantification of BF4− reported in this work, that boron oxide containing materials, like SiO2 based containers, are not appropriate storage systems for LiPF6 based battery electrolytes.
4 Conclusions
A basic and reliable method working with GC-MS and IC-ESI-MS for monitoring of the thermal aging of a LP50 electrolyte was developed. The change in the concentration of the electrolyte degradation products after storage (i) at different temperatures, (ii) at different volume sizes and (iii) in contact with various materials and electrolyte container materials was investigated. Systematic variation of these parameters leads to a controlled formation of organophosphates, which serve as characteristic thermal decomposition products of the LiPF6/organic carbonate system. We propose that the aging degree of the electrolyte can be determined with a good reproducibility by low sample volume (1 mL in 10 mL vials) at 60–80 °C and after two-three weeks. The investigation was performed on one electrolyte composition but can be extrapolated to other LiPF6-based electrolytes containing organic carbonates. Finally, it was shown that a Whatman glass fiber separator placed in the electrolyte as well as glass storage vials accelerate the aging of the electrolyte at 80–85 °C dramatically, which reflects in a high concentration of organophosphates and a strong degradation of PF6−. In addition, BF4− as a product of the reaction of HF with boron oxide (as component of the glass) was determined and quantified in these samples.Acknowledgements
The state of North Rhine-Westphalia is acknowledged for funding of the project OptiLIB (n1102ck010a).References
- J. Vetter, P. Novak, M. R. Wagner, C. Veit, K. C. Moller, J. O. Besenhard, M. Winter, M. Wohlfahrt-Mehrens, C. Vogler and A. Hammouche, J. Power Sources, 2005, 147, 269–281 CrossRef CAS.
- K. C. Moller, T. Hodal, W. K. Appel, M. Winter and J. O. Besenhard, J. Power Sources, 2001, 97–8, 595–597 CrossRef.
- K. Xu, Chem. Rev., 2014, 114, 11503–11618 CrossRef CAS PubMed.
- V. Aravindan, J. Gnanaraj, S. Madhavi and H. K. Liu, Chem.–Eur. J., 2011, 17, 14326–14346 CrossRef CAS PubMed.
- K. Xu, Chem. Rev., 2004, 104, 4303–4417 CrossRef CAS PubMed.
- H. Schranzhofer, J. Bugajski, H. J. Santner, C. Korepp, K. C. Moller, J. O. Besenhard, M. Winter and W. Sitte, J. Power Sources, 2006, 153, 391–395 CrossRef CAS.
- E. Kramer, S. Passerini and M. Winter, ECS Electrochem. Lett., 2012, 1, C9–C11 CrossRef.
- E. Kramer, T. Schedlbauer, B. Hoffmann, L. Terborg, S. Nowak, H. J. Gores, S. Passerini and M. Winter, J. Electrochem. Soc., 2013, 160, A356–A360 CrossRef.
- S. F. Lux, J. Chevalier, I. T. Lucas and R. Kostecki, ECS Electrochem. Lett., 2013, 2, A121–A123 CrossRef CAS.
- S. F. Lux, I. T. Lucas, E. Pollak, S. Passerini, M. Winter and R. Kostecki, Electrochem. Commun., 2012, 14, 47–50 CrossRef CAS.
- L. Terborg, S. Weber, F. Blaske, S. Passerini, M. Winter, U. Karst and S. Nowak, J. Power Sources, 2013, 242, 832–837 CrossRef CAS.
- P. Handel, G. Fauler, K. Kapper, M. Schmuck, C. Stangl, R. Fischer, F. Uhlig and S. Koller, J. Power Sources, 2014, 267, 255–259 CrossRef CAS.
- H. Yang, G. V. Zhuang and P. N. Ross Jr, J. Power Sources, 2006, 161, 573–579 CrossRef CAS.
- C. L. Campion, W. T. Li, W. B. Euler, B. L. Lucht, B. Ravdel, J. F. DiCarlo, R. Gitzendanner and K. M. Abraham, Electrochem. Solid-State Lett., 2004, 7, A194–A197 CrossRef CAS.
- C. L. Campion, W. T. Li and B. L. Lucht, J. Electrochem. Soc., 2005, 152, A2327–A2334 CrossRef CAS.
- V. Kraft, M. Grutzke, W. Weber, M. Winter and S. Nowak, J. Chromatogr. A, 2014, 1354, 92–100 CrossRef CAS PubMed.
- B. Vortmann, S. Nowak and C. Engelhard, Anal. Chem., 2013, 85, 3433–3438 CrossRef CAS PubMed.
- W. Weber, V. Kraft, M. Grützke, R. Wagner, M. Winter and S. Nowak, J. Chromatogr. A, 2015, 394, 128–136 CrossRef PubMed.
- G. Gachot, P. Ribiere, D. Mathiron, S. Grugeon, M. Armand, J. B. Leriche, S. Pilard and S. Laruelle, Anal. Chem., 2011, 83, 478–485 CrossRef CAS PubMed.
- B. Ravdel, K. M. Abraham, R. Gitzendanner, J. DiCarlo, B. Lucht and C. Campion, J. Power Sources, 2003, 119, 805–810 CrossRef.
- M. Wohlfahrt-Mehrens, C. Vogler and J. Garche, J. Power Sources, 2004, 127, 58–64 CrossRef CAS.
- D. R. Gallus, R. Schmitz, R. Wagner, B. Hoffmann, S. Nowak, I. Cekic-Laskovic, R. W. Schmitz and M. Winter, Electrochim. Acta, 2014, 134, 393–398 CrossRef CAS.
- P. Verma, P. Maire and P. Novak, Electrochim. Acta, 2010, 55, 6332–6341 CrossRef CAS.
- S. D. Silver, J. Ind. Hyg. Toxicol., 1948, 30, 307–311 CAS.
- R. Gotor, A. M. Costero, S. Gil, M. Parra, R. Martinez-Manez and F. Sancenon, Chem.–Eur. J., 2011, 17, 11994–11997 CrossRef CAS PubMed.
- Y. W. Xie and B. N. Popov, Anal. Chem., 2000, 72, 2075–2079 CrossRef CAS PubMed.
- W. T. Li, C. Campion, B. L. Lucht, B. Ravdel, J. DiCarlo and K. M. Abraham, J. Electrochem. Soc., 2005, 152, A1361–A1365 CrossRef CAS.
- A. Xiao, L. Yang and B. L. Lucht, Electrochem. Solid-State Lett., 2007, 10, A241–A244 CrossRef CAS.
- M. Q. Xu, L. S. Hao, Y. L. Liu, W. S. Li, L. D. Xing and B. Li, J. Phys. Chem. C, 2011, 115, 6085–6094 CAS.
- N. van Landschoot, E. M. Kelder, P. J. Kooyman, C. Kwakernaak and J. Schoonman, J. Power Sources, 2004, 138, 262–270 CrossRef CAS.
- X. L. Chen, W. Xu, J. Xiao, M. H. Engelhard, F. Ding, D. H. Mei, D. H. Hu, J. Zhang and J. G. Zhang, J. Power Sources, 2012, 213, 160–168 CrossRef CAS.
- S. T. Myung, K. Izumi, S. Komaba, Y. K. Sun, H. Yashiro and N. Kumagai, Chem. Mater., 2005, 17, 3695–3704 CrossRef CAS.
- X. S. Huang, J. Solid State Electrochem., 2011, 15, 649–662 CrossRef CAS.
- T. Henriksen, R. K. Juhler, B. Svensmark and N. B. Cech, J. Am. Soc. Mass Spectrom., 2005, 16, 446–455 CrossRef CAS PubMed.
- L. Terborg, S. Nowak, S. Passerini, M. Winter, U. Karst, P. R. Haddad and P. N. Nesterenko, Anal. Chim. Acta, 2012, 714, 121–126 CrossRef CAS PubMed.
- J. Hassoun, F. Croce, I. Hong and B. Scrosati, Electrochem. Commun., 2011, 13, 228–231 CrossRef CAS.
- C. Dippel, S. Krueger, V. Kraft, S. Nowak, M. Winter and J. Li, Electrochim. Acta, 2013, 105, 542–546 CrossRef CAS.
- L. Lombardo, S. Brutti, M. A. Navarra, S. Panero and P. Reale, J. Power Sources, 2013, 227, 8–14 CrossRef CAS.
- M. Q. Xu, L. Zhou, L. S. Hao, L. D. Xing, W. S. Li and B. L. Lucht, J. Power Sources, 2011, 196, 6794–6801 CrossRef CAS.
- L. Terborg, S. Weber, S. Passerini, M. Winter, U. Karst and S. Nowak, J. Power Sources, 2014, 245, 836–840 CrossRef CAS.
- M. Grützke, V. Kraft, B. Hoffmann, S. Klamor, J. Diekmann, A. Kwade, M. Winter and S. Nowak, J. Power Sources, 2015, 273, 83–88 CrossRef.
- M. Grützke, V. Kraft, W. Weber, C. Wendt, A. Friesen, S. Klamor, M. Winter and S. Nowak, J. Supercrit. Fluids, 2014, 94, 216–222 CrossRef.
- M. Grützke, X. Mönnighoff, F. Horsthemke, V. Kraft, M. Winter and S. Nowak, RSC Adv., 2015, 5, 43209–43217 RSC.
- V. Kraft, M. Grützke, W. Weber, J. Menzel, S. Wiemers-Meyer, M. Winter and S. Nowak, J. Chromatogr. A, 2015, 1409, 201–209 CrossRef CAS PubMed.
- M. Grützke, S. Krüger, V. Kraft, B. Vortmann, S. Rothermel, M. Winter and S. Nowak, ChemSusChem, 2015 DOI:10.1002/cssc.201500920.
| This journal is © The Royal Society of Chemistry 2015 |


