Designing a novel high-throughput AlphaLISA assay to quantify plasma NHERF1 as a non-small cell lung cancer biomarker

Guifang Du ab, Xiaomei Yangab, Mu Hubc, Chengcheng Haoab, Yanan Guab, Xiuyi Zhibc, Wen G. Jiangabd, Junqi He*ab and Shan Cheng*ab
aDepartment of Biochemistry and Molecular Biology, Capital Medical University, Beijing 100069, China. E-mail: chengs@ccmu.edu.cn; jq_he@ccmu.edu.cn
bBeijing Key Laboratory of Cancer & Metastasis Research, Capital Medical University, Beijing 100069, China
cDepartment of Thoracic Surgery, Beijing Xuanwu Hospital, Capital Medical University, Beijing 100053, China
dCardiff China Medical Research Collaborative, Cardiff University School of Medicine, Heath Park, Cardiff CF14 4XN, UK

Received 16th August 2015 , Accepted 25th September 2015

First published on 28th September 2015


Abstract

NHERF1 might play a significant role in biological processes including oncogenic transformation and metastasis. Owing to the lack of highly sensitive and quantitative methods of NHERF1 in human plasma, there have been few reports on the plasma levels of NHERF1 and its correlation with cancer. Here, a novel amplified luminescent proximity homogeneous immunoassay (AlphaLISA) has been developed and validated for the quantification of NHERF1 in human plasma. This assay was based on an AlphaScreen detection technique with two different anti-NHERF1 antibodies coupled to donor and acceptor beads, respectively. The developed AlphaLISA assay was further optimized and validated in terms of linearity, limit of detection (LOD), limit of quantification (LOQ), precision, recovery, selectivity and interferences. The linear range of NHERF1 in human plasma was 5.00–100 ng mL−1, with an LOD of 2.00 ng mL−1. This AlphaLISA assay has been successfully applied to the quantification of NHERF1 in the plasma from 75 patients with non-small cell lung cancer (NSCLC). The levels of NHERF1 protein in plasma from patients with NSCLC were significantly higher than those in the healthy group (p = 0.0004). Based on the evaluation of the ROC curves, measuring the content of NHERF1 in human plasma could provide a potential diagnostic tool for NSCLC.
1. Introduction

Early diagnosis of cancer, the leading cause of death globally, is the key to treatment and long term survival of patients. Despite the progress in imaging techniques, such as radiographs and computerized tomography, cheap and reliable serum based methods which rely on tumor markers for cancer screening and diagnosis remains a challenge.1,2 Detection of cancer at an early disease stage is critical for successful clinical therapy, an improved prognosis, and increased survival rate. One of the current focuses in the area of cancer is the development of blood based tests for cancer screening and diagnosis.1

Na+/H+ exchanger regulatory factor 1 (NHERF1; also known as ezrin–radixin–moesin-binding phosphoprotein 50, EBP50) is a 358-residue protein composed of two tandem PDZ domains and a C-terminal ezrin-binding region3,4 (Fig. 1a). It functions as a molecular scaffold that coordinates the interaction of transmembrane proteins and cytosolic second messenger cascades. NHERF1 and its associated proteins are involved in cancer and cancer progression, such as phosphatase and tensin homologue (PTEN),5 neurofibromatosis tumor suppressors,6 β-catenin,7 platelet-derived growth factor receptor8 and epidermal growth factor receptor.9,10 These functions have raised some significant interests in NHERF1 which has been explored as a potentially attractive target for both diagnosis and treatment in cancer.3


image file: c5ra16502d-f1.tif
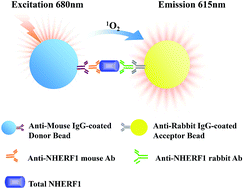
Fig. 1 Principle of AlphaLISA for the detection of NHERF1. (a) Molecular structure of NHERF1 showing selected interacting proteins above each domain; (b) detection of NHERF1 occurs via two anti-NHERF1 antibodies (immunizing aa 128–249 or 310) coupled to donor and acceptor beads respectively. Irradiation of the captured reaction products triggers an energy transfer leading to light emission proportional to the content of NHERF1 in plasma.

Abnormal expression of NHERF1 has been found in several types of human tumors, including schwannoma, hepatocellular carcinoma, glioblastoma,11 especially in colorecal12 and breast cancer.3 Studies utilizing western blot (WB) analysis and immunohistochemistry (IHC) of a series of tumors13 and contiguous non-involved tissues from the same patient have clearly demonstrated that NHERF1 is highly over-expressed in tumor tissues14 and that the over-expression is associated with increasingly aggressive clinical characteristics of the tumors and with poor prognosis of the patients.13,15 A heterogeneous and different distribution of NHERF1 expression was also observed in normal breast and colon, in situ carcinoma and invasive tumors as well as metastatic tumors.12,16 Indeed, cytoplasmic NHERF1 expression progressively increased in tumor cells from carcinoma in situ to invasive and metastatic tissues, and this increased cytoplasmic expression was paralleled by a progressive and significant decrease in membranous NHERF1 expression.17 Overall, these data have led to suggestions that NHERF1 may be useful as a marker of clinical relevance in cancer patients.3 However, no study have reported the changes of NHERF1 in plasma correlated with cancer, arguably due to lack of highly sensitive and quantitative methods for the identification of NHERF1 in human plasma, a highly challenging task. Because of these intrinsic limitations, alternative innovative assays that are robust, cost-effective, and easy to automate with high-throughput are urgently required for clinical applications. The AlphaLISA (amplified luminescent proximity homogeneous immunoassay) immunoassay platform has gained popularity over recent years and has been seen as an enhanced solution to enzyme-linked immunoassay (ELISA) tests.18–20 AlphaLISA has been developed from luminescent oxygen channeling immunoassay (LOCI) technique, in which the proximity of donor beads and acceptor beads cause singlet oxygen transferred, emitting light through chemiluminescence21 (Fig. 1b). The long singlet oxygen migration distance allows the energy transfer mechanism to go up to ∼200 nm, facilitating flexible and sensitive homogeneous immunoassays. This technique has been successfully applied to the detection of soluble proteins and particulate antigens.22,23 Perkin-Elmer's bead-based chemiluminescent no-wash assay has high sensitivity, wide dynamic range and robust performance that compares advantage with conventional ELISA.18

The aim of this study was to develop and validate a novel high-throughput AlphaLISA assay for the quantification of NHERF1 in human plasma. Subsequently, it was intended to investigate its applicability by analyzing the levels of NHERF1 in the plasma of patients with NSCLC. The AlphaLISA assay may subsequently be used for the detection of NHERF1 for cancer patients.

2. Experimental

2.1 Chemicals and reagents

Purified anti-NHERF1 mouse antibody (material no. 611161) was obtained from BD Company (Franklin Lake, NJ, USA) and anti-NHERF1 rabbit antibody (material no. 3394) was obtained from Cell Signaling Technologies (Boston, MA, USA). Anti-mouse IgG-coated donor beads, anti-rabbit IgG-coated acceptor beads, alpha-buffer and 384-well Optiplates were purchased from Perkin-Elmer Life Sciences (Waltham, MA, USA). Glutathione–agarose beads, thrombin, epidermal growth factor (EGF), vascular endothelial growth factor (VEGF), platelet-derived growth factor (PDGF) and hemoglobin were obtained from Sigma-Aldrich (St. Louis, MO, USA). Bilirubin, triglyceride and ascorbic acid were purchased from Aladdin Industrial Corporation (Shanghai, China). BCA™ Protein Assay Kit was purchased from Thermo Fisher Scientific Inc. (Waltham, MA, USA). Other reagents were obtained from Sigma-Aldrich (St. Louis, MO, USA) and Aladdin Industrial Corporation (Shanghai, China). Ultrapure water was produced by a Milli-Q Reagent Water System (Millipore, MA, USA).

2.2 Preparation and certification of reference standard of NHERF1 proteins

The glutathione-S-transferase (GST)-tagged NHERF1 expression plasmid pGEX-GST-NHERF1 was kindly provided by Dr Jiale Dai, MD Anderson Cancer Center, Houston, TX. The methods for expression fusion proteins were used as previously described.24 GST-NHERF1 protein was purified with glutathione–agarose beads according to the manufacturer's instructions. GST tag was excised by thrombin. GST was removed by glutathione–agarose beads.

Proteins were analyzed by sodium dodecyl sulfate polyacrylamide gel electrophoresis (SDS/PAGE) and visualized by Coomassie blue staining. Protein bands of interest were excised from Coomassie blue-stained gels, cut into small pieces, washed three times with the wash buffer [25 mmol ammonium bicarbonate in 50% ACN (pH 8.0)], and vortexed for 15 min. The samples were then reduced and alkylated by treatment with dithiothreitol (DTT, 10 mmol) and iodoacetamide (55 mmol), respectively. The gel pieces were then subjected to in-gel digestion, as described previously.25 Tryptic peptides were analyzed by prOTOF 2000 matrix-assisted laser desorption/ionization orthogonal time-of flightmass spectrometry (MS) (Perkin-Elmer, Shelton, CT, USA) interfaced with the TOF Works software (Perkin-Elmer, Shelton, CT, USA). In this study, a two-point external calibration of the prOTOF instrument was performed before acquiring the spectra of the samples. The protein was analyzed by searching Oryctolagus cuniculus sequences in the SWISS-PROT database using Aldente, a peptide mass fingerprinting tool.26

Protein concentrations were determined with a BCA™ Protein Assay Kit using bovine serum albumin (BSA) as a standard according to the manufacturer's protocol.

2.3 AlphaLISA assay

The AlphaLISA assay was performed in AlphaLISA buffer with a final reaction volume of 50 μL in 384 well microplate at room temperature. Briefly, the test samples and standards (5 μL) were added into the 384-well plates. An aliquot of 10 μL mix solution of anti-NHERF1 mouse antibody (final concentration 10 mmol) and anti-NHERF1 rabbit antibody (final concentration 50 mmol) in the assay buffer was added into the wells. The plates were covered with a lid and incubated at 37 °C for 60 min. Subsequently, anliquots of 10 μL of anti-rabbit IgG-coated acceptor beads (final concentration 10 μg mL−1) in assay buffer were added and incubated at 37 °C for 60 min. Finally, anliquots of 25 μL of anti-mouse IgG-coated donor beads (final concentration 10 μg mL−1) were added and the plate incubated at room temperature for 30 min in the dark. The AlphaLISA signal was measured on a 2104 EnVision Multilabel Reader (Perkin-Elmer Life Sciences, MA, USA).

2.4 Method validation

2.4.1 Linearity and range. For calibration purposes, a series of standard solutions were developed by diluting reference standard NHERF1 proteins in AlphaLISA buffer. This step generated the desired standard concentrations of 5.00, 10.0, 20.0, 50.0, and 100 ng mL−1. All the standard solutions were stored at 4 °C until analysis.
2.4.2 LOD & LOQ. The limits of sensitivity of the assay were measured using the limit of detection (LOD) and the limit of quantification (LOQ). The limit of detection (LOD) is the concentration of the proteins required to give a signal equal to the background (blank) plus three times the standard deviation of the blank; the lower limit of quantification (LLOQ) is twice the level of the LOD or the point where the CV falls below 20%, whichever is highest. The upper limit of quantification (ULOQ) is the point at which the calculated precision does not exceed 15% of the CV and the accuracy is within 15% of the expected concentration.
2.4.3 Precision. To determine the precision of the microarray platform, intra- and inter-assay comparisons were performed for the reference standard NHERF1 with a range of 5.00–100 ng mL−1 and three plasma samples of patients with the different concentrations of NHERF1 15.2, 22.0 and 62.9 ng mL−1, respectively. For the intra-assay (within-assay, within-plate) study, three duplicates of each sample were placed randomly on the same plate and analyzed in the same test. The intra-assay variation was calculated from the variation of the eight determinations of NHERF1 concentrations. For the inter-assay study (between plates, between runs), we assessed the variation by analyzing samples in the same manner in eight independent tests, one duplicate per day, and each sample in a different position on the plate in each test.
2.4.4 Recovery. Spiking recovery was assessed by adding final exogenous NHERF1 concentrations of 10.0, 40.0 and 80.0 ng mL−1 to three plasma samples from different patients. The concentrations of plasma NHERF1 in these three patients were 14.2, 33.3 and 46.2 ng mL−1, respectively.

Ten microliters of each of the exogenous NHERF1 protein was spiked into 190 μL of plasma samples at a ratio of 1[thin space (1/6-em)]:[thin space (1/6-em)]19, leaving the plasma matrix of the spiked sample relatively intact. To calculate the expected values, 95% of the unspiked value was added to 5% of the spiking solution concentration. Evaluations were performed by calculating the ratio between measured and expected values.

2.4.5 Selectivity. To investigate the selectivity of the developed NHERF1 assay, the effect of adding other growth factor proteins, frequently measured in plasma, epidermal growth factor (EGF), vascular endothelial growth factor (VEGF) and platelet-derived growth factor (PDGF) to normal human plasma samples was assessed. The cross-reactivity was expressed as the percent ratio between measured and expected values.
2.4.6 Interferences. Interference was assessed by the addition of interfering substances to plasma samples at the stated final concentrations as follows: hemoglobin from washed hemolyzed erythrocytes, bilirubin (unconjugated) prepared in sodium carbonate/dimethyl sulfoxide, and triglyceride in the form of intralipid 20% fat emulsion, and sodium ascorbate.

2.5 Method application

Clinical plasma samples (n = 93) were collected from Xuanwu Hospital (Beijing, China). The clinical plasma samples included 75 patients with non-small cell lung cancer (NSCLC) (18 lung squamous cell carcinoma, 34 lung adenocarcinoma, 3 adenosquamous carcinoma and 20 unclear type NSCLC), and 18 healthy donors. Venous blood samples were collected in sterile vacationers with EDTA anticoagulant. Plasma samples were immediately separated from the anti-coagulated whole blood by centrifugation at 3000g for 15 min at 4 °C. Samples were stored at −20 °C for 2 months before analysis. The Ethical Committee of Science and Technology Department of Xuanwu hospital approved the collection of these samples.

2.6 Statistical analysis

The data were expressed as mean values from duplicate measurements. The data were analyzed with GraphPad Prism 5 software version 5.03 (GraphPad Software Inc., La Jolla, CA, USA), and other statistical analyses were performed using SPSS software (version 16.0, SPSS Inc., Chicago, IL, USA). Results were analyzed by the Mann–Whitney U-test. A p-value of <0.05 was considered statistically significant.

The overall diagnostic performance of NHERF1 was assessed by the use of receiver operating characteristic (ROC) curves constructed using plasma from healthy donors and patients with lung cancer. The cut-off value of the test was calculated using the results of the ROC curve distribution, which was based on a combination of good sensitivity with high specificity. The area under the curve (AUC) for NHERF1 was determined using SPSS software (version 16.0, SPSS Inc., Chicago, IL, USA). The AUC is a summary statistic of overall diagnostic performance. The closer the AUC is to a value of one, the higher the diagnostic value of the test.

3. Results

3.1 Identification of NHERF1 pure protein

GST fusion NHERF1 protein was expressed in E. coli (BL21) and purified by means of GST affinity chromatography (Fig. 2a). NHERF1 was excised by thrombin. After the GST protein was removed by affinity to glutathione–agarose beads, NHERF1 protein was collected in the supernatant. Protein concentration was 3.95 mg mL−1 determined with a Bio-Rad Protein Assay Kit using BSA as a standard.
image file: c5ra16502d-f2.tif
Fig. 2 NHERF1 protein purified by GST affinity chromatography (a) Commassie-blue-stained SDS-polyacrylamide gels show material from each step of the chromatographic purification procedure. (M), precision plus protein standards (Bio-Rad, California, USA). (Lane 1) homogenates of E. coli BL21 without induction with IPTG; (lane 2) homogenates of E. coli BL21, expressing GST fusion NHERF1 protein induced by IPTG; (lane 3) purified GST-NHERF1 protein by GST affinity chromatography; (lane 4) total protein after thrombin digestion; (lane 5) purified NHERF1 protein. (b) NHERF1 protein identified by MS analysis. The bands of purified NHERF1 were excised from the coomassie blue-stained gel and identified by matrix assisted laser desorption/ionization orthogonal time-of flight MS. The 50 kDa band was identified as NHERF1.

Samples from each step (total five steps) of the purification procedure were applied to SDS/PAGE, and proteins were visualized by Coomassie blue staining. The purified protein from step five of the purification gave only one band at a molecular mass of 50 kDa, indicating a single polypeptide of the 50 kDa protein (Fig. 2a). The band of purified NHERF1 was excised from the Coomassie blue-stained gel and identified by matrix assisted laser desorption/ionization orthogonal time-of flight MS (Fig. 2b).

3.2 Establishment of assay conditions

To establish assay conditions, dose-response curves of anti-NHERF1 antibodies were generated. Anti-NHERF1 antibodies were prepared in AlphaLISA buffer and serially diluted. Dose-response curves of anti-NHERF1 rabbit antibodies were generated by adding 5–100 mmol anti-NHERF1 rabbit antibody with anti-NHERF1 mouse antibody ranged from 5 to 100 mmol respectively in final 50 μL AlphaLISA reactions. Anti-rabbit IgG-conjugated acceptor beads and anti-mouse IgG-conjugated donor beads both were used at 10 μg mL−1 in AlphaLISA reactions. The dose-response curves were performed in 5 μL of human plasma sample. For the dose-response curves, the peak of AlphaLISA counts appeared at 50 mmol anti-NHERF1 rabbit antibody and 10 mmol anti-NHERF1 mouse antibody. Hence, 50 mmol anti-NHERF1 rabbit antibody was finally chose to be used with 10 mmol anti-NHERF1 mouse antibody in the AlphaLISA reactions (Fig. 3).
image file: c5ra16502d-f3.tif
Fig. 3 Effect of anti-NHERF1 mouse (mo) and rabbit (ra) antibody concentration on AlphaLISA signal. 5–100 mmol anti-NHERF1 rabbit antibody was incubated with anti-NHERF1 mouse antibody (final from 5 to 100 mmol) and 10 μg mL−1 acceptor beads and 10 μg mL−1 donor beads in final 50 μL AlphaLISA reactions. The dose-response curves were performed in 5 μL of human plasma sample. The binding is dose dependent until the hook point is reached.

3.3 Method validation

3.3.1 Calibration curve, LOD and LOQ. A NHERF1 linearized standard curve (Y = 32.2X + 70.8, R2 = 0.9983) was obtained with five concentrations. The standard curve possessed an intensity range between 218 and 3325 signal counts from 5.00 to 100 ng mL−1. The LOD and LOQ values were determined to be 2.00 ng mL−1 and 5.00 ng mL−1, respectively. The upper limit of quantification (ULOQ) value was calculated to be 100 ng mL−1.
3.3.2 Precision. To ascertain the precision of the AlphaLISA assay, two experiments were performed. In the first experiment, precision was assessed by performing a number of duplicate tests of the reference standard NHERF1 with a range of 5.00–100 ng mL−1. The intra-assay RSD% was from 2.12% to 4.72%. The inter-assay RSD% was from 2.16% to 6.18%. While in the second experiment, precision was assessed by performing of three plasma samples. The intra-assay RSD% was from 1.83% to 3.62% and the inter-assay RSD% was from 2.55% to 4.12% (Table 1).
Table 1 Intra- and inter-assay precision of the AlphaLISA assay
  Intra-assay Inter-assay
Concentration (ng mL−1) RSD (%) Concentration (ng mL−1) RSD (%)
Standard NHERF1 sample
1 5.11 ± 0.24 4.72 5.10 ± 0.26 5.17
2 10.4 ± 0.40 3.80 9.94 ± 0.61 6.18
3 20.4 ± 0.48 2.36 19.8 ± 0.48 2.44
4 49.9 ± 1.71 3.43 50.0 ± 1.08 2.16
5 100.4 ± 2.13 2.12 100.2 ± 2.24 2.23
[thin space (1/6-em)]
Plasma sample
2-C1 15.2 ± 0.55 3.62 15.0 ± 0.62 4.12
1-D9 22.0 ± 0.40 1.83 22.5 ± 0.57 2.55
3-F7 62.9 ± 1.71 2.73 62.6 ± 1.90 3.03


3.3.3 Recovery. The spike-in experiments were performed to ascertain the recovery of the present AlphaLISA assay, because NHERF1 is a scaffold protein naturally existing in human plasma. The exogenous NHERF1 with three concentration levels of 10.0, 40.0 and 80.0 ng mL−1 were added to three aliquots of human plasma samples with NHERF1 at three concentrations (14.2, 33.3 and 46.2 ng mL−1), respectively. Evaluations were then made by calculating the ratio between measured and expected values of NHERF1. The percentage recovery of NHERF1 was between 94.3% and 104.8% (Table 2), suggesting that recovery of the different plasma samples was quantitative and that NHERF1 was accurately measured in the real samples.
Table 2 Analytical recovery of NHERF1 added to plasma samples
Originala (ng mL−1) Addedb (ng mL−1) Expected NHERF1 (ng mL−1) Measured NHERF1 (ng mL−1) Recovery (%)
a The volume of original plasma was 190 μL.b The volume of added exogenous NHERF1 was 10 μL.
14.2 10 14.0 13.6 97.3
40 15.5 14.8 95.7
80 17.5 17.3 99.1
33.3 10 32.1 32.9 102.5
40 33.6 33.3 98.9
80 35.6 34.0 95.5
46.2 10 44.4 41.8 94.3
40 45.9 43.8 95.4
80 47.9 50.2 104.8


3.3.4 Selectivity. To investigate the selectivity of the developed NHERF1 assay, the effect of adding other growth factor proteins, frequently measured in plasma, epidermal growth factor (EGF), vascular endothelial growth factor (VEGF) and platelet-derived growth factor (PDGF) to normal human plasma samples was assessed. The cross-reactivity was expressed as the percent ratio between measured and expected values. Results in Table 3 show that no major cross-reactivity was identified among the compounds.
Table 3 Selectivity of the AlphaLISA assay
Antigens Concentration (ng mL−1) NHERF1
Value (ng mL−1) Cross reactivity rate (%)
EGF (ng mL−1) 1000 1.47 0.15
PDGF (ng mL−1) 100 0.57 0.57
VEGF (ng mL−1) 250 0.25 0.10


3.3.5 Interference. The effect of hemolysis, lipemia and bilirubinemia was assessed by adding hemolysate, bilirubin (unconjugated), triglyceride and sodium ascorbate to the plasma samples. The recoveries of NHERF1 in these samples were calculated from the AlphaLISA counts of NHERF1 determined before and after addition of interfering substances. The recoveries were between 90.2% and 108.0% (Table 4).
Table 4 Interference from addition of hemolysate, bilirubin, triglyceride, and ascorbic acid to patients plasma samples
Interfering substance AlphaLISA counts of NHERF1 Recovery (%)
Interfering substance Plasma sample Spike-in sample
200 ng mL−1 hemoglobin 120 1732 1642 94.8
50 ng mL−1 bilirubin 123 1036 934 90.2
1000 ng mL−1 triglyceride 121 1381 1481 107.2
200 ng mL−1 ascorbic acid 112 751 811 108.0


3.4 AlphaLISA assay

To determine clinical significance of NHERF1 contents in plasma for diagnosis of NSCLC, we evaluated contents of NHERF1 in plasma obtained from 75 NSCLC patients and 18 healthy donors by AlphaLISA. Means of contents for NHERF1 in the plasma of cancer patients and healthy donors were 31 (SD 16) and 22 (SD 7), respectively. The levels of NHERF1 protein in plasma from patients were significantly higher than those in the healthy group (p = 0.0004) (Fig. 4a).
image file: c5ra16502d-f4.tif
Fig. 4 Contents of NHERF1 were evaluated in plasma obtained from 75 NSCLC patients and 18 healthy donors by AlphaLISA. (a) NHERF1 protein levels are increased in lung cancer patient plasma. NHERF1 protein levels were analyzed by AlphaLISA, as described in Materials and methods. Grouped data indicate a significant increase in the median value of patient NHERF1 expression in lung cancer patient plasma with respect to the median value found in the healthy donors. (b) Receiver operating characteristic (ROC) curve of the concentration of NHERF1 in plasma to predict precursors of patients with lung cancer. The area under the ROC curve was 0.728. The cut-off value for the detection of lung cancer was 19.9 ng mL−1 with 77.3% sensitivity and 66.7% specificity.

ROC curves with corresponding AUR for NHERF1 contents in plasma from cancer vs. control cases are shown in Fig. 4b. Based on the evaluation of the ROC curves for NHERF1, the optimal cut-off was 19.9 ng mL−1, and the corresponding sensitivity and specificity were calculated. Based on the cut off, NHERF1 increased level was found in 58 of 75 and 6 of 18 control samples from cancer patients and healthy donors, resulting in 77.3% sensitivity and 66.7% specificity in the diagnosis of lung cancer. The data suggested that measuring contents of NHERF1 could provide a potential diagnostic tool for NSCLC.

4. Discussion

As a high sensitivity homogeneous immunoassay with wide dynamic range and robust performance, AlphaLISA has been successfully applied to the detection of soluble proteins and particular antigens.20,22,23 In this study, a 384-well plate-based homogeneous chemiluminescent sandwich immunoassay has been established for the quantification of NHERF1 in human plasma. During the period of the design of the assay, the AlphaLISA kit with streptavidin-coated donor beads and anti-rabbit IgG-coated acceptor beads was firstly selected for the assay according to the published literatures.18,20 One biotinylated-antibody and another rabbit derived antibody recognizing and binding to NHERF1 protein in no cross peptide segment were required to support the use of the kit in the AlphaLISA reactions. However, the biotinylated NHERF1 antibodies were not easily to obtain, thus the assay program had to been adjusted. As shown in Fig. 1, the samples were incubated with one anti-NHERF1 rabbit antibody (recognizing 128–249 aa) and another anti-NHERF1 mouse monoclonal antibody (recognizing 310 aa). The kit contains anti-mouse IgG-coated donor beads and anti-rabbit IgG-coated acceptor beads. The resulting complex was formed between acceptor beads and NHERF1 rabbit antibody–analyte–NHERF1 mouse antibody–donor beads, and was quantified in the well by excitation of the donor beads with laser irradiation at 680 nm. The specific delayed sharp chemiluminescent emission peak was monitored at about 615 nm. It was indicated that this kind of sandwich immunoassay enables the quantification of free NHERF1 in the plasma using the relatively cheaper and easily obtained reagents without any treatment. The adjusted and improved AlphaLISA protocol in the present assay could be used not only for the detection of NHERF1 protein but also other proteins in plasma, which makes the technology more versatile.

Identification of assays that are easy-to-use, sensitive, and precise, while offering lower labor and material costs and increased throughput and productivity, is a common goal among researchers conducting drug discovery, preclinical studies, and basic research. AlphaLISA technology has the ability to run large numbers of samples using a small sample volume in a homogeneous environment, while providing excellent sensitivity and an expanded dynamic range relative to ELISAs. These assays allow increasing throughput while decreasing hands-on and total assay time when compared to standard ELISA protocols. The assay can be handled manually or as an automatic setup, which facilitates assay development and makes the technology more versatile.

NHERF1-AlphaLISA assay is very sensitive with a detection limit of 2.00 ng mL−1, which allows the measurement of low concentrations of NHERF1. The higher sensitivity was obtained because of the amplified signal resulting from the 60[thin space (1/6-em)]000 singlet oxygen molecules generated by each donor bead. At these low signal levels, an assay may generate false results because of interference. However, the assay was found to be robust to plasma interference. Thus, the accuracy, even at very low concentrations of NHERF1, should be acceptable and robust.

Homogenous assay systems are potentially more sensitive to plasma interference. The most prominent types of general interference are inner filter effects and singlet oxygen quenchers. By using Eu complex in the acceptor beads emitting light at 615 nm, the inner filter effects are minimal when testing plasma. Ascorbic acid and heme iron are the main potential singlet oxygen quenchers in plasma. However, our results indicated that the assay was unaffected by interfering substances including hemolysate, bilirubin, triglyceride, and ascorbic acid at concentrations that might be expected in a routine clinical laboratory setting. In addition, cross-reactivity data with major interfering protein factors in plasma showed the assay was highly specific for NHERF1.

Data from a number of laboratories have clearly shown that increased NHERF1 expression in the primary tumor is of clinical significance,12,27–29 in that NHERF1 expression is increased in tumors as compared with the contiguous non-involved tissue,28,30 and the relative level of increased NHERF1 protein is significantly associated with a more aggressive phenotype and a poor prognosis. Recent epidemiological, preclinical and clinical studies have suggests that the biomarker in plasma is of biological and clinical importance for patients with cancer. According to the record in GeneCards database, the content of NHERF1 is about 33 ppm in human plasma detected by Spectral counting. However, no studies have reported the method for the measurement of plasma NHERF1 and the changes of NHERF1 in plasma correlated with cancer. For this reason, we analyzed the level of NHERF1 by AlphaLISA in the plasma of those of NSCLC and healthy donors. We observed that NHERF1 is indeed more highly over-expressed in plasma of patients with lung cancer compared with healthy donors. These data are in line with the recent study on the expression of NHERF1 in the cancer and paraneoplastic tissue. For example, NHERF1 is reported highly over-expressed in breast14 and colon tumor tissues13 and this over-expression is associated with increasingly aggressive clinical characteristics and with poor prognosis.13,15 Unfortunately, there is still no report about the expression of NHERF1 in the tissues of lung cancer and their relevance to clinical outcome. To identify the expression of NHERF1 in lung cancer, we analyzed the gene expression in the TCGA database. Results showed NHERF1 expression was significantly increased in lung adenocarcinoma tissues when compared with the normal tissues of patients in TCGA dataset (ESI). This result was consistent with the contents of NHERF1 in plasma of patients with NSCLC. These data indicate that NHERF1 expression could represent a new prognostic factor in patients with NSCLC. The relationships between these findings and the risk of lung cancer need further investigation.

5. Conclusion

In this study, a novel AlphaLISA assay was developed to quantify NHERF1 in human plasma. The favorable performance characteristics of NHERF1-AlphaLISA assay including no radioactive waste, relatively simple and rapid operation within 3 h, low costs with 5 μL samples for each reaction, high-throughput assay with 384 samples quantified in one batch, high sensitivity with low LOD of 2.00 ng mL−1 and a wide linear range with from 5.00 to 100 ng mL−1. Therefore, the NHERF1-AlphaLISA assay may be considered as a model system to measure the tumor maker in biological samples for biomedical studies and clinical examination. Moreover, our results confirm the involvement of NHERF1 in plasma associated with neoplastic diseases. The measurement of NHERF1 levels in plasma has the potential to extend the use of NHERF1 as tumor biomarker in NSCLC, supporting the TCGA dataset data. Although the 77.3% sensitivity and 66.7% specificity are still not yet efficient for routine clinical application, the detection of NHERF1 content in plasma seems still to be a promising biomarker in the detection of NSCLC. The result might indicate the need to develop a strategy for simultaneous assessment of a panel of tumor-specific biomarkers in plasma for highly sensitive and specific diagnosis of lung cancer. More studies about NHERF1 in plasma associated with neoplastic diseases need investigation, for example, the relationship between NHERF1 contents in plasma and clinic-pathological factors such as histological grade, NPI of patients.

Acknowledgements

This work was supported by National Natural Science Foundation of the People's Republic of China (No. 81572704) and the Foundation of Beijing Educational Committee (No. KM201310025003).

References

  1. C. L. Wen, K. Y. Chen, C. T. Chen, J. G. Chuang, P. C. Yang and L. P. Chow, J. Proteomics, 2012, 75, 3963–3976 CrossRef CAS PubMed .
  2. L. M. Guldbrandt, T. R. Rasmussen, F. Rasmussen and P. Vedsted, PLoS One, 2014, 9, e112162 Search PubMed .
  3. C. Saponaro, A. Malfettone, T. S. Dell'Endice, A. E. Brunetti, P. Achimas-Cadariu, A. Paradiso and A. Mangia, Cancer Biomarkers, 2014, 14, 177–184 Search PubMed .
  4. H. Cheng, J. Li, R. Fazlieva, Z. Dai, Z. Bu and H. Roder, Structure, 2009, 17, 660–669 CrossRef CAS PubMed .
  5. J. R. Molina, N. K. Agarwal, F. C. Morales, Y. Hayashi, K. D. Aldape, G. Cote and M. M. Georgescu, Oncogene, 2012, 31, 1264–1274 CrossRef CAS PubMed .
  6. J. Ali Khajeh, J. H. Ju, M. Atchiba, M. Allaire, C. Stanley, W. T. Heller, D. J. Callaway and Z. Bu, J. Mol. Biol., 2014, 426, 2755–2768 CrossRef CAS PubMed .
  7. E. L. Kreimann, F. C. Morales, J. de Orbeta-Cruz, Y. Takahashi, H. Adams, T. J. Liu, P. D. McCrea and M. M. Georgescu, Oncogene, 2007, 26, 5290–5299 CrossRef CAS PubMed .
  8. Y. Pan, E. J. Weinman and J. L. Dai, Breast Cancer Res., 2008, 10, R5 CrossRef PubMed .
  9. S. Cheng, Y. Li, Y. Yang, D. Feng, L. Yang, Q. Ma, S. Zheng, R. Meng, S. Wang, S. Wang, W. G. Jiang and J. He, FEBS Lett., 2013, 587, 3289–3295 CrossRef CAS PubMed .
  10. H. Li, B. Zhang, Y. Liu and C. Yin, Med. Oncol., 2014, 31, 162 CrossRef PubMed .
  11. J. R. Molina, F. C. Morales, Y. Hayashi, K. D. Aldape and M. M. Georgescu, Cancer Res., 2010, 70, 6697–6703 CrossRef CAS PubMed .
  12. Y. Hayashi, J. R. Molina, S. R. Hamilton and M. M. Georgescu, Neoplasia, 2010, 12, 1013–1022 CrossRef CAS .
  13. M. Troncoso, F. D. Cuello Carrion, E. Guinazu, M. A. Fanelli, M. Montt-Guevara, R. L. Cabrini, R. W. Caron and E. L. Kreimann, Horm. Cancer, 2011, 2, 214–223 CrossRef CAS PubMed .
  14. A. Bellizzi, M. R. Greco, R. Rubino, A. Paradiso, S. Forciniti, K. Zeeberg, R. A. Cardone and S. J. Reshkin, Int. J. Oncol., 2015, 46, 1214–1224 Search PubMed .
  15. T. Karn, E. Ruckhaberle, L. Hanker, V. Muller, M. Schmidt, C. Solbach, R. Gatje, M. Gehrmann, U. Holtrich, M. Kaufmann and A. Rody, Breast Cancer Res. Treat., 2011, 130, 409–420 CrossRef CAS PubMed .
  16. A. Bellizzi, A. Malfettone, R. A. Cardone and A. Mangia, Breast Care, 2010, 5, 86–90 CrossRef .
  17. A. Malfettone, C. Saponaro, A. Paradiso, G. Simone and A. Mangia, BMC Cancer, 2012, 12, 106 CrossRef PubMed .
  18. A. He, T. C. Liu, Z. N. Dong, Z. Q. Ren, J. Y. Hou, M. Li and Y. S. Wu, J. Clin. Lab. Anal., 2013, 27, 277–283 CrossRef CAS PubMed .
  19. M. Bielefeld-Sevigny, Assay Drug Dev. Technol., 2009, 7, 90–92 CrossRef CAS PubMed .
  20. E. Cauchon, S. Liu, M. D. Percival, S. E. Rowland, D. Xu, C. Binkert, P. Strickner and J. P. Falgueyret, Anal. Biochem., 2009, 388, 134–139 CrossRef CAS PubMed .
  21. R. M. Eglen, T. Reisine, P. Roby, N. Rouleau, C. Illy, R. Bosse and M. Bielefeld, Curr. Chem. Genomics, 2008, 1, 2–10 CrossRef CAS PubMed .
  22. A. Mechaly, N. Cohen, S. Weiss and E. Zahavy, Anal. Bioanal. Chem., 2013, 405, 3965–3972 CrossRef CAS PubMed .
  23. H. Waller, U. Chatterji, P. Gallay, T. Parkinson and P. Targett-Adams, J. Virol. Methods, 2010, 165, 202–210 CrossRef CAS PubMed .
  24. S. Cheng, J. Zhang, P. Zhu, Y. Ma, Y. Xiong, L. Sun, J. Xu, H. Zhang and J. He, J. Neurochem., 2010, 112, 588–598 CrossRef CAS PubMed .
  25. S. Fulda, F. Huang, F. Nilsson, M. Hagemann and B. Norling, Eur. J. Biochem., 2000, 267, 5900–5907 CrossRef CAS .
  26. L. Yang, Y. Wang, P. Chen, J. Hu, Y. Xiong, D. Feng, H. Liu, H. Zhang, H. Yang and J. He, Endocrinology, 2011, 152, 4537–4549 CrossRef CAS PubMed .
  27. A. Malfettone, N. Silvestris, C. Saponaro, G. Ranieri, A. Russo, S. Caruso, O. Popescu, G. Simone, A. Paradiso and A. Mangia, J. Cell. Mol. Med., 2013, 17, 1025–1037 CrossRef CAS PubMed .
  28. M. M. Georgescu, F. C. Morales, J. R. Molina and Y. Hayashi, Curr. Mol. Med., 2008, 8, 459–468 CrossRef CAS .
  29. A. Bellizzi, A. Mangia, A. Malfettone, R. A. Cardone, G. Simone, S. J. Reshkin and A. Paradiso, Histopathology, 2011, 58, 1086–1095 CrossRef PubMed .
  30. A. Mangia, A. Chiriatti, A. Bellizzi, A. Malfettone, B. Stea, F. A. Zito, S. J. Reshkin, G. Simone and A. Paradiso, Histopathology, 2009, 55, 600–608 CrossRef PubMed .

Footnotes

Electronic supplementary information (ESI) available. See DOI: 10.1039/c5ra16502d
These authors contribute equally in this paper.

This journal is © The Royal Society of Chemistry 2015