One-pot in situ molten salt synthesis of octahedral Fe3O4 for efficient microwave absorption application
Chaomei Shanga,
Guangbin Ji*a,
Wei Liua,
Xingmiao Zhanga,
Hualiang Lva and
Youwei Dub
aCollege of Material Science and Technology, Nanjing University of Aeronautics and Astronautics, Nanjing 210016, P. R. China. E-mail: gbji@nuaa.edu.cn; Fax: +86-25-5211-2626/+86-25-5211-2900; Tel: +86-25-5211-2902
bLaboratory of Solid State Microstructures, Nanjing University, Nanjing 210093, P. R. China
First published on 10th September 2015
Abstract
An easy, template-free one-pot method was carried out for mass preparation of microscale octahedral Fe3O4. Thermal decomposition and a flux-mediated method were combined by directly introducing ferric acetate into the molten flux, which is called an in situ molten salt method. The morphology, magnetic properties, electromagnetic parameters, and microwave absorption behaviors were characterized. With the right octahedral temperature (800 °C), the iron oxide has a strong electrostatic interaction with salt ions leading to a perfect octahedron morphology. The reflection loss of the sample annealed at 800 °C (named F-800) can reach −23.67 dB at a frequency of 15.24 GHz with only a 1.4 mm coating thickness. The strongest microwave absorption ability may be ascribed to the unique morphology, best impedance matching and large attenuation value.
Introduction
With the rapid development of electromagnetic techniques, microwave absorbing materials are in demand not only in military equipment, but also in civilian devices due to the fact that electromagnetic waves can be released from both radar and other common machines like wireless networks, communication equipment and personal digital devices.1 In order to protect us from the harm caused by the electromagnetic system, microwave absorbing materials with properties of being light-weight, and having a thin-thickness, broad effective frequency and strong absorption are needed.2,3 In the past few years, magnetic microwave absorbing materials have been widely investigated. Among them, Fe3O4, as a typical magnetodielectric material with both magnetic loss and dielectric loss, is one of the most attractive microwave absorbing materials due to its high resistivity and low cost.4,5 Meanwhile, the permittivity of Fe3O4 is low, which is beneficial for excellent impedance matching. It is well known that numerous studies show that the morphology and size of particles are of great importance for their resultant properties and applications. Flower-like Fe3O4 shows a maximum reflection loss of −46 dB with a thickness of 5 mm.6 Liu and his co-workers reported the basalt fiber/microsphere Fe3O4 composite with excellent microwave absorption behaviour, and the maximum reflection loss reaches −31.1 dB at 5 mm.7 An ellipsoidal nanorattle Fe3O4/CuSiO3 composite was fabricated by a hydrothermal method with the optimal reflection loss value up to 30 dB with a matching thickness of 2 mm.8 Other geometries, such as dendrite-like,9 bowl-like Fe3O4 hollow spheres/reduced graphene oxide10 and porous Fe3O4 decorated graphene11 have also been widely studied. However, little attention has been paid to the octahedron which is a kind of polyhedron with eight equivalent equilateral triangular faces, six polyhedron vertices and twelve edges. The anisotropic shape and microstructure of the octahedron may present new physicochemical properties and a wonderful microwave absorption performance.12–14 Specially, the anisotropic particles present an attractive magnetic property as a result of shape anisotropy.15 Meanwhile, the octahedron structure is also beneficial for scattering reflection of microwave absorption.16 It should be noted that the reported Fe3O4 based samples all achieved excellent microwave absorption performance at a thick thickness, which is not applicable for practical application. Especially, the preparation processes are all of multiple steps with organic solvents, templates or surfactants involved17–19 that are too sticky to be filtered and washed off. Therefore, green and facile synthesis of Fe3O4 with excellent microwave absorption properties with a thin-film thickness still remains a challenge.Molten salt synthesis, a solvent-free method, can help to control the structure of exposed surfaces of materials so as to tailor the optical, electronic, catalytic and magnetic properties,20–23 and the obtained products are of a specific morphology with good crystallization and fewer defects.24 Meanwhile, the salts, such as, NaCl, KCl, and NaF are water-soluble, which means they can be easily washed off. At the same time, the molten salt may hinder the products agglomeration or weak agglomeration. In our previous work, we have successfully synthesized 0.5–1.5 μm octahedral CoFe2O4 crystals via the molten salt synthesis route.25 Other research groups reported the preparation of particles such as ZnO·Fe3O4 hybrids,26 sub-micron sized NiFe2O4 (ref. 27) and plate-like W-type barium ferrites.28 Although there have been numerous publications about molten salt synthesis, to the best of our knowledge, it is rarely reported to use the molten salt method to acquire Fe3O4.
In this study, we introduce a thermal decomposition method that doesn't cover any reducing agent, surfactant or structure director. Surprisingly, Fe3O4 in large scale amounts can be obtained by directly decomposing iron organic compounds. Nevertheless, the obtained samples are of irregular morphology and tend to aggregate at a high temperature. Thus, a novel preparation method combining thermal decomposition with molten salt was developed, which can be named as the in situ molten salt method.
Herein, a one-step and template-free synthetic process for octahedral Fe3O4 via directly decomposing an Fe organic compound with molten salt fluxes was proposed. The obtained products have strong microwave absorption abilities with thin thicknesses below 1.5 mm, which may result from its good impedance matching, special morphology, multiple scattering and high magnetic loss. Meanwhile, the thermolysis temperature is used to tailor the crystal shape, size and properties. It turned out that the optimal reflection loss realized at the annealing temperature of 800 °C and the maximum reflection loss value is 23.67 dB at 15.24 GHz with the matching thickness of 1.4 mm. The thin thickness will reduce the load on aircraft for practical applications.
Experimental section
Materials
The ferrite acetate was purchased from Shanghai Xinbao Fine Chemical Industry in China. All the regents used were analytical grade without any further purification.Preparation
During the experimental process, a certain amount of ferric acetate was put into one alumina ark alone and annealed at 700 °C for 5 h with a heating rate of 2 °C min−1. After it cooled to room temperature, the product was collected and named as P-700. In addition, the experiments carried out with molten salts are depicted as follows. The ferric acetate was mixed with molten salts, NaCl and KCl (with a mass ratio of 1), and ground in the presence of a small amount of ethanol to obtain homogeneous distributed mixtures. After the mixtures were dried, they were ground for a second time and the uniform mixtures were transferred into alumina arks. Then the mixtures were calcined at different temperatures of 700, 800 and 900 °C with a heating rate of 2 °C min−1 for 5 h in a tube furnace. Subsequently, the cooled samples were washed thoroughly with deionized water to remove the unwanted impurities and collected by magnetic separation. Then the samples were dried over night in a vacuum at 60 °C and the final products were denoted as F-700, F-800 and F-900 respectively.Characterization
The composition and phase purity of the as-prepared products were determined by X-ray diffraction (XRD, Bruker D8 ADVANCE) with Cu Kα incident radiation (λ = 1.54 Å) at 40 kV voltage and 40 mA current. XRD patterns were recorded from 10–90° (2θ). The size distribution and morphologies of the products were characterized by field emission scanning electron microscopy (FE-SEM, Hitachi S-4800). Thermogravimetric analysis (TGA) was carried out using a NETZSCH STA 449C from 20 to 1000 °C with a heating rate of 5 °C min−1 in flowing N2. Magnetic hysteresis loops were performed by a vibrating sample magnetometer (VSM, Lakeshore, Model 7400 series) under an applied magnetic field of 10 kOe. The complex permeability and complex permittivity were analyzed by the coaxial-line method with an Agilent PNA N5224A vector network analyzer in the range of 2–18 GHz. During the measuring process, the as-prepared F-X (X represents the reaction temperature) samples were mixed with paraffin matrixes uniformly and then pressed into a cylindrical shaped compact with a production proportion of 80 wt%.Results and discussion
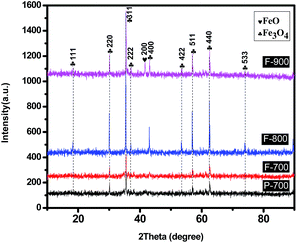
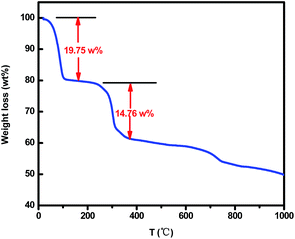
Fig. 1 shows the XRD patterns of the as-synthesized products. It can be obviously seen that all of the samples have good crystallinity since a high temperature thermal treatment can improve the crystallinity and enlarge the crystal size. Among them, P-700, F-700 and F-800 show sharp and strong peaks, which can be perfectly indexed to the magnetite Fe3O4 structure (JCPDS card no. 76-1849), indicating that the ferric acetate has been thermally decomposed into Fe3O4. No other impurities were detected, suggesting the obtained products are pure phase. The peaks of F-800 are the strongest and sharpest, indicating the best crystallization. Whereas, the diffraction peaks of F-900 are slightly weaker than that of F-800 and there is a small peak at 41.7° which corresponds to the (200) plane of FeO. It can be attributed to the increased temperature that promotes the existing hydrocarbon or carbon monoxide in starting to reduce Fe3O4 to FeO. In order to figure out the detailed thermal decomposition process, TG analysis was carried out.As is displayed in Fig. 2, there is a dramatic mass loss before 200 °C which is caused by the crystal water's evaporation.29 With the increasing temperature, there comes another stage of weight loss that can be attributed to the formation of Fe3O4. Generally speaking, the atom radius of C is longer than that of O, so the bond length of C–C is longer than C–O, which leads to the easier breakage of the C–C bond. In addition, according to the relative data, the bond energy of a C–C bond is 347.7 kJ mol−1, and the bond energy of C–O is 351 kJ mol−1, which further demonstrate the easier breakage of the C–C bond than the C–O bond. Thus the reactants lost three methyls and fabricated ferric oxalate and a reducing gas, ethane. The reaction process can be depicted by the following equations.
| Fe(CH3COO)3·xH2O → Fe(CH3COO)3 + xH2O |
| 2Fe(CH3COO)3 → Fe2(C2O4)3 + 3C2H6 |
| Fe2(C2O4)3 → Fe3O4 + COy |
Along with the increased temperature, the formed ferric oxalate decomposed into Fe3O4 and carbon monoxide.30 So there was a weight loss between 250 and 300 °C. When the temperature went up to more than 800 °C, a small amount of Fe3O4 was gradually reduced to FeO by the existing hydrocarbon and carbon monoxide. That is why FeO is present in F-900 (see Fig. 1).
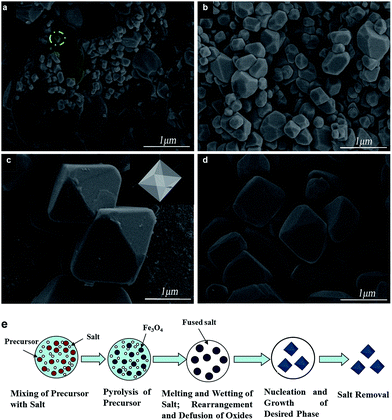
The morphology and size of the products were investigated by field-emission SEM, as shown in Fig. 3. Among them, Fig. 3a is the image of the Fe3O4 obtained by directly decomposing ferric acetate without adding any molten salt or other reagents at 700 °C. Apparently, the F-800 is the largest in size since the molten salt method can help the crystal grow larger. However, F-900 is smaller than F-800 and larger than F-700. When it comes to the morphology, the obtained sample of P-700 didn't develop very well. From Fig. 3a, they are of irregular shapes and there are some nanoparticles adhered on the blocks aggregated by other sized particles. One can see that the shape of F-700 is greatly different from that of P-700 (see Fig. 3b). It shows oriented growth, octahedron-like structure and becomes uniform to a certain degree, but without cuspidal polyhedron vertices because the melting points of NaCl and KCl are 772 °C and 710 °C (mass ratio is 1), respectively, the temperature of 700 °C is less than the melting point and won't make the salt melt completely. So, there is not enough fluid molten salt around the as-prepared samples. When it comes to F-800 (Fig. 3c), the product presents a standard octahedral shape with regular facets, clear edges and sharp corners. And it is monodispersed with a uniform size of 1–2 μm, which is obviously bigger than F-700. Seen from Fig. 3d, the F-900 doesn't develop well. The clear edges and sharp corners have disappeared and the particles become smaller. Because the annealing temperature is much higher than the melting temperature, the KCl and NaCl will evaporate, leading to the decrease of salts in the fluid.31
In Fig. 3e, the synthetic protocol for preparing octahedral Fe3O4 is illustrated. Firstly, the ferric acetate mixed with the molten salt uniformly. In order to get a homogenous mixture, some ethanol should be added to improve the liquidity of the mixture, thus making the mixing process easier. Then, the materials were calcined in a tube furnace under a N2 atmosphere. When the temperature reaches 300 °C, the Fe3O4 particles start forming. On the one hand, the driving force of one crystal is highly associated with its inherent crystal structure.32 Therefore, Fe3O4 grows along its inverse spinel cubic structure (see the particle in the green circle of Fig. 3a). As a kind of single-crystal, Fe3O4 is sure to be enclosed by crystallographic facets that have a lower energy.33,34 According to the confirmed general sequence of the surface energy of Fe3O4: γ{111} < γ{100} < γ{110},35 the {100} plane grows much faster than the {111} plane and finally vanishes, and the particles expose their {111} planes and are enclosed by it (inset of Fig. 3c). Therefore the octahedral Fe3O4 particles are formed following the principle of minimum surface energy for the inverse spinel cubic structure. On the other hand, electrostatic interactions could be an effective way to lower the surface energy of polar surfaces. With the temperature continuously increasing, the salts are gradually melting as it reaches 700 °C. The formed Fe3O4 flowed through the molten salt and dissolved in the flux. Then the renucleation and phase growth process occurs.24 It is well known that the chemically active crystal planes usually grow fast and eventually disappear and those exposed crystal planes are usually stable and less active.36 Therefore, with the molten salts added, the chemically active crystal planes will have strong electrostatic interactions with the ions of the molten salt, Na+ and Cl− bind with O2− and Fe2+, Fe3+ ions, respectively, causing the reduction of the surface energy and growth rate.37 Thus, the octahedron-like particles are formed. In addition, according to Ostwald ripening, larger particles are generated at the cost of small ones, along with the high surface energy of small primary particles being greatly reduced, which leads to the decrease of the whole surface energy.38,39 Thus, the particles grow to the microscale. Above all, the octahedral Fe3O4 can certainly be harvested.
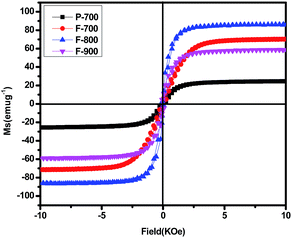
It is well known that the magnetic characteristic is closely related to the size, crystallinity, shape and structure of the material.9 The hysteresis loops of P-700, F-700, F-800 and F-900 are displayed in Fig. 4. As can be seen, there are big differences among the saturation magnetization (Ms) of the four samples. The Ms value of sample P-700 is about 24 emu g−1, which is quite a bit smaller than that of the others due to its small size. The Ms values of F-700, F-800, F-900 are much higher with respect to P-700. However, the variation trend of Ms doesn't keep going up. It is a U-shaped variation trend16 with a maximum of 86 emu g−1 at 800 °C because of its larger size, free defects and perfect crystallinity.9 Meanwhile, the Ms values of F-700 and F-900 are inferior to F-800 which corresponds to the SEM images. And as there is a small amount of FeO, the Ms value of F-900 is surely lower than that of F-700. In order to figure out the influence of the Ms value on the microwave absorption ability, the reflection loss of the samples is calculated.
According to the transmit line theory, the relative formula is summarized as in the following equations using the relative complex permittivity and permeability at a given frequency.9
 | (1) |
RL (dB) = 20![[thin space (1/6-em)]](https://www.rsc.org/images/entities/char_2009.gif) log[(Zin − Z0)/(Zin + Z0)] log[(Zin − Z0)/(Zin + Z0)]
| (2) |
| tm = nc/4fm(εrμr)1/2 | (3) |
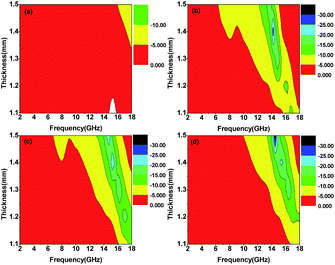
Among them, P-700 has a poor microwave absorption ability (see Fig. 5a). The minimum RL values of P-700 are all larger than −10 dB (corresponding to 90% attenuation) with respect to the five thicknesses. When inducing molten salt into the precursor, the RL values are almost less than −10 dB. As can be seen from Fig. 5b, the microwave absorption behaviour of F-700 is obviously better than that of P-700. The minimum RL values of F-700 and F-900 (in Fig. 5b and d) are all around −10 dB when the thicknesses are 1.1 mm and 1.2 mm. When it comes to F-800 (in Fig. 5c), the minimum RL values of the five thicknesses are all less than −15 dB and the effective bandwidth is much broader than the other three. In Fig. 6, the microwave absorption performances of the four samples are further compared. In accordance with the data in Fig. 5, the map of F-800 in Fig. 6c indicates the broadest effective bandwidth among the four samples, no matter if the effective bandwidth is RL ≦ −10 dB or RL ≦ −20 dB. As for F-700 and F-900, the effective bandwidth of F-900 is obviously broader than that of F-700. Since an optimal microwave absorption material is characterized by strong absorption and an effective broad bandwidth, F-800 is definitely the best microwave absorption material. In addition, the thickness is a key factor that we pursue to realize the excellent microwave absorption property. For the Fe3O4 octahedral microstructures, the minimum RL of −23.67 dB with the sample thickness of 1.4 mm is better than those in the previous reports, as listed in Table 1. The thickness of the reported materials is too thick which will limit their practical application. And most of them are no better than F-800. Besides, the detailed reasons for the materials' obvious differences in their performance will be explained in the following.
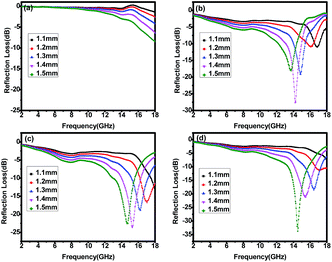 | ||
| Fig. 5 Microwave reflection losses of (a) P-700, (b) F-700, (c) F-800 and (d) F-900 at different thicknesses. | ||
| Sample | Thickness | RLmin | Ref. |
|---|---|---|---|
| Dendrite-like Fe3O4 | 1.5 mm | −23 dB | 9 |
| Basalt fiber/Fe3O4 | 5 mm | −31.1 dB | 7 |
| RGO–Fe3O4 | 2 mm | −16 dB | 42 |
| Ag@Fe3O4/RGO | 1.5 mm | −10 dB | 43 |
| Fe3O4 nanospheres | 1.5 mm | −9 dB | 44 |
| Submicron-sized hollow Fe3O4 hemispheres | 2 mm | −12 dB | 18 |
| Fe3O4 micro-spheres | 1.5 mm | −15 dB | 45 |
| Fe3O4 nanoparticles | 1.5 mm | −5 dB | 46 |
| Octahedral Fe3O4 | 1.4 mm | −23.67 dB | This study |
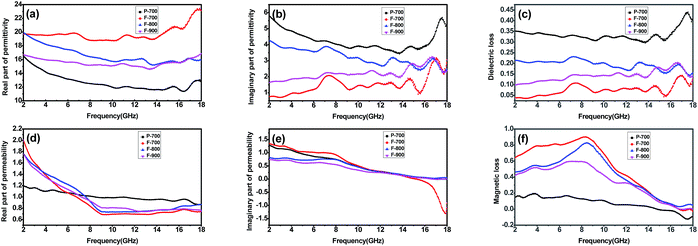
In order to illustrate the possible reasons for their microwave absorption differences, the relative complex permeability and permittivity are presented. The real and imaginary parts of the complex relative permittivity (ε′, ε′′) and permeability (μ′, μ′′) are exhibited in Fig. 7. Clearly, it can be seen that the real part of permittivity of F-800 slightly decreases from 20 to 16 in the 2–18 GHz range and the imaginary part of permittivity of F-800 also slightly decreases from 4.5 to 2.2 in which several resonance peaks can be observed. This trend can also be seen for the other samples except F-700. It is worthy to note that the imaginary part of permittivity of F-800 is the largest among the samples prepared via the molten salt method which guarantees its strong microwave absorption properties. F-700 presents the highest ε′ which might cause an impedance mismatch and do harm to the microwave absorption properties. Meanwhile, the ε′′ of F-700 is the lowest and thus leads to the lowest dielectric loss. In order to compare the microwave absorption ability, the dielectric loss tangents of others were also calculated and the results are shown in Fig. 7c. It can be seen that F-800 has the largest dielectric loss tangent in almost all of the frequency range compared with F-700 and F-900, indicating that appropriate thermal treatment plays a key role in the behaviour of the dielectric loss. Although P-700 has the largest tangent, the poor magnetic loss restricts its overall performance (see Fig. 7f). In addition, the permeability of the samples shows an obvious decrease with increasing frequency. An interesting phenomena can be seen that the μ′ of the F-700, F-800 and F-900 is much larger than P-700. According to the formula:
 | (4) |
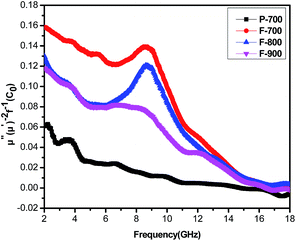
Generally speaking, the magnetic loss of microwave absorption materials originates from various kinds of losses, such as domain wall displacement loss, hysteresis loss, eddy current effect, exchange and natural resonance. However, the domain wall displacement usually occurs in the high frequency spectrum of 106–108 Hz, so there is no domain wall displacement in the 2–18 GHz range. And the hysteresis loss is commonly negligible in a weak applied field. As for eddy current effect, it is associated with the diameter (d) and the electric conductivity (σ), the relationship can be summarized as:47 μ′′ ≈ 2πμ0(μ′)2σd2f/3. In which μ0 is the vacuum permeability and f is the applied frequency. From the equation, it can be deduced that, if the magnetic loss of one material is arising from the eddy current effect only, the μ′′(μ′)−2f−1 = 2πμ0σd2/3 = C0 of the material should be a constant. Whereas, the μ′′(μ′)−2f−1 values for P-700, F-700, F-800 and F-900 vary with increasing frequency (see Fig. 8). Therefore, the eddy current effect is not contributing to the magnetic loss of the four samples.
As is displayed in Fig. 7e, there are broad weak peaks at low frequency, indicating natural resonance behaviours. Since no peaks can be seen at high frequency, the magnetic loss can not originate from exchange resonance. Hence, the magnetic loss is supposed to arise from natural resonance. Moreover, according to the rule of impedance matching,48 when it is close to the ideal mode, ε′ = μ′ and ε′′ = μ′′ (see the relative formula below), the microwave absorption of the absorber will achieve a great performance.
| μr = μ′ − iμ′′, εr = ε′ − iε′′ | (5) |
In order to evaluate the attenuation behaviour of one material, the attenuation constant α equation is established.48,49
 | (6) |
According to the equation, the conducted attenuation constant is depicted in Fig. 9. The value of P-700 is sure to be the lowest one. That is consistent with the RL value in Fig. 5 and 6. For F-800, the α value is the largest in the whole. In addition, the octahedral particles randomly distributed in the matrix can cause multiple scattering, which makes the microwave travel for longer in the material thus dissipates more energy inside.16 Above all, F-800 is characterized with both good impedance matching and a high attenuation constant. These factors contribute to its great microwave absorption behaviour.
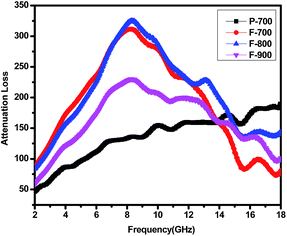 | ||
| Fig. 9 Attenuation constant of samples/paraffin composites versus frequency of P-700, F-700, F-800 and F-900. | ||
Conclusion
In summary, the octahedral structure of Fe3O4 is successfully synthesized by the combination of thermal decomposition with a molten salt method. At the same time, the products can be harvested in a large scale. By tuning the reaction temperature, different shapes of the as-prepared samples were obtained. The permeability and permittivity are investigated. The sample prepared at 800 °C demonstrated excellent electromagnetic properties, which are ascribed to its good impedance matching and high attenuation value. The best reflection loss is −23.67 dB at a frequency of 15.24 GHz with a thickness of only 1.4 mm. Therefore, F-800 exhibits a most attractive application for electromagnetic wave absorption. In addition, it also can be applied in the field of absorption, catalysis and many other areas.Acknowledgements
Financial support from the National Natural Science Foundation of China (No. 11575085), the Aeronautics Science Foundation of China (No. 2014ZF52072), and the Priority Academic Program Development of Jiangsu Higher Education Institutions is gratefully acknowledged.References
- J. Jiang, D. Li, D. Y. Geng, J. An, J. He, W. Liu and Z. D. Zhang, Nanoscale, 2014, 6, 3967–3971 RSC.
- C. He, S. Qiu, X. Wang, J. Liu, L. Luan, W. Liu, M. Itoh and K.-I. Machida, J. Mater. Chem., 2012, 22, 22160–22166 RSC.
- D. Sun, Q. Zou, Y. Wang, Y. Wang, W. Jiang and F. Li, Nanoscale, 2014, 6, 6557–6562 RSC.
- J. W. Liu, J. Cheng, R. C. Che, J. J. Xu and Z. W. Liu, ACS Appl. Mater. Interfaces, 2013, 5, 2503–2509 CAS.
- J. W. Liu, R. C. Che, H. J. Chen, F. Zhang, F. Xia, Q. S. Wu and M. Wang, Small, 2012, 8, 1214–1221 CrossRef CAS PubMed.
- J. Zheng, H. L. Lv, X. H. Lin, G. B. Ji, X. G. Li and Y. W. Du, J. Alloys Compd., 2014, 589, 174–181 CrossRef CAS PubMed.
- H. Guo, Y. Q. Zhan, Z. R. Chen, F. B. Meng, J. J. Wei and X. B. Liu, J. Mater. Chem. A, 2013, 1, 2286–2296 CAS.
- J. J. Xu, J. W. Liu, R. Che, C. Y. Liang, M. S. Cao, Y. Li and Z. W. Liu, Nanoscale, 2014, 6, 5782–5790 RSC.
- G. B. Sun, B. X. Dong, M. H. Cao, B. Q. Wei and C. W. Hu, Chem. Mater., 2011, 23, 1587–1593 CrossRef CAS.
- H. L. Xu, H. Bi and R. B. Yang, J. Appl. Phys., 2012, 111, 07A522 Search PubMed.
- D. P. Sun, Q. Zou, G. Q. Qian, C. Sun, W. Jiang and F. S. Li, Acta Mater., 2013, 61, 5829–5834 CrossRef CAS PubMed.
- C. Qiang, J. Xu, Z. Zhang, L. Tian, S. Xiao, Y. Liu and P. Xu, J. Alloys Compd., 2010, 506, 93–97 CrossRef CAS PubMed.
- S. D. Li, H. L. Du, Y. C. Zhang, Q. Xue, X. Y. Gao, W. Q. Shao, Z. Y. Zhou, T. X. Nan and N. X. Sun, J. Appl. Phys., 2014, 115, 17A310 CrossRef PubMed.
- J. M. Vargas and J. Gómez, APL Mater., 2014, 2, 106105 CrossRef PubMed.
- S. Jae Park, S. Kim, S. Lee, Z. G. Khim, K. Char and T. Hyeon, J. Am. Chem. Soc., 2000, 122, 8581–8582 CrossRef.
- G. X. Tong, Q. Hu, W. H. Wu, W. Li, H. S. Qian and Y. Liang, J. Mater. Chem., 2012, 22, 17494–17504 RSC.
- R. Han, W. Li, W. W. Pan, M. G. Zhu, D. Zhou and F. S. Li, Sci. Rep., 2014, 4, 7493 CrossRef CAS PubMed.
- J. P. Zou, Z. Z. Wang, M. Q. Yan and H. Bi, J. Phys. D: Appl. Phys., 2014, 47, 275001 CrossRef.
- J. Wang, J. Q. Xu, X. G. Meng and Y. Huang, Mater. Res. Bull., 2014, 49, 176–179 CrossRef CAS PubMed.
- R. E. Smalley and B. I. Yakobson, Solid State Commun., 1998, 107, 597–606 CrossRef CAS.
- T. S. Ahmadi, Z. L. Wang, T. C. Green, A. Henglein and M. A. El-Sayed, Science, 1996, 272, 1924–1926 CAS.
- A. P. Alivisatos, Science, 1996, 271, 933–937 CAS.
- C. M. Lieber, Solid State Commun., 1998, 107, 607–616 CrossRef CAS.
- D. E. Bugaris and H.-C. zur Loye, Angew. Chem., Int. Ed., 2012, 51, 3780–3811 CrossRef CAS PubMed.
- G. B. Ji, X. H. Lin, Y. Y. Sun, S. A. A. Trimizi, H. L. Su and Y. W. Du, CrystEngComm, 2011, 13, 6451–6456 RSC.
- M. V. Reddy, C. T. Cherian, K. Ramanathan, K. C. W. Jie, T. Y. W. Daryl, T. Y. Hao, S. Adams, K. P. Lohd and B. V. R. Chowdari, Electrochim. Acta, 2014, 118, 75–80 CrossRef CAS PubMed.
- B. Senthilkumar, R. K. Selvan, P. Vinothbabu, I. Perelshtein and A. Gedanken, Mater. Chem. Phys., 2011, 130, 285–292 CrossRef CAS PubMed.
- Z. H. Yang, Z. W. Li and Y. H. Yang, Mater. Chem. Phys., 2014, 144, 568–574 CrossRef CAS PubMed.
- G. Y. Mao, W. J. Yang, F. X. Bu, D. M. Jiang, Z. J. Zhao, Q. H. Zhang, Q. C. Fang and J. S. Jiang, J. Mater. Chem. B, 2014, 2, 4481–4488 RSC.
- G. P. Vilas, L. L. Daemen, S. Vogel and G. Chertkov, Ind. Eng. Chem. Res., 2010, 49, 920–924 CrossRef.
- E. K. Akdogan, R. E. Brennan, M. Allahverdi and A. Safari, J. Electroceram., 2006, 16, 159–165 CrossRef CAS.
- X. M. Liu, S. Y. Fu and H. M. Xiao, Mater. Lett., 2006, 60, 2979–2983 CrossRef CAS PubMed.
- W. X. Li, L. C. Wang, G. M. Li and Y. Xu, J. Alloys Compd., 2015, 633, 11–17 CrossRef CAS PubMed.
- L. R. Meng, W. M. Chen, Y. W. Tan, L. Zou and C. P. Chen, Nano Res., 2011, 4, 370–375 CrossRef CAS.
- Z. L. Wang, Handbook of Nanophase and Nanostructured Materials—Characterization, Kluwer Academic Plenum Publishers, 2002 Search PubMed.
- T. Xu, X. Zhou and Z. Y. Jiang, Cryst. Growth Des., 2009, 9, 192–196 CAS.
- Z. Y. Jiang, T. Xu, Z. Xie, Z. W. Lin, X. Zhou, X. Xu, R. B. Huang and L. S. Zheng, J. Phys. Chem. B, 2005, 109, 23269–23273 CrossRef CAS PubMed.
- F. L. Yang, Y. F. Liu, Y. N. Lu, H. Chen, D. Q. Zhang and H. M. Wu, J. Mater. Sci.: Mater. Electron., 2014, 25, 3608–3613 CrossRef CAS.
- J. Boltersdorf, N. King and P. A. Maggard, CrystEngComm, 2015, 11, 2225–2241 RSC.
- H. L. Lv, G. B. Ji, M. Wang, C. M. Shang, H. Q. Zhang and Y. W. Du, RSC Adv., 2014, 4, 57529–57533 RSC.
- X. M. Zhang, G. B. Ji, W. Liu, B. Quan, X. H. Liang, C. M. Shang, Y. Cheng and Y. W. Dou, Nanoscale, 2015, 7, 12932–12942 RSC.
- X. Sun, J. P. He, G. X. Li, J. Tang, T. Wang, Y. X. Guo and H. R. Xue, J. Mater. Chem. C, 2013, 1, 765–777 RSC.
- G. Z. Liu, W. Jiang, Y. P. Wang, S. T. Zhong, D. P. Sun, J. Liu and F. S. Li, Ceram. Int., 2015, 41, 4982–4988 CrossRef CAS PubMed.
- Y. P. Wang, D. P. Sun, G. Z. Liu, Y. J. Wang and W. Jiang, J. Electron. Mater., 2015, 44, 2292–2299 CrossRef CAS.
- S. B. Ni, X. L. Sun, X. H. Wang, G. Zhou, F. Yang, J. M. Wang and D. Y. He, Mater. Chem. Phys., 2010, 124, 353–358 CrossRef CAS PubMed.
- H. Zheng, Y. Yang, M. J. Zhou and F. S. Li, Hyperfine Interact., 2009, 189, 131–136 CrossRef CAS.
- B. Zhao, G. Shao, B. B. Fan, W. Y. Zhao, Y. Q. Chen and R. Zhang, RSC Adv., 2015, 5, 9806–9814 RSC.
- H. L. Lv, G. B. Ji, X. H. Liang, H. Q. Zhang and Y. W. Du, J. Mater. Chem. C, 2015, 3, 5056–5064 RSC.
- H. L. Lv, X. H. Liang, G. B. Ji, H. Q. Zhang and Y. W. Du, ACS Appl. Mater. Interfaces, 2015, 7, 9776–9783 CAS.
| This journal is © The Royal Society of Chemistry 2015 |

