The structural phase transition process of free-standing monoclinic vanadium dioxide micron-sized rods: temperature-dependent Raman study
Huafang Zhang,
Quanjun Li,
Pengfei Shen,
Qing Dong,
Bo Liu,
Ran Liu,
Tian cui and
Bingbing Liu*
State Key Laboratory of Superhard Materials, Jilin University, Changchun 130012, China. E-mail: liubb@jlu.edu.cn; Fax: +86-431-85168256; Tel: +86-431-85168256
First published on 24th September 2015
Abstract
We investigated the temperature-driven structural phase transition (SPT) process of free-standing monoclinic vanadium dioxide (VO2 (M)) micron-sized rods by Raman spectroscopy. With increasing temperature, the phase transition sequence goes monoclinic M1 → monoclinic M1/monoclinic M2/rutile (R) → monoclinic M2/R → R. The fully metallic R phase is reached at 50 °C, which is 7 °C lower than the value of nanoparticles in our study and 18 °C lower than the value of early reports on VO2 (M) bulk materials. The intermediate M2 phase, which plays a critical role in the monoclinic to rutile transition (MRT), was clearly observed in both heating and cooling process of the micron-sized free-standing VO2 (M) rods. We suggest that the existence of nucleating defects in our samples, which have an important effect on the nucleation of the R phase, are responsible for the reduction of the phase transition temperature and the appearance of the M2 phase. This supplies a possible way to expand the practical applications of one dimensional VO2 materials.
Introduction
VO2 is an important transition-metal oxide with a reversible metal–insulator transition (MIT) that occurs at 68 °C,1 accompanied by crystallographic structure transition (SPT) from the low-temperature monoclinic (M) phase to high-temperature rutile (R) phase. This structural transition causes drastic changes, such as electric, magnetic and optical properties, etc., which make VO2 (M) a promising material in heat sensors, smart windows, storage medium and so on.2–10 In recent years, it has been found that one dimensional VO2 (M) materials exhibit unique physical properties compared with their bulk counterparts due to dimensionality and surface effects,11–16 making it have promising applications in electronic and devices. For example, one dimensional VO2 (M) show unusually large and controllable changes in resonator frequency approaching and moving across the phase transition due to the influences of domain wall motion and phonon softening, suggesting new classes of electromechanical devices and sensors.13Along with the recognizing of the importance about one dimensional VO2 (M) materials, the preparation and the temperature-driven structural phase transition of these one dimensional VO2 (M) materials have been of considerable interests. One dimensional VO2 materials have been prepared via physical vapor deposition (PVD)11,17–19 and hydrothermal reaction.20–25 The phase transition temperature of PVD synthesized one dimensional VO2 (M) samples, which are deposited on substrate, is usually higher than 68 °C due to the tensile stress induced by mismatches in thermal expansion coefficients.11,17–19 Since the existence of substrate exerts a restriction on practical application of VO2 (M) samples, more attention have been paid to free-standing one dimensional VO2 materials. Free-standing one dimensional VO2 materials have been synthesized via hydrothermal reaction, and the phase transition temperature of these materials is close to 68 °C, which is lower than that of PVD synthesized counterparts.22,23 Moreover, as most of the practical applications of VO2 samples need the phase transition occurs at about room temperature, several methods have been explored to decrease the phase transition temperature, such as doping with W and Mo.20,21,26 Via element doping, the phase transition temperature of one dimensional free-standing VO2 samples can be reduced to 46.89 °C, whereas their morphology becomes nonuniform with the increasing of dopant. It is still a challenge to obtain one dimensional VO2 samples with low phase transition temperature. Recently, Ji et al.24 have reported that the phase transition of hydrothermal synthesized pure free-standing VO2 (M) nanorods occurred at about 61.1 °C, which is about 7 °C lower than that of early reports on pure one dimensional VO2 materials, whereas the reason for this decrease of phase transition temperature is still uncertain. Furthermore, the study on different size VO2 (M) nanoparticles indicates that the increase of the particle size produces lower phase transition temperature.27 These results suggest that the phase transition temperature of free-standing micron-sized VO2 (M) rods may be lower than that of nanorods. However, the temperature-driven structural phase transition of hydrothermal synthesized pure free-standing monoclinic VO2 (M) micron-sized rods has not yet been investigated.
In this work, we report the study on the temperature-driven structural phase transition of free-standing micron-sized VO2 (M1) rods (the typical monoclinic structure of VO2 at ambient pressure) compared with VO2 nanoparticles, using XAS and Raman spectroscopy to characterize the local structure and structural transformation. The fully metallic R phase of micron-sized VO2 rods and nanoparticles is reached at 50 °C and 57 °C, respectively. In addition, the metastable monoclinic phase M2, which appears on doping or applying stress, was observed on free standing micron-sized one dimensional VO2 (M) rods in both heating and cooling process. Our results provide a new way for reducing the phase transition temperature.
Experimental
Micron-sized VO2 rods and VO2 nanoparticles were synthesized through hydrothermal reaction combined with subsequent calcinations. For the synthesis of micron-sized VO2 rods (VO2 nanoparticles), the appropriate amount of V2O5 and oxalic (with the V2O5 concentration kept at 0.0125 M (0.05 M)) were added to deionized water, followed by continuous stirring until a pale-yellow solution was formed. The resulting solution was transferred into a Teflon-lined autoclave vessel and react at 270 °C for 24 h (160 °C for 48 h). Then all samples were collected and calcined at 600 °C for 3 h in the flow of high purity of argon. The temperature dependences of vibrational modes were followed by Raman scattering. Raman measurements were carried out using Renishaw spectrometer (Renishaw in Via) equipped with a microscope (50× objective) with a spot size of 1.4 μm. The excitation wavelength is 514.5 nm, with laser power kept at 500 μW to avoid heating effects. External sample temperature was controlled (±0.5 °C) via a programmable heating-cooling stage. X-ray diffraction (XRD) patterns were recorded by using an X-ray diffractometer (Rigaku D/max-RA) with Cu-Kα radiation (λ = 0.15418 nm). The transmission electron microscopy (TEM) images were performed by using a JEM-2200FS transmission electron microscopy with an acceleration voltage of 200 kV. The XAS measurements at the V K edge were carried out at room temperature at the beamline 1W1A of Beijing Synchrotron Radiation Facility (BSRF).Results and discussion
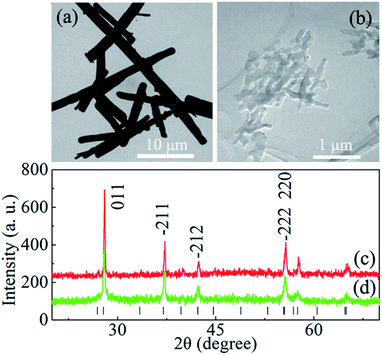
The XRD patterns of VO2 rods and nanoparticles exhibit a typical diffraction pattern for monoclinic (M1) VO2 (Fig. 1c and d), and their corresponding TEM images are shown in Fig. 1a and b. Fig. 2a displays the temperature-dependent Raman spectra of micron-sized VO2 rods, measured at temperatures between 20.5 °C and 68 °C on heating half-cycle. The spectrum at 20.5 °C is in full agreement with previous reports on VO2 (M1).28,29 The frequency peaks at 189 cm−1 and 220 cm−1 correspond to V–V pairing and V–V tilting vibrations, respectively, and the peak at 610 cm−1 correspond to V–O vibration.29 All the peaks broaden and weaken with increasing temperature, evident that part of VO2 in M1 phase transformed into R phase during the heating process. Note a weak Raman peak near 645 cm−1, which belongs to M2 phase, starts to appear at 37 °C. According to early reports, the nucleation of M2 phase likely results from the axial tensile stress following the partial transformation from M1 to R phase.17 The intensity of these M1 peaks decreases with further increasing temperature and it is completely suppressed above 46 °C (the arrow in Fig. 1a). In addition, we observed a gradual increase of the peak intensity near 645 cm−1 on heating followed by a gradual decrease above 47 °C. This behavior suggests that the fraction of M2 phase increases with increasing temperature before 47 °C, then the M2 phase gradually transforms into R phase with further heating. All the peaks disappear at 50 °C and two broad peaks, which belong to VO2 (R), appear and become more obvious with increasing temperature. It indicated that all the M2 phase transformed into R phase at 50 °C. The fully metallic R phase of micron-sized rods is reached at 50 °C, which is 18 °C lower than the value of early reports on VO2 (M) bulk samples.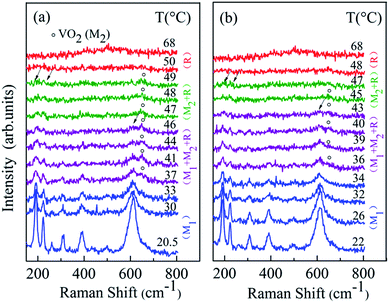 | ||
| Fig. 2 Temperature dependent Raman spectra of micron-sized VO2 rods: (a) heating half-cycle; (b) cooling half-cycle. | ||
Fig. 2b displays sequences of Raman spectra collected on cooling half-cycle. On cooling, the peak near 645 cm−1 (belong to M2 phase) appears at 47 °C and disappears at 34 °C. The peaks, which belong to M1 phase, start to appear at 43 °C, and the intensity of these peaks is stronger with further cooling. It demonstrates that the phase transition process is reversible with a 2 °C hysteresis from the heating process. M2 phase was observed in free-standing VO2 micron-sized rods on both heating and cooling process without doping or applying tensile stress.
Corresponding measurements on VO2 nanoparticles, which were synthesized by similar procedure, were carried out as contrast experiments. Fig. 3a shows Raman spectra at various temperatures for VO2 nanoparticles. A very sharp decrease of Raman peaks intensity was observed at 53 °C, and only these weak Raman peaks at 198 cm−1, 226 cm−1 and 618 cm−1 are still obvious. This behavior indicates that the SPT transition takes place in a relatively large volume. With further heating, all Raman peaks vanished above 56 °C, and the two broad peaks (belong to R phase) become clear. It suggests that all the samples transformed into R phase above 56 °C, which is 7 °C higher than that of micron-sized VO2 rods. Upon cooling (Fig. 3b), the structural phase evolution reversed, with a 9 °C hysteresis from the heating process (broader than that of micron-sized VO2 rods). This decrease of the particle size resulted in an increase in the SPT transition temperatures on heating and a decrease in the SPT transition temperatures on cooling, these results are consistent with early reports in VO2 nanoparticles.27,30 Different with micron-sized VO2 rods, the peaks of M2 phase were not observed in both heating and cooling half-cycle for VO2 nanoparticles.
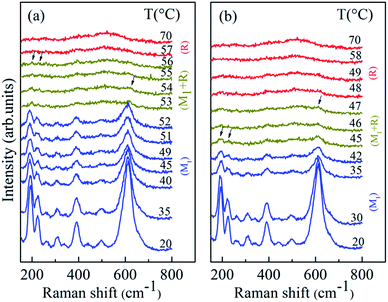 | ||
| Fig. 3 Temperature dependent Raman spectra of VO2 nanoparticles: (a) heating half-cycle; (b) cooling half-cycle. | ||
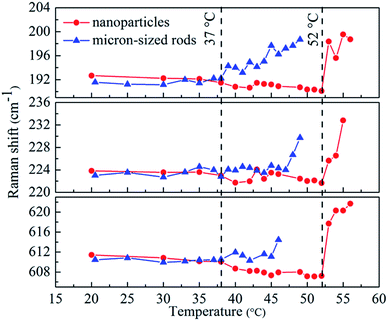
Fig. 4 shows temperature dependence of Raman peaks at 193 cm−1, 224 cm−1 and 611 cm−1 for both micron-sized VO2 rods and VO2 nanoparticles. At low temperature, the dependence of both samples is similar for the respective phonons, as previously reported.31,32 Above 37 °C, the bands of micron-sized rods gradually blue shift, which correspond to the appearance of M2 phase. This gradual blue shift of these Raman peaks has been reported by applying tensile stress along CR direction.33 In our case, the tensile stress introduced by the nucleation of the R phase may play an important role in determining the temperature dependence of the Raman vibration. Above 47 °C, the blue shift for the peak at 224 cm−1 becomes more obvious. For VO2 nanoparticles, with increasing temperature, the bands at about 192 cm−1 and 224 cm−1 show weak temperature dependence before 52 °C. However, we observed a gradual red shift of V–O vibration (612 cm−1), followed by rapid rise in energy above 52 °C. This rapid blue shift was also observed in the bands at 192 cm−1 and 224 cm−1 above 52 °C. According to early reports, internal stresses in M1 phase play a key in the temperature dependence of the V–O vibration.32 Part of VO2 transform from M1 phase into R phase, which shrinks about 1% along the CR axis, in the heating process. Therefore, the contraction along CR results in the red shifts of V–O vibration below 52 °C. The rapid blue shift of V–O vibration above 52 °C for VO2 nanoparticles may be results from the formation of M2 phase,31,33 which is not detected in our Raman measurements (Fig. 3). We consider that this is mostly because only a small amount of M1 phase transformed into M2 phase during the heating process and their Raman peaks were covered by M1 phase peaks.
As is evident from temperature-dependent Raman spectra for micron-sized VO2 rods (Fig. 2), M2 monoclinic phase appears on both heating and cooling process without doping or applying tensile stress, and the SPT transition temperature of micron-size VO2 rods is much lower than that of VO2 nanoparticles (Fig. 2 and 3). To further explore the inner difference between these two samples, XAS measurements at the V K edge were performed in ambient conditions. We focus on the pre-edge peak. As can be seen from Fig. 5a and b, the pre-edge spectrum in micron-sized rods is characterized by two peaks (A and A1), which correspond to eg and t2g, respectively,34 whereas the intensity of A1 in VO2 nanoparticles is suppressed dramatically. Through fitting the experimental data, we obtain the relative area of high energy peak high-energy peak A1. The relative area of for micron-sized rods and nanoparticles is 0.255 and 0.166, respectively. Note that the value for VO2 nanoparticles is consistent with that of their bulk counterparts below 1 GPa.35 This consistence might be because VO2 nanoparticles have a high surface area to volume ratio value.36 According to early reports, the onset-temperature for the phase transition of VO2 on heating process follows the Clapeyron equation, and the transition temperature increases linearly with hydrostatic pressure at a rate of 0.82 ± 0.005 °C GPa−1.27,37 Therefore, the compressive stress introduced by high surface area to volume ratio will increase the phase transition temperature by 1 °C, at most.
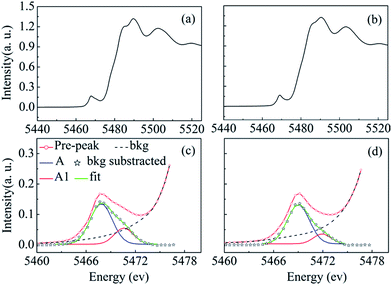 | ||
| Fig. 5 Near-edge XAS spectra of (a) micron-sized sized VO2 rods (b) VO2 nanoparticles. The pre-peak of the V K-edge XAS spectra: (c) the micron-sized rods, (d) VO2 nanoparticles. | ||
Additionally, it is known that the SPT transition is the result of heterogeneous nucleation,27,38,39 and its occurrence relies of the availability of a nucleating defects in the sample space. The probability F that a particle of volume V contains at least one such site given below,27
| F = 1 − exp[−ρV], |
From the function, we conclude that a particle with lager volume have more chance to contains at least one nucleation defect at lower temperature. Thus, in our case, the phase transition temperature of micron-sized VO2 rods much lower than that of nanoparticles mainly results from its larger size. In addition, according to the heterogeneous nucleation, the defects are closely related to the procedure employed to fabricate the VO2 samples. Both of our micron-sized VO2 rods and VO2 nanoparticles contain lots of nucleation defects at relatively low temperature due to the special synthesize process, as a result, the phase transition temperature of both samples is much lower than that of early reports on pure bulk VO2.
Conclusions
In summary, we have described and analyzed the phase transition process of free-standing VO2 (M) rods by temperature-dependent Raman study as well as by XAS measurements. It is shown that the MRT temperature for free-standing micron-sized VO2 rods on heating and cooling process is 50 °C and 47 °C, respectively, much lower than that of early reports on pure bulk VO2 sample. And the M2 phase is observed in both heating and cooling process. By analysing the temperature dependent Raman spectra and XAS measurement of both micron-sized rods and nanoparticles, we can conclude that nucleating defects play an important role in reducing SPT transition temperature, and the tensile stress introduced by the partial transformation from M1 to R phase is responsible for the appearance of M2 phase. Moreover, our results provide a new strategy to reduce the phase transition temperature.Acknowledgements
This work supported by the National Basic Research Program of China (2011CB808200), the NSFC (11374120, 10979001, 51025206, 51032001, and 21073071), and the Cheung Kong Scholars Programme of China.References
- F. Morin, Phys. Rev. Lett., 1959, 3, 34–36 CrossRef CAS.
- S. Zhang, I. S. Kim and L. J. Lauhon, Nano Lett., 2011, 11, 1443–1447 CrossRef CAS PubMed.
- A. Zylbersztejn and N. F. Mott, Phys. Rev. B: Solid State, 1975, 11, 4383–4395 CrossRef CAS.
- M. Qazilbash, M. Brehm, G. Andreev, A. Frenzel, P. C. Ho, B. G. Chae, B. J. Kim, S. Yun, H. T. Kim, A. Balatsky, O. Shpyrko, M. Maple, F. Keilmann and D. Basov, Phys. Rev. B: Condens. Matter Mater. Phys., 2009, 79, 075107 CrossRef.
- K. W. Lee, J. J. Kweon, C. E. Lee, A. Gedanken and R. Ganesan, Appl. Phys. Lett., 2010, 96, 243111 CrossRef PubMed.
- M. Soltani, M. Chaker, E. Haddad and R. Kruzelesky, Meas. Sci. Technol., 2006, 17, 1052–1056 CrossRef CAS.
- M. J. Lee, Y. Park, D. S. Suh, E. H. Lee, S. Seo, D. C. Kim, R. Jung, B. S. Kang, S. E. Ahn, C. B. Lee, D. H. Seo, Y. K. Cha, I. K. Yoo, J. S. Kim and B. H. Park, Adv. Mater., 2007, 19, 3919–3923 CrossRef CAS PubMed.
- T. Driscoll, H. T. Kim, B. G. Chae, M. Di Ventra and D. N. Basov, Appl. Phys. Lett., 2009, 95, 043503 CrossRef PubMed.
- X. Cao, M. N. Thet, Y. Zhang, S. C. J. Loo, S. Magdassi, Q. Yan and Y. Long, RSC Adv., 2015, 5, 25669–25675 RSC.
- N. Beatham, I. Fragala, A. Orchard and G. Thornton, J. Chem. Soc., Faraday Trans. 2, 1980, 76, 929–935 RSC.
- J. I. Sohn, H. J. Joo, D. Ahn, H. H. Lee, A. E. Porter, K. Kim, D. J. Kang and M. E. Welland, Nano Lett., 2009, 9, 3392–3397 CrossRef CAS PubMed.
- Q. Gu, A. Falk, J. Wu, O. Lian and H. Park, Nano Lett., 2007, 7, 363–366 CrossRef CAS PubMed.
- A. Holsteen, I. S. Kim and L. J. Lauhon, Nano Lett., 2014, 14, 1898–1902 CrossRef CAS PubMed.
- J. T. Hu, T. W. Odom and C. M. Lieber, Acc. Chem. Res., 1999, 32, 435–445 CrossRef CAS.
- Q. Gu, A. Falk, J. Wu, L. Ouyang and H. Park, Nano Lett., 2007, 7, 363–366 CrossRef CAS PubMed.
- J. Voit, Rep. Prog. Phys., 1994, 57, 977–1116 Search PubMed.
- S. Zhang, J. Y. Chou and L. J. Lauhon, Nano Lett., 2009, 9, 4527–4532 CrossRef CAS PubMed.
- A. C. Jones, S. Berweger, J. Wei, D. Cobden and M. B. Raschke, Nano Lett., 2010, 10, 1574–1581 CrossRef CAS PubMed.
- C. Tsang and A. Manthiram, J. Electrochem. Soc., 1997, 144, 520–524 CrossRef CAS PubMed.
- J. Li, C.-Y. Liu and L.-J. Mao, J. Solid State Chem., 2009, 182, 2835–2839 CrossRef CAS PubMed.
- X. Xiao, H. Cheng, G. Dong, Y. Yu, L. Chen, L. Miao and G. Xu, CrystEngComm, 2013, 15, 1095–1106 RSC.
- G. A. Horrocks, S. Singh, M. F. Likely, G. Sambandamurthy and S. Banerjee, ACS Appl. Mater. Interfaces, 2014, 6, 15726–15732 CAS.
- K. Zhang, X. Liu, Z. Su and H. Li, Mater. Lett., 2007, 61, 2644–2647 CrossRef CAS PubMed.
- S. Ji, Y. Zhao, F. Zhang and P. Jin, J. Cryst. Growth, 2010, 312, 282–286 CrossRef CAS PubMed.
- S. Ji, F. Zhang and P. Jin, J. Solid State Chem., 2011, 184, 2285–2292 CrossRef CAS PubMed.
- Y. Zhang, W. Li, M. Fan, F. Zhang, J. Zhang, X. Liu, H. Zhang, C. Huang and H. Li, J. Alloys Compd., 2012, 544, 30–36 CrossRef CAS PubMed.
- R. Lopez, T. Haynes, L. Boatner, L. Feldman and R. Haglund, Phys. Rev. B: Condens. Matter Mater. Phys., 2002, 65, 224113 CrossRef.
- J. Parker, Phys. Rev. B: Condens. Matter Mater. Phys., 1990, 42, 3164–3166 CrossRef CAS.
- C. Marini, E. Arcangeletti, D. Di Castro, L. Baldassare, A. Perucchi, S. Lupi, L. Malavasi, L. Boeri, E. Pomjakushina, K. Conder and P. Postorino, Phys. Rev. B: Condens. Matter Mater. Phys., 2008, 77, 235111 CrossRef.
- E. U. Donev, J. I. Ziegler, R. F. Haglund Jr and L. C. Feldman, J. Opt. A: Pure Appl. Opt., 2009, 11, 125002 CrossRef.
- M. Nazari, Y. Zhao, V. Hallum, A. A. Bernussi, Z. Y. Fan and M. Holtz, Appl. Phys. Lett., 2013, 103, 043108 CrossRef PubMed.
- M. Nazari, Y. Zhao, V. V. Kuryatkov, Z. Y. Fan, A. A. Bernussi and M. Holtz, Phys. Rev. B: Condens. Matter Mater. Phys., 2013, 87, 035142 CrossRef.
- J. M. Atkin, S. Berweger, E. K. Chavez, M. B. Raschke, J. Cao, W. Fan and J. Wu, Phys. Rev. B: Condens. Matter Mater. Phys., 2012, 85, 020101 CrossRef.
- A. Bianconi, Phys. Rev. B: Condens. Matter Mater. Phys., 1982, 26, 2741–2747 CrossRef CAS.
- C. Marini, M. Bendele, B. Joseph, I. Kantor, M. Mitrano, O. Mathon, M. Baldini, L. Malavasi, S. Pascarelli and P. Postorino, Europhys. Lett., 2014, 108, 36003 CrossRef.
- Q. Jiang, L. H. Liang and D. S. Zhao, J. Phys. Chem. B, 2001, 105, 6275–6277 CrossRef CAS.
- C. N. Berglund and A. Jayaraman, Phys. Rev., 1969, 185, 1034–1039 CrossRef CAS.
- H. T. Kim, Y. W. Lee, B. J. Kim, B. G. Chae, S. J. Yun, K. Y. Kang, K. J. Han, K. J. Yee and Y. S. Lim, Phys. Rev. Lett., 2006, 97, 266401 CrossRef.
- V. Eyert, Ann. Phys., 2002, 11, 650–702 CrossRef CAS.
| This journal is © The Royal Society of Chemistry 2015 |

