PSS-GN nanocomposites as highly-efficient peroxidase mimics and their applications in colorimetric detection of glucose in serum

Jing Chena, Jia Geab, Lin Zhanga, Zhaohui Li*ab, Saisai Zhoua and Lingbo Qu*a
aCollege of Chemistry and Molecular Engineering, Zhengzhou University, Zhengzhou 450001, P. R. China. E-mail: zhaohui.li@zzu.edu.cn; qulingbo@zzu.edu.cn; Tel: +86 37167783126
bState Key Laboratory of Chemo/Biosensing and Chemometrics, Hunan University, Changsha 410082, P. R. China

Received 7th August 2015 , Accepted 15th October 2015

First published on 16th October 2015


Abstract

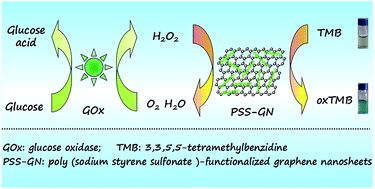
In this report, poly(sodium styrene sulfonate)-functionalized graphene nanosheets (PSS-GN) with good water dispersibility were prepared and for the first time proposed as a peroxidase-like mimic. The intrinsic catalytic activity of PSS-GN nanocomposites was investigated and the results showed that PSS-GN nanocomposites had higher mimetic enzyme catalytic activity compared with horseradish peroxidase (HRP), which might be due to the stronger binding affinity between negatively charged PSS and the positively charged peroxide substrate (3,3,5,5-tetramethylbenzidine, TMB). On the basis of the high catalyze activity, these PSS-GN nanocomposites were utilized for sensitive and selective colorimetric detection of H2O2 as well as glucose. The linearity between analyte concentration and system absorption ranged from 0.005 to 1 mM for H2O2 and 0.006 to 0.4 mM for glucose with a detection limit of 0.15 μM and 0.28 μM, respectively. Moreover, this strategy was further utilized to determine the concentrations of glucose in serum samples with satisfying results. This assay exhibits good analytical performance, acceptable stability and good selectivity. We envision that this sensing system could be used as a tool for a wide range of potential applications in enzyme-based chemical and biological analysis.
Introduction

Natural enzymes, known as macromolecular biological catalysts, can effectively catalyze various chemical reactions in biological processes with highly selectivity.1,2 However, natural enzymes suffer from some serious disadvantages such as high cost, inherent instability due to denaturation and digestion, and rigorous reaction conditions,3,4 which have inevitably restricted their widespread applications. Therefore, construction and discovery of novel enzyme mimic is under intensive investigation.

In recent years, nanomaterial-based artificial enzymes have received great attention and allowed us to view conventional heterogeneous catalysts with a new perspective. After the first report of Fe3O4 magnetic nanoparticles with peroxidase-like enzyme mimetic activity similar to HRP,5 a variety of inorganic nanomaterials6–11 and carbon nanomaterials12–15 as peroxidase mimetics came into sight. Comparing to natural enzymes, these nanomaterial-based peroxidase mimetics hold significant advantages of simple synthesis, low cost, high stability and considerable catalytic activity. Recently, graphene oxide (GO) as the product of graphene (GN) oxidation has been evaluated as a candidate of peroxidase mimics.16 Whereas as is well known, oxygen-containing functional groups on the surface of GO was found to destroy π–π conjugated structure of GN and thus weaken its electronic conduction ability.17 Based on that, GN is possibly endued with more excellent mimetic enzyme properties than GO and has a great potential to be used as a better artificial enzyme candidate. However, GN is hydrophobic and tends to agglomerate in water and even restack to form graphite owing to van der Waals interactions and strong π–π stacking,18,19 ruining their outstanding single-layer catalytic property and also limiting their further applications. Recently, Stankovich et al. explored the poly(sodium styrene sulfonate)-coated graphene (PSS-GN) that exhibited good water dispersibility,20 and the functionalized graphene has been used for the detection of ascorbic acid and single-nucleotide mismatch discrimination.21,22 Moreover, our previously effort has developed a sensitive electrochemical method for the detection of 2,4-dichlorophenol and clenbuterol base on PSS-GN.23,24 It is particularly gratifying that GN functionalized with PSS has shown good solubility and good electrocatalytic activity, which is attributed to electrostatic interactions among negatively charge PSS units intercalated in graphene nanosheets. Benefitting from its unique properties such as good electrocatalytic activity as well as good water dispersibility, PSS-GN is predicted to be a robust candidate for enzyme mimic.

Herein in this paper, to widely use PSS-GN in artificial enzyme studies, we have applied it as a novel enzyme mimic for the first time. The as-prepared PSS-GN nanocomposites revealed outstanding peroxidase-like activity that can be used to catalyze the oxidation of 3,3,5,5-tetramethylbenzidine (TMB) by hydrogen peroxide. Moreover, compared with GN and GO, PSS-GN nanocomposites showed much higher mimic enzyme catalytic activity. PSS-GN nanocomposites are more favorable to enrich TMB onto their surface because they can bind TMB not only through p–p interaction just as GN (or GO) with TMB, but also through electrostatic interaction between the negatively charged PSS and the positively charged TMB. Meanwhile, the kinetic behavior and catalytic mechanism of PSS-GN nanocomposites as a peroxidase mimic were further investigated, and the results indicates that PSS-GN nanocomposites have a higher affinity for TMB than HRP and GO, thus may causing PSS-GN nanocomposites higher mimic enzyme catalytic properties. Reaping huge fruits from its great advantages, we have employed PSS-GN nanocomposites as a novel peroxidase mimetic and developed a simple approach for colorimetric visual detecting of glucose in serum with satisfying results.

Experimental section

Chemicals and apparatus

Glucose, maltose, fructose, sucrose, galactose, 3,3,5,5-tetramethylbenzidine (TMB) and glucose oxidase (GOx) were obtained from Shanghai Sangon Biological Engineering Technology & Services Co., Ltd. (Shanghai, China). Glucose kits were obtained from Shanghai Rongsheng Biotech Co., Ltd. (Shanghai, China). Poly(sodium 4-styrenesulfonate) (PSS) (70[thin space (1/6-em)]000 g mol−1) was purchased from Sigma-Aldrich. Hydrogen peroxide (H2O2, 30%) was received from Tianjin Chemical (Tianjin, China). 0.2 M of acetate–acetic buffer (HAc–NaAc) was prepared with sodium acetate and acetic acid. All other reagents were of analytical grade without any further purification. All solutions were prepared using ultrapure water, which was obtained through a Millipore Milli-Q water purification system (Billerica, MA, USA) with an electric resistance >18.2 MΩ. All glassware were soaked with saturated chromic acid solution for at least 24 h and rinsed with ultrapure water thoroughly before use.

Transmission electron microscope (TEM) images were obtained from JEM-2100 (JEOL, Japan) with a 200 kV accelerating voltage. The UV-vis absorption spectra were recorded on a T6 UV-vis Spectrophotometer (Purkinje General, Beijing, China). The FT-IR spectra were obtained through a Bruker IFS 66 v/s infrared spectrometer. The X-ray diffraction (XRD) patterns were acquired on a D/max-IIIA diffractometer (Rigaku Co. Japan). Cyclic Voltammetric (CV) experiments were conducted on a CHI 660E Electrochemical Workstation (Chen-hua, Shanghai, China). Zeta potential was measured on the NanoPlus (Micromeritics Instrument Corp, USA). All of the pH values were measured by a PHS-3C precision pH meter (Leici Devices Factory of Shanghai, China).

Preparation of PSS-GN nanocomposites

Graphene oxide (GO) was prepared according to the modified Hummer's method.25 Briefly, 2.0 g graphite was mixed with 69 mL of 98% H2SO4 in an ice bath under mechanical stirring, and KMnO4 (8.0 g) was added slowly. Subsequently, the above mixture was stirred at 35 °C overnight. Then ultrapure water (280 mL) was gradually added into the reaction system with continuous stirring until the solution turned yellowish brown. After another 2 h of vigorous stirring, 25 mL of 30% H2O2 was added into the mixture, yielding the bright yellow product immediately. Finally, the mixture was washed with ultrapure water until the pH of the solution reached to 7.0, and then reaction mixture was filtered and dried in vacuum at 50 °C. The GO was obtained as a gray powder and used for the further experiments.

The water-soluble PSS-GN nanocomposites were synthesized as follows. 0.2 g GO and 2.0 g PSS were mixed with 200 mL of ultrapure water and sonicated for 30 min to form a stable supernatant suspension. Subsequently, 10 mL of hydrazine monohydrate was added and heated at 95 °C for 3 h. Finally, the mixture was centrifuged and washed with ultrapure water to remove excess hydrazine and PSS, and then dried in vacuum at 50 °C overnight. The obtained black product was named as PSS intercalated graphene nanosheets (PSS-GN).

Procedure for peroxidase-like activity and kinetic analysis

To investigate the peroxidase-like activity of the prepared PSS-GN nanocomposites, the catalytic oxidation reaction of the typical peroxidase substrate of TMB in the presence of H2O2 was measured. Experiments were carried out using 15 μg mL−1 PSS-GN nanocomposites in 1 mL of 20 mM HAc–NaAc buffer with 0.2 mM TMB and 2 mM H2O2. The influence of the pH, reaction temperature, H2O2 concentration and TMB concentration for the peroxidase-like activity of PSS-GN nanocomposites were also investigated.

The reaction kinetic for the catalytic oxidation of TMB was carried out by monitoring the absorbance variation at 652 nm for 5 min as a function of time. Experiments were carried out at room temperature in tube with 15 μg mL−1 PSS-GN nanocomposites or 15 μg mL−1 GO in 1 mL of 20 mM HAc–NaAc buffer (pH 4.0) with 0.2 mM TMB or 3 mM H2O2. Immediately after the substrates were added, color reaction was observed. The Michaelis–Menten constant and maximal reaction velocity were calculated based on the Lineweaver–Burk plot.

H2O2 detection using PSS-GN nanocomposites as peroxidase mimetics

H2O2 detection was realized as follows: 50 μL PSS-GN nanosheets (0.3 mg mL−1), 50 μL TMB (4 mM), 100 μL HAc–NaAc buffer (0.2 M, pH 4.0), and 700 μL ultrapure water were mixed together. Then 100 μL H2O2 with different concentrations were added, and the mixture mixed uniformly by vortex was further incubated for 15 min at 45 °C followed by the absorbance measurement at 652 nm.

Glucose detection using GOx and PSS-GN nanocomposites

Glucose detection was realized as follows: 20 μL GOx (10 mg mL−1), 10 μL HAc–NaAc buffer (0.2 M, pH 5.5), 50 μL glucose with different concentrations and 120 μL ultrapure water were mixed. The mixture was mixed uniformly by vortex and then incubated at 37 °C for 30 min to produce H2O2. The subsequent detection process was the same as that of H2O2 detection as above mentioned.

To investigate the capability of this method for the determination of glucose in real samples, different concentrations of glucose in serum were further analyzed. The serum from volunteer was collected by the first affiliated hospital of Zhengzhou University and informed consent was obtained for the use of human serum. All experiments were performed in compliance with the relevant laws and institutional guidelines and approved by Life-Science Ethics Review Committee of Zhengzhou University. In total, 0.8 mL of acetonitrile were added to 0.2 mL of serum sample, the solution was then intensive mixed and centrifuged for 10 min at 10[thin space (1/6-em)]000 rpm, the supernatant were dried under nitrogen. Then, 10 mL ultrapure water was added into the residue to obtain the treated serum sample. The sample was spiked with different amounts of glucose to reach the final concentrations of 0.1 mM, 1 mM, and 2 mM, respectively. The detection procedure was the same as those described in the above-mentioned experiment for glucose detection. As a control, the glucose determination was performed directly by glucose kits.

Results and discussion

Synthesis and characterization of PSS-GN nanocomposites

The water-soluble PSS-GN nanocomposites were synthesized from GO (Scheme S1 in ESI), and a series of characterization analysis for the resulting nanostructures were given in Fig. S2 (ESI). Firstly, the different color of PSS-GN from that of GO intuitively indicated that the GO had been reduced. Meanwhile, the XRD pattern (Fig. S1B) showed that the GO had a peak centered at 10.2° attributed to the introduction of oxygenated functional groups onto the carbon sheets, while the characteristic peak at 26.7° of graphite (the inset of Fig. S1B) was absent, suggesting the formation of individual GO sheets. After the reduction with hydrazine, the characteristic peak for (002) plane of GO wasn't observed in PSS-GN, while it was still keeping the hexagonal structure with a diffraction peak at 42.8°, which indicated that graphite oxide was successfully reduced to graphene sheets. To further demonstrate that PSS was introduced onto the graphene sheets, the UV-vis spectra were given in Fig. S1C. We could that GO had a maximum absorption at 230 nm attributed to the π–π* transitions of C[double bond, length as m-dash]C bonds and a shoulder peak at 300 nm ascribed to the n–π* transitions of C[double bond, length as m-dash]O bonds.26 While PSS-GN nanocomposites had a sharp characteristic absorption peaks at 226 nm and 262 nm similar features as that of PSS itself, which suggested PSS was introduced onto the graphene surface. As shown in Fig. S1D, FT-IR spectra provided further evidence of the reduction of the oxygen-containing group of the GO and the attachment of PSS. For GO, its spectrum showed bands at 3380 cm−1, 1720 cm−1, 1384 cm−1 and 1050 cm−1 corresponding to C[double bond, length as m-dash]O bending vibration peak, C[double bond, length as m-dash]O stretching vibration peak, C–OH bending peak and O-H bending vibration,27 respectively. Compared with the FT-IR spectra of GO, PSS-GN corresponding to the oxygen functionalities practically vanished. While the broad band at 1576 cm−1 could be ascribed to the over lapping of the C[double bond, length as m-dash]C stretching of sp2 hybridized carbon atoms of graphene (1572 cm−1) and that of PSS (1597 cm−1), and the peak at 1046 cm−1 was attributed to the stretching vibration of S[double bond, length as m-dash]O bonds in sulfonic group, indicating the functionalization of graphene with PSS. Considering all of the above, it could be concluded that the PSS functionalized graphene had been successfully prepared.

PSS-GN nanocomposites could be dispersed readily in water upon mild sonication and form black suspensions over several months (Fig. 1A). In contrast, the GN prepared without PSS easily agglomerated and precipitated down to the bottom of the bottle. Obviously, PSS could stabilize graphene in water due to the edge-to-face aromatic interactions between the graphene surfaces and the aromatic rings of the polymer.28 The stability of PSS to graphene was manifested by TEM. Fig. 1B presented the graphene sheets without PSS modification, which aggregated more readily and displayed poor dispersibility in water. Comparably, the PSS intercalated graphene sheets (Fig. 1C) were almost transparent and showed wrinkled layer-like structure.


image file: c5ra15837k-f1.tif
Fig. 1 (A) Photographs of water dispersion of 0.5 mg mL−1 GN (left) and 0.5 mg mL−1 PSS-GN nanocomposites (right). Photo was taken 6 months after the reduction reaction. TEM images of GN (B) and PSS-GN nanocomposites (C).

Besides, to further demonstrate that anionic polymer (PSS) introduced onto graphene sheets made these nanocomposites presenting more negatively charged than GN (or GO), the results of Zeta potential analysis were given in Fig. S2 (ESI). As-prepared PSS-GN nanocomposites possessed a ζ-potential value of −43.74 mV at 0.5 mg mL−1, which was 364.5 times lower than that of GN (−0.12 mV) and 2.1 times lower than that of GO (−21.09 mV), indicating that the PSS-GN nanocomposites were more electronegative than GN or GO. Whereas as is well known, H+ easily trend to unite with –NH2 on the TMB to form –NH3+ under acidic conditions, and TMB exhibited positively charged as a result. Thus, there was stronger binding affinity between PSS-GN and TMB than that of GN or GO.

Peroxidase-like activity of PSS-GN nanocomposite

To investigate the peroxidase-like activity of PSS-GN nanocomposites, the catalytic oxidation process of the peroxidase substrate TMB in the presence of H2O2 was tested. As shown in Fig. 2, in the presence of GO, GN, and PSS-GN nanocomposites, the solution containing H2O2 and TMB changed to a blue color, which showed that all this three kinds of nanomaterials could catalyze the oxidation of TMB by H2O2 to produce a blue color reaction. Meanwhile, the absorbance of the PSS-GN/TMB/H2O2 system at 652 nm was higher than that of the GO/TMB/H2O2 and GN/TMB/H2O2 systems, which was also reflected by reaction color changing in the catalytic systems (the inset of Fig. 2). Furthermore, catalytic oxidation of TMB by H2O2 in the presence of PSS-GN nanocomposites showed a rapid initial reaction rate and a subsequent stable stage as depicted in Fig. S3A (ESI), and 15 min was chosen as the optimum reaction time. These results confirmed that the PSS-GN nanocomposites behaved with higher peroxidase-like activity toward TMB. The catalytic activity of these enzyme mimics (GO, GN and PSS-GN nanocomposites) were further investigated by cyclic voltammetry (CV). Fig. S3B (ESI) showed the voltammogram of the glassy carbon electrode modified by various catalytic material (GO, GN and PSS-GN nanocomposites) using 20 μM TMB and 100 μM H2O2 in 0.1 M HAc–NaAc (pH = 4.0) at potential range of 600 mV to 200 mV and 50 mV s−1 scan rate. It was found that when GO, GN and PSS-GN nanocomposites were applied individually, only the PSS-GN nanocomposites had obvious electrochemical catalytic activity for TMB. These results also proved that PSS-GN nanocomposites could exhibit preferable catalytic performance compared with GO and GN.
image file: c5ra15837k-f2.tif
Fig. 2 UV-vis absorption spectra of TMB/H2O2/PSS-GN (curve a), TMB/H2O2/GN (curve b), TMB/H2O2/GO (curve c), TMB/H2O2 (curve d) and TMB/PSS-GN (curve e); inset: images of oxidation color reaction in different reaction systems. Reaction condition: 15 μg mL−1 enzyme mimics (GO, GN or PSS-GN), 0.2 mM TMB and 2 mM H2O2.

In order to achieve the best performance for H2O2 detection, we have scrutinized the effects of some important parameters including the concentration of H2O2 and TMB, the temperature, and the pH. The results are shown in Fig. 3. Experimentally, we measured the peroxidase-like activity of PSS-GN nanocomposites while varying the pH from 2.0 to 5.0, the temperature from 25 °C to 80 °C (Fig. 3A and B). The optimal pH and temperature were 4.0 and 45 °C, which were very similar to the values for HRP.5 Thus, we adopted pH 4.0 and 45 °C as standard conditions for subsequent analysis of H2O2 with the concentration ranging from 5 μM to 50 mM. As shown in Fig. 3C, the maximal level of peroxidase activity of PSS-GN nanocomposites was obtained at 10 mM H2O2. However, further increasing of H2O2 concentration inhibited the catalytic activity, as also was observed for the natural enzyme catalyzed reaction.5 Then, the peroxidase-like activity of PSS-GN nanocomposites was investigated while TMB concentration ranged from 4 μM to 1.0 mM, and the result was shown in Fig. 3D. The absorbance at 652 nm of the reaction increased rapidly with the concentration increasing and reached to an equilibration stage after 0.2 mM. Therefore, 0.2 mM of TMB was selected as the appropriate concentration in the following experiments.


image file: c5ra15837k-f3.tif
Fig. 3 The peroxidase-like activity of the PSS-GN nanocomposites against pH (A), temperature (B), H2O2 concentration (C) and TMB concentration (D).

Steady-state kinetic of PSS-GN nanocomposites

To better understand the peroxidase-like activity of the PSS-GN nanocomposites, we analyzed steady-state kinetics based on TMB oxidation reaction compare with HRP and GO. A series of experiments were performed by changing the concentration of one substrate and keeping constant the concentration of the other. In a certain range of substrate concentrations, typical Michaelis–Menten curves were obtained for both PSS-GN nanocomposites (Fig. S4A and B, ESI) and GO (Fig. S4C and D, ESI). The data was fitted to the Michaelis–Menten model and the parameters obtained by using Lineweaver–Burk double reciprocal plots. For the purpose of comparison, the kinetic data, including the Michaelis constant (Km) and the maximal velocity (Vmax) of the enzyme mimics and literature values were listed in Table S1. The Km value for the PSS-GN nanocomposites with TMB was 0.015 mM, which was 3 times lower than that of the GO (0.049 mM) and 28.7 times lower than that of HRP (0.43 mM), indicating that the PSS-GN nanocomposites have a higher affinity for TMB than HRP and GO. In comparison with other reported peroxidase-like carbon nanomaterials such as carbon nanoparticles (0.05 mM), N-doped graphene QDs (11.19 mM), helical carbon nanotubes (0.02 mM), carbon dots (0.039 mM) and C60[C(COOH)2]2 (0.23 mM), PSS-GN had smaller Km value (Table S1). This result might be due to the fact that carbon-based materials could more easily adsorb TMB through π–π stacking interaction, and most importantly PSS-GN nanocomposites also could bind TMB through electrostatic interaction between the negatively charged PSS and the positively charged TMB under acidic conditions. Moreover, the apparent Km of PSS-GN nanocomposites with H2O2 as the substrate was lower than that of HRP or some carbon nanomaterials, which also indicated that PSS-GN nanocomposites had relative high affinity for H2O2, perhaps because the PSS molecules intercalated in graphene sheets promoted accessibility to H2O2 in the solution. The results showed double reciprocal plots of initial velocity against one substrate concentration, obtained for the second substrate fixed at three concentration levels (Fig. S4E and F, ESI). The slope of the lines was parallel, which was characteristic of a ping-pong mechanism as was observed for HRP29 and indicated that the PSS-GN nanocomposites bound and reacted with the first substrate, and then released the first product before reacting with the second substrate.

H2O2 detection using PSS-GN nanocomposites as the catalyst

To investigate the utility of this colorimetric system as a quantitative method for H2O2 detection, a series of H2O2 solutions with concentrations from 0 to 1 mM were examined. Fig. 4A showed the UV-vis absorption spectra of TMB/PSS-GN solution containing different concentrations of H2O2 under optimum assay conditions, and the color of the solutions changed from light blue to dark blue in the presence of H2O2 from 0 to 1 mM (the inset of Fig. 4A), which provided a naked eye method for H2O2 detection. By analyzing the absorbance with the concentrations of H2O2 (Fig. 4B), a linear relationship between the absorbance at 652 nm and H2O2 concentration from 5 μM to 1 mM (R2 = 0.9962) was obtained with a detection limit of 0.15 μM (the inset of Fig. 4B). However, if the GO instead of PSS-GN nanocomposites was used in the catalytic oxidation process of TMB, the absorbance was linearly related to H2O2 only in the range of 50 μM to 1 mM with a detection limit of 7.7 μM (Fig. S5A and B, ESI). These results also demonstrated that the easy transformation of GO to PSS-GN nanocomposites by means of hydrazine monohydrate reduction has significantly improved the peroxidase-like activity of graphene sheets.
image file: c5ra15837k-f4.tif
Fig. 4 (A) UV-vis absorption spectra of the TMB/PSS-GN solutions in the presence of H2O2 at various concentrations (a–q): 0, 0.005, 0.007, 0.01, 0.03, 0.05, 0.07, 0.1, 0.3, 0.5, 0.7, 1, 2, 3, 5, 7, 10 mM using PSS-GN nanocomposites as a peroxidase mimetic. Inset: photographs of the colored reaction mixtures for different concentrations of H2O2 (mM) (from left to right: 0, 0.007, 0.01, 0.03, 0.05, 0.07, 0.1, 0.3, 0.5, 0.7, 1, 2). (B) The absorbance intensity at 652 nm plotted against the H2O2 concentration. The insert shows linear calibration curve between the absorbance and concentration of H2O2.

Glucose detection using GOx and PSS-GN nanocomposites

Hydrogen peroxide is the main by-product of glucose oxidase (GOx)-catalyzed reaction. Thus, a colorimetric sensor for glucose detection could be realized when coupled with GOx. Fig. 5A showed the UV-vis absorption spectra for glucose detection obtained under optimum assay conditions. Fig. 5B showed a typical glucose concentration response curve, and the linear response (R2 = 0.9984) of the absorbance (652 nm) versus glucose concentration was in the range from 6.0 μM to 0.4 mM with a detection limit of 0.28 μM (the inset of Fig. 5B). Compared with reported nanomaterials-based methods, this proposed PSS-GN nanocomposites-based colorimetric method exhibited relative high sensitivity (Table S2, ESI). In addition, an instrument-free visual detection of glucose was conducted shown in the inset of Fig. 5A, and the color changed from light blue to dark blue with increase of glucose concentration from 0 to 1 mM. The ranges for the serum glucose concentrations in healthy and diabetic individuals are 3–8 mM and 9–40 mM, respectively.30 As the linear range noted above, this assay method could also be used for colorimetric detection of glucose in diluted serum, and the results were shown in Table 1. The concentration of glucose in the serum sample was about 5.27 mM. In addition, glucose recovery was in the range from 96.7% to 103% with relative standard deviations (RSDs) below 5.54% for serum sample, and the results agree well with those obtained from the glucose kit, which indicated the reliability of the proposed method in practical applications.
image file: c5ra15837k-f5.tif
Fig. 5 (A) UV-vis absorption spectra of the TMB/PSS-GN solutions in the presence of glucose at various concentrations (a–n): 0, 0.006, 0.008, 0.01, 0.02, 0.04, 0.06, 0.08, 0.1, 0.2, 0.4, 0.6, 0.8, 1 mM using PSS-GN nanocomposites as a peroxidase mimic. Inset: photographs of the colored reaction mixtures for different concentrations of glucose (mM) (from left to right: 0, 0.01, 0.02, 0.04, 0.06, 0.08, 0.1, 0.2, 0.4, 0.6, 1). (B) The absorbance intensity at 652 nm plotted against the glucose concentration. The insert shows linear calibration curve between the absorbance and concentration of glucose.
Table 1 Results of the determination of glucose in serum samples
Method Original amount (mol L−1) Added (mol L−1) Found (mol L−1) Recovery (%) RSD (%)
Our method 5.27 × 10⁻⁵ 1 × 10⁻⁵ 6.24 × 10⁻⁵ 96.7 5.54
1 × 10⁻⁴ 1.56 × 10⁻⁴ 103.0 4.74
2 × 10⁻⁴ 2.41 × 10⁻⁴ 97.1 2.35
Glucose kits 5.35 × 10⁻⁵ 1 × 10⁻⁵ 6.42 × 10⁻⁵ 107.0 5.77
1 × 10⁻⁴ 1.60 × 10⁻⁴ 106.5 1.11
2 × 10⁻⁴ 2.46 × 10⁻⁴ 96.2 4.15


The selectivity of above proposed method for glucose detection was also tested under the same conditions by using saccharides, such as fructose, D-galactose, sucrose and maltose at concentrations as high as 5 mM (5 times higher than that of glucose). As shown in Fig. 6, there was an obvious absorbance change for the solution containing 1 mM glucose. Whereas for the solutions containing 5 mM fructose, D-galactose, sucrose or maltose, no obvious absorption changing could be observed (Fig. 6). The good selectivity of glucose could be attributed to the high affinity of GOx to glucose, while other saccharides could hardly be catalyzed by glucose oxidase. These results confirmed that the proposed assay had good selectivity toward glucose and indicated that PSS-GN nanocomposites had a good potential to be used as a new candidate for sensitive and selective glucose detection.


image file: c5ra15837k-f6.tif
Fig. 6 Specificity analysis of glucose detection. The difference in absorbance response between glucose (1 mM) and other sugars (5 mM).

Conclusions

In summary, by a simple reduction process, we have obtained the PSS-GN nanocomposites that exhibited good water dispersibility and higher peroxidase-like activity. As compared to natural enzymes, PSS-GN nanocomposites shows several advantages such as low-cost and high-stability. Moreover, kinetic analysis indicated that the catalysis is in accordance with typical Michaelis–Menten kinetics and followed a ping-pong mechanism. More importantly, the PSS-GN nanocomposites exhibited higher catalytic activity than that of GO and GN, which possibly attributed to the strong electrostatic interaction between the negatively charged PSS and the positively charged TMB. By using PSS-GN nanocomposites, visual and colorimetric methods for the detection of H2O2 and glucose were successfully realized, which are very simple, cost effective, sensitive and selective, and also could be conducted through instrument-free visual detections by naked eyes. The results revealed that the peroxidase-like catalytic activity of these PSS-GN nanocomposites could be expected to facilitate the application of this method in medical diagnostics as well as biological analysis, and the observation described in the present study provides a new avenue for the development of a sensitive biosensing system.

Acknowledgements

This work was supported by the National Natural Science Foundation of China (21205108), the Scientific Research Foundation for the Returned Overseas Chinese Scholars (State Education Ministry of China), and the Technology Foundation for Selected Overseas Chinese Scholars (Ministry of Personnel of China).

Notes and references

  1. H. H. Gorris, D. M. Rissin and D. R. Walt, Proc. Natl. Acad. Sci. U. S. A., 2007, 104, 17680–17685 CrossRef CAS PubMed.
  2. H. H. Gorris and D. R. Walt, J. Am. Chem. Soc., 2009, 131, 6277–6282 CrossRef CAS PubMed.
  3. G. Wulff, Chem. Res., 2002, 102, 1–26 CAS.
  4. E. Shoji and M. S. Freund, J. Am. Chem. Soc., 2001, 123, 3383–3384 CrossRef CAS.
  5. L. Z. Gao, J. Zhuang, L. Nie, J. B. Zhang, Y. Zhang, N. Gu, T. H. Wang, J. Feng, D. L. Yang, S. Perrett and X. Y. Yan, Nat. Nanotechnol., 2007, 2, 577–583 CrossRef CAS PubMed.
  6. W. S. Yang, J. H. Hao, Z. Zhang, B. P. Lu, B. L. Zhang and J. L. Tang, RSC Adv., 2014, 4, 35500–35504 RSC.
  7. Q. Wang, X. H. Yang, X. H. Yang, F. Liu and K. M. Wang, Sens. Actuators, B, 2015, 212, 440–445 CrossRef CAS PubMed.
  8. R. André, F. Natálio, M. Humanes, J. Leppin, K. Heinze, R. Wever, H. C. Schröder, W. E. G. Müller and W. Tremel, Adv. Funct. Mater., 2011, 21, 501–509 CrossRef PubMed.
  9. Q. W. Shu, C. M. Li, P. F. Gao, M. X. Gao and C. Z. Huang, RSC Adv., 2015, 5, 17458–17465 RSC.
  10. A. Asati, S. Santra, C. Kaittanis, S. Nath and J. M. Perez, Angew. Chem., Int. Ed., 2009, 48, 2308–2312 CrossRef CAS PubMed.
  11. W. F. Dong, X. D. Liu, W. B. Shi and Y. M. Huang, RSC Adv., 2015, 5, 17451–17457 RSC.
  12. R. J. Cui, Z. D. Han and J. J. Zhu, Chem.–Eur. J., 2011, 17, 9377–9384 CrossRef CAS PubMed.
  13. Y. F. Zhang, C. L. Xua and B. X. Li, RSC Adv., 2013, 3, 6044–6050 RSC.
  14. X. H. Wang, K. G. Qu, B. L. Xu, J. S. Ren and X. G. Qu, Nano Res., 2011, 4, 908–920 CrossRef CAS.
  15. T. R. Lin, L. S. Zhong, J. Wang, L. Q. Guo, H. Y. Wu, Q. Q. Guo, F. F. Fu and G. N. Chen, Biosens. Bioelectron., 2014, 59, 89–93 CrossRef CAS PubMed.
  16. Y. J. Song, K. G. Qu, C. Zhao, J. S. Ren and X. G. Qu, Adv. Mater., 2010, 22, 2206–2210 CrossRef CAS PubMed.
  17. J. J. Liang, Y. Huang, L. Zhang, Y. Wang, Y. F. Ma, T. Y. Guo and Y. S. Chen, Adv. Funct. Mater., 2009, 19, 2297–2302 CrossRef CAS PubMed.
  18. S. Niyogi, E. Bekyarova, M. E. Itkis, J. L. McWilliams, M. A. Hamon and R. C. Haddon, J. Am. Chem. Soc., 2006, 128, 7720–7721 CrossRef CAS PubMed.
  19. L. M. Lu, X. L. Qiu, X. B. Zhang, G. L. Shen, W. H. Tan and R. Q. Yu, Biosens. Bioelectron., 2013, 45, 102–107 CrossRef CAS PubMed.
  20. S. Stankovich, R. D. Piner, X. Q. Chen, N. Q. Wu, S. T. Nguyen and R. S. Ruoff, J. Mater. Chem., 2006, 16, 155–158 RSC.
  21. J. Luo, S. S. Jiang, R. Liu, Y. J. Zhang and X. Y. Liu, Electrochim. Acta, 2013, 96, 103–109 CrossRef CAS PubMed.
  22. Y. H. Xu, B. H. Lou, Z. Z. Lv, Z. X. Zhou, L. B. Zhang and E. K. Wang, Anal. Chim. Acta, 2013, 763, 20–27 CrossRef CAS PubMed.
  23. L. Wang, R. Yang, J. Chen, J. J. Li, L. B. Qu and P. B. Harrington, Food Chem., 2014, 164, 113–118 CrossRef CAS PubMed.
  24. J. J. Li, D. D. Miao, R. Yang, L. B. Qu and P. B. Harrington, Electrochim. Acta, 2014, 125, 1–8 CrossRef CAS PubMed.
  25. S. Bose, T. Kuila, M. E. Uddin, N. H. Kim, A. K. T. Lau and J. H. Lee, Polymer, 2010, 51, 5921–5928 CrossRef CAS PubMed.
  26. P. K. Ang, S. A. Wang, Q. L. Bao, J. T. L. Thong and K. P. Loh, ACS Nano, 2009, 3, 3587–3594 CrossRef CAS PubMed.
  27. D. Jamroz and Y. J. Marechal, J. Phys. Chem. B, 2005, 109, 19664–19675 CrossRef CAS PubMed.
  28. D. Li, M. B. Muller, S. Gilje, R. B. Kaner and G. G. Wallace, Nat. Nanotechnol., 2008, 3, 101–105 CrossRef CAS PubMed.
  29. D. J. T. Porter and H. J. J. Bright, Biol. Chem., 1983, 258, 9913–9924 CAS.
  30. Y. Xu, P. E. Pehrsson, L. W. Chen, R. Zhang and W. J. Zhao, J. Phys. Chem. C, 2007, 111, 8638–8643 CAS.

Footnote

Electronic supplementary information (ESI) available: Schematic illustration of the formation of PSS-GN nanocomposites, Zeta potential analysis of GO, GN and PSS-GN nanocomposites, steady-state kinetic assay and catalytic mechanism of enzyme mimics (PSS-GN nanocomposites and GO), UV-vis absorption spectra of the TMB/GO solutions in the presence of H2O2 at various concentrations, the absorbance intensity at 652 nm plotted against the H2O2 concentration, and comparison of nanomaterials-based methods for the determination of glucose as noted in the text. See DOI: 10.1039/c5ra15837k

This journal is © The Royal Society of Chemistry 2015
Click here to see how this site uses Cookies. View our privacy policy here.