
Graphene-reinforced poly(vinyl alcohol) electrospun fibers as building blocks for high performance nanocomposites
Sajjad Ghobadia,
Sina Sadighikiaa,
Melih Papilaab,
Fevzi Çakmak Cebeci*ab and
Selmiye Alkan Gürsel*ab
aFaculty of Engineering and Natural Sciences, Sabanci University, 34956 Istanbul, Turkey. E-mail: fccebeci@sabanciuniv.edu; selmiye@sabanciuniv.edu
bSabanci University Nanotechnology Research and Application Center (SUNUM), Sabanci University, 34956 Istanbul, Turkey
First published on 30th September 2015
Abstract
Graphene-containing fibrous structures with a high level of affinity towards a polymer matrix solution have been proved to be promising for high performance macroscopic nanocomposite reinforcement purposes. In this study, for the first time, co-solvent assisted well-dispersed thermally reduced graphene oxide dispersions were successfully prepared. Graphene solutions were then further dissolved in poly(vinyl alcohol) solutions and electrospun, respectively, producing hollow nanofibers, for which key properties, such as solution extensional viscosity and fiber mechanical properties, were studied. The hollowness of the as-spun fibers were comprehensively investigated through a focused ion beam-based advanced cutting and cross-section technique in a dual beam instrument. The effect of reduced graphene oxide content on individual fiber alignment of mats subjected to tension forces was studied via scanning electron microscopy. The analysis revealed that the optimum alignment was achieved at 0.6 wt% graphene-content as-spun mats, in which the Young's modulus was improved by over 60% compared to the neat PVA as-spun mats. The mentioned phenomenon was found as responsible for superior mechanical properties.
Introduction
The incorporation of graphite derivatives, such as reduced graphene oxide (rGO), into aqueous polymer solutions has been reported to introduce a noticeable improvement in overall properties of the resulting nanocomposite material under operation. The constructive effect of graphene addition was particularly reported to be tremendously crucial in the fields of ultrasensitive sensors1 and catalyst support applications.2 However, to the date a comprehensive systematic investigation on the defining characteristics of such nanocomposites with respect to material compositions for a special, yet easy to obtain, type of graphene without any functional groups was not reported in the literature.Superior mechanical, thermal and electrical properties along with extremely high specific surface area are defining characteristics of graphene as a 2D material which has resulted in many applications, such as electrochemical sensors,3 micro and nano-electronics devices,4 fuel cell membranes design for high-tech applications,5 anti-corrosion coatings,6 flame retardant high performance nanocomposites,7 smart membranes for separation,8 and mechanical reinforcement applications,9 proposed by research groups during the past decade.10 Regarding the mentioned individual properties of graphene, particularly 2D filler performance of the material and its derivatives in polymer based nanocomposites prepared via spin-coating of graphene layers on polymer substrate has been proved to be promising.11
Poly(vinyl alcohol) (PVA), was reported to be one of the most reliable bio-degradable precursors in bio-compatible materials preparation.12 It was shown that PVA demonstrates interesting performance in different applications including enzyme immobilizing composites,12 and transparent electrode membranes.13 Considering PVA's low mechanical, thermal and electrical properties, the urge to introduce other components in the structure with higher reinforcement abilities has been reported by different researchers.12,14
The most important driving force of this approach results from the polymer's unique structural feature of desirable hydroxyl side groups, providing active sites for hydrogen-bond formation. This feature makes most of polar organic solvents as well as those containing filler dispersions perfectly dispersible in PVA aqueous solutions. Thus the PVA/rGO mixture with an electrospinning compatible quality can be obtained.15
The most reliable approach to optimize the final composite properties was found to be benefiting from both the reinforcing nature of the filler material,5,16 and synergistically aided by the hydrogel formation potential of the PVA itself.12 This goal was achieved by use of dimethyl formamide (DMF) as co-solvent to the main aqueous solution. This special combination of solvents, DI water as PVA solvent and DMF as the rGO dispersing media, lowered the total vapor pressure of solution, improving the electrospinning compatibility of the solution. Although synergistic effect of combining these methods in the final material properties is anticipated, there is no record of pursuing this complex method.
High aspect-ratio nanofibers with different functionalities and tunable direction of orientations can be easily achieved via electrospinning. This approach for fibrous nanocomposite preparation was reported as one of the most reliable methods among fibrous structure fabrication techniques for its rapidness and ease of performance, process flexibility and low cost of assembly.3a,4b,10b,10c,17 Because of the hardship in achieving homogeneous dispersion of thermally reduced graphite oxide (rGO) in aqueous media, effective control on concentration of filler material in hydrophilic matrix media was not achieved via electrospinning process.11a,16b
In this study PVA/graphene fibrous nanocomposites assisted by DMF as co-solvent, as well as graphene dispersing media, were prepared through electrospinning process. To our knowledge, for the first time, addition of this specific filler material, up to the highest ever recorded concentration of 2 wt% in dry mat (rGO/PVA ratio within the dry product), to the matrix media was performed via use of the co-solvent as a dispersing agent. Along with study on thermal, electrical and mechanical properties of as-spun mats, as a pioneer study for graphene containing suspensions, extensional viscometry analysis was used as an index of solution behavior under electrospinning process conditions. The effect of additive materials, hydrogel forming co-solvent DMF and rGO as 2D filler, on suspension properties such as apparent viscosity and normalized diameter breakdown time, as the suspension jet quality indicator, was investigated.
As a desirable comprehensive study on interior morphology of nanofibrous composites, high-resolution electron microscopy techniques such as scanning electron microscopy (SEM) and transmission electron microscopy (TEM)9b were used. Additionally, in order to have more concise insight about the interior structure of fibers, they were cut using advanced Focused Ion Beam (FIB) techniques in a FIB/SEM dual beam platform with optimized parameters. The hollow structure of fibers along with graphene layers arrangement inside the nanocomposite mats was confirmed.
Experimental methods
Materials
N,N-Dimethyl formamide, graphite flakes, polyvinyl alcohol (average MW 89![[thin space (1/6-em)]](https://www.rsc.org/images/entities/char_2009.gif) 000–98000 g mol−1), KMnO4, H2SO4, H3PO4, HCl, H2O2, and ethanol were purchased from Sigma-Aldrich (Taufkirchen, Germany) and used with no further purification.
000–98000 g mol−1), KMnO4, H2SO4, H3PO4, HCl, H2O2, and ethanol were purchased from Sigma-Aldrich (Taufkirchen, Germany) and used with no further purification.
Reduced graphite oxide synthesis
Graphite oxide (GO) was prepared via an improved method published by Marcano and coworkers.10a During this procedure, a mixture of 3 grams of graphite flakes, and 18 grams of KMnO4 was initially prepared. The process was followed by addition of a 9:1 mixture (400 mL in total) H2SO4/H3PO4 to the reaction vessel kept in an ice/water bath. The media was then heated up to 50 °C and followed by overnight stirring at constant temperature. The reaction was stopped by addition of the reaction media onto a mixture of 400 mL ice and 10 mL H2O2. The mixture was washed for several times with dilute mixtures of HCl, DI water, and ethanol, respectively. The final graphite oxide product was dried in vacuum oven for 24 hours.
Thermally reduced graphite oxide (rGO) was then prepared via thermal exfoliation of graphite oxide using a tubular furnace-quartz tube system under a noble gas (argon) atmosphere. During that process, the isothermal step was set at 1000 °C for 12 minutes. The resulting thermally reduced graphene oxide material was used without any further treatment.
Suspension preparation
The electrospinning suspension was prepared via a two-step process. (i) Certain amount of rGO (Table 1) was added to 3.11 mL of DMF. The rGO dispersion was then prepared via ultrasonic dispersing in a homogenizing bath for 24 hours. (ii) 8 mL of 16.67 w/v PVA aqueous solution was added to DMF/rGO suspension followed by stirring for 30 minutes. The final polymer concentration was 12 w/v%. As prepared electrospinning suspensions were examined using capillary breakup extensional rheometry analysis device, providing information about suspension viscosity behavior under constant drawing rate as well as suspension jet break-down profiles over time.| Sample | rGO content (wt%) | Average diameter (nm) | Young modulus (MPa) | Tensile strength (MPa) |
|---|---|---|---|---|
| PW0 | 0 | 338 | 64.73 ± 5.95 | 2.97 ± 0.72 |
| PWD0 | 0 | 552 | 67.12 ± 9.12 | 3.21 ± 0.61 |
| G0.2 | 0.2 | 389 | 69.84 ± 7.66 | 3.16 ± 0.85 |
| G0.4 | 0.4 | 344 | 101.73 ± 4.88 | 2.95 ± 0.11 |
| G0.6 | 0.6 | 235 | 103.98 ± 12.10 | 3.30 ± 0.09 |
| G0.8 | 0.8 | 276 | 91.43 ± 7.50 | 3.38 ± 0.52 |
| G1 | 1 | 292 | 87.67 ± 6.93 | 4.83 ± 0.28 |
| G2 | 2 | 275 | 85.67 ± 12.51 | 5.51 ± 0.37 |
In order to have the best interpretation of their properties, samples were categorized into two categories. Those with up to 0.6% graphene contents were regarded as low content samples, while those with higher filler concentrations categorized into the high content ones.
Electrospinning
The final suspension was then conveyed to a 10 mL syringe. The electrospinning process was conducted with fixed parameters of needle tip-collector distance at 14 cm, potential difference at 10 kV, and flow rate at 4.2 μL min−1. The electrospun mats was collected on aluminum foil and then peeled off for further characterization.UTM analysis
The mechanical properties of as-spun mats were studied by a UTM device. The grip set was chosen for such measurement was consisted of pressurized elastomeric grips, suitable for thin films. A thin film sample compatible load cell of 200 N capacity was used for the tension measurements. For each sample 5 respective specimens of 50 × 20 mm2 dimensions was directly cut from the mats. The samples were further trimmed at their edges in order to prevent any stress concentration zone appearance.Microscopy analyses
The interior texture of the structure was investigated by a FIB/SEM Dual-Beam platform. For this investigation Jeol JIB-4601F Dual-Beam platform was used. Fibers were cut using the FIB technique and imaging was done simultaneously with high-resolution scanning electron microscopy (HR-SEM). Apart this, a scanning electron microscopy imaging (SEM) was conducted to study surface texture as well as interior structure of fibers. A Zeiss Leo supra 35VP SEM-FEG was used in this step. This analysis was also used for average fiber diameter measurements via Image J software. Transmission electron microscopy provided to further confirm the location of rGO in the fiber structures. In addition to the FIB, hollowness of as-spun fibers was investigated in a Jeol 2000FX TEM system, as well.Thermal stability study
The thermal stability of as-spun mats was studied via a Netzsch TG-DTA analysis device. The nitrogen gas atmosphere was used for this set of experiments, during which, the samples were heated up to 700 °C with 10 °C min−1 heating rate.Electrical conductivity measurement
Nanofibrous mats were subjected to electrical conductivity measurement via a CR-Cascade Microtech CP4 4-point probe electrical conductivity measurement device.Differential scanning calorimetry analysis
In order to observe the crystallinity of the mats, DSC analysis was conducted on selected samples by TA-Instruments, Q2000 DSC device. The analysis method was to heat up the specimen from 25 °C up to 250 °C and then cool down to the initial temperature. Having known the enthalpy change value for the 100% crystalline PVA as 161.6 J g−1,18 the crystallinity fraction of the samples were calculated based on the ASTM E793 standard.Suspension rheology analysis
As prepared electrospinning suspensions were examined using a Thermo Scientific Haake-CaBER 1 capillary breakup extensional rheometer. The information about the change in the apparent viscosity and normalized suspension column diameter with respect to strain rate and time were studied, respectively.Results and discussion
Reduced graphite oxide characterization
The XRD spectra of the GO, and rGO, as the final product shows perfect exfoliation of the graphene layers in a way that the relative peak for oxide groups to be found on graphite oxide layers were completely removed in reduced graphite oxide sample. Another confirmation on the layer exfoliation can be achieved by presence of flat line spectrum at 20–25 degrees (Fig. 1A). This study conducted via a Bruker D8 Advanced XRD system. | ||
| Fig. 1 (A) XRD analysis and (B) Raman spectra of GO and rGO. | ||
Raman spectroscopy (Renishaw, UK) was used to show the desirable exfoliation of the product in which graphite oxide and reduced graphene oxide show an increase in IG:ID peak intensity ratio in TRGO sample in comparison with GO from 1.02 and 1.2 (Fig. 1B). It can be concluded from these values that the interlayer spacing, as a sign of material exfoliation, was greatly increased.10b
The SEM images of graphite oxide and reduced graphite oxide show their layered structures being changed from a packed form in GO, where the individual layers are hardly can be detected, to rGO with a well expanded structure with explicit borderlines between the related graphene layers (Fig. 2A and B, respectively).
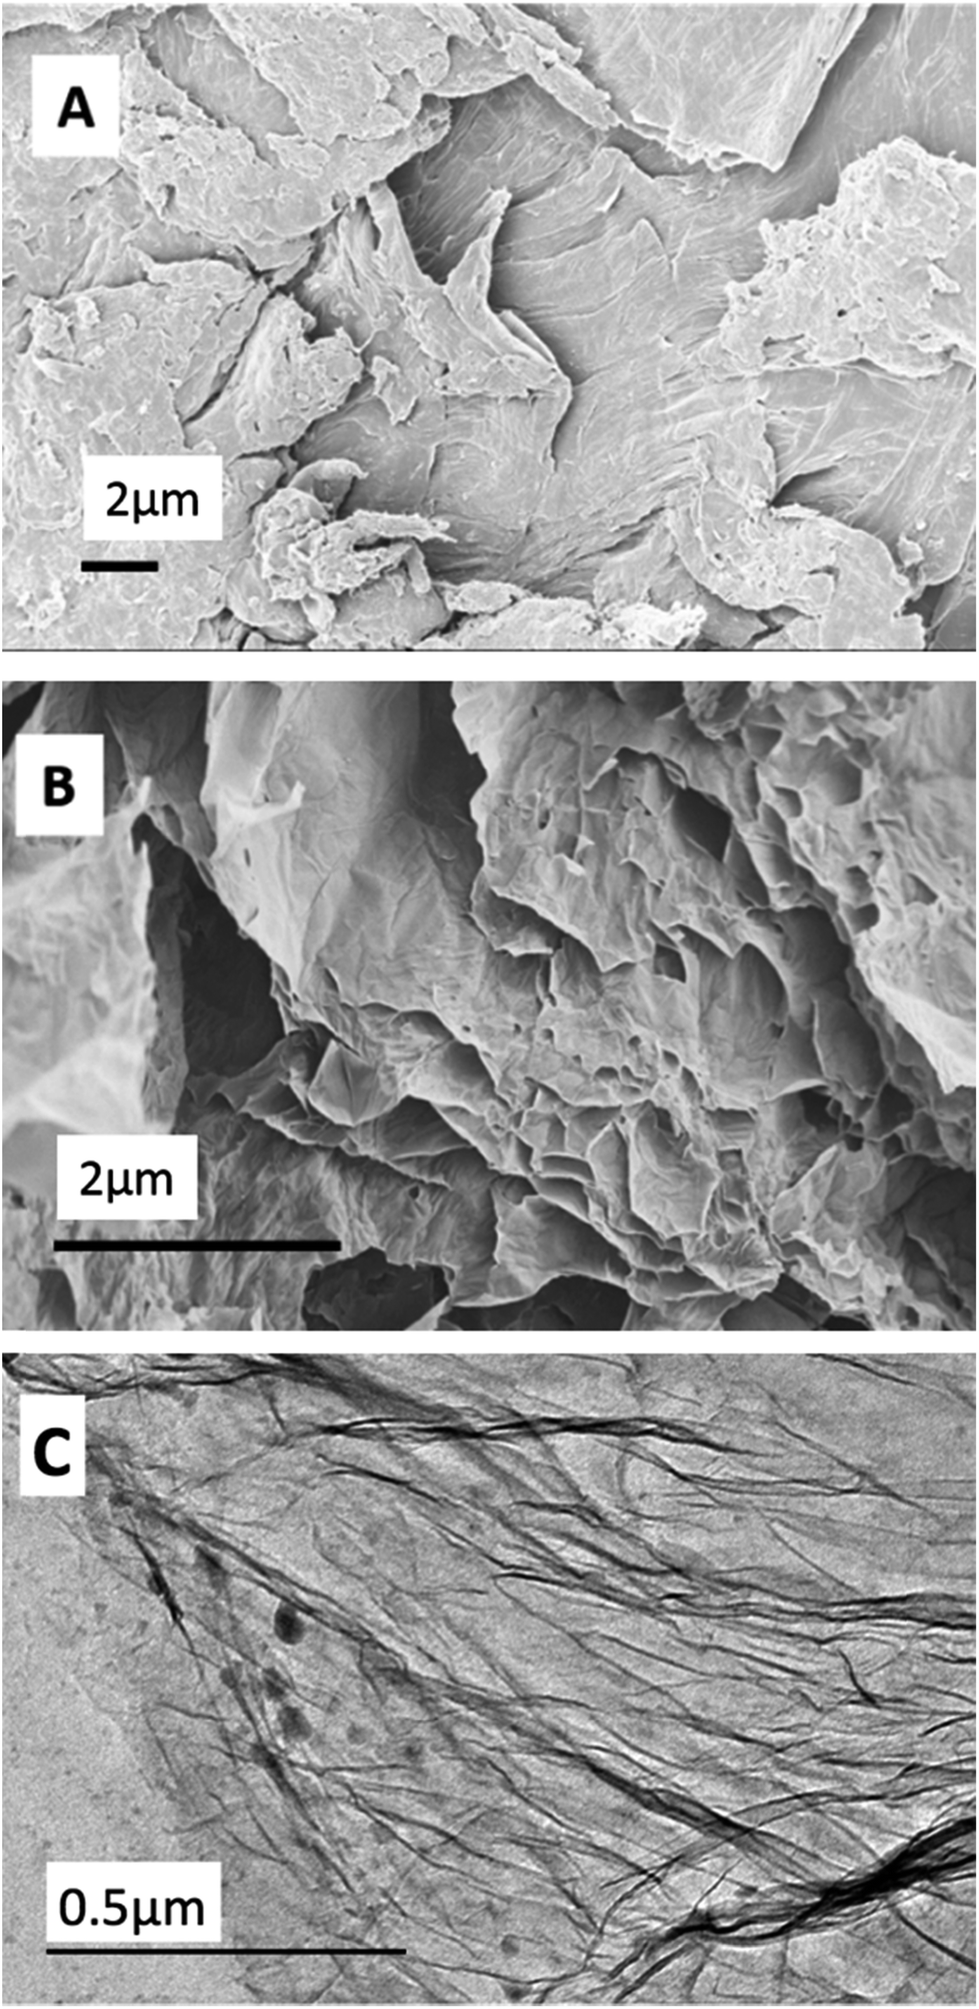 | ||
| Fig. 2 SEM images of (A) GO, (B) rGO, and (C) TEM image of rGO. | ||
The TEM image of the rGO layers (Fig. 2C) shows them to be transparent indicating enrichment to few layer structured graphene material. It also shows smooth surface without any significant feature or twisted area. This effect results in an obtaining higher surface area filler material. This property resulted in further increase the possibility of achieving polymer/filler interface. However, it was shown that the quality of rGO dispersion played an important role to achieve the desired load transfer at the mentioned interface.
Electrospinning suspension analysis
As it was previously reported,19 the solution properties have a great effect on obtained fiber microscopic properties, such as morphology, alignment, and average diameters, as well as macroscopic properties, e.g. thermal and mechanical properties. Extensional viscometry as a novel method for analysis of rheological behavior of suspensions and solutions under constant tension forces, can be used as an index of the suspension behavior during the electrospinning process. This ability of modulation, can further assist the analysis of fluid jet quality and its consistency under similar conditions. The apparent viscosity change with respect to strain rate for the selected samples (Fig. 3A) shows the effect of hydrogen bond interaction between DMF, as co-solvent, and PVA chains.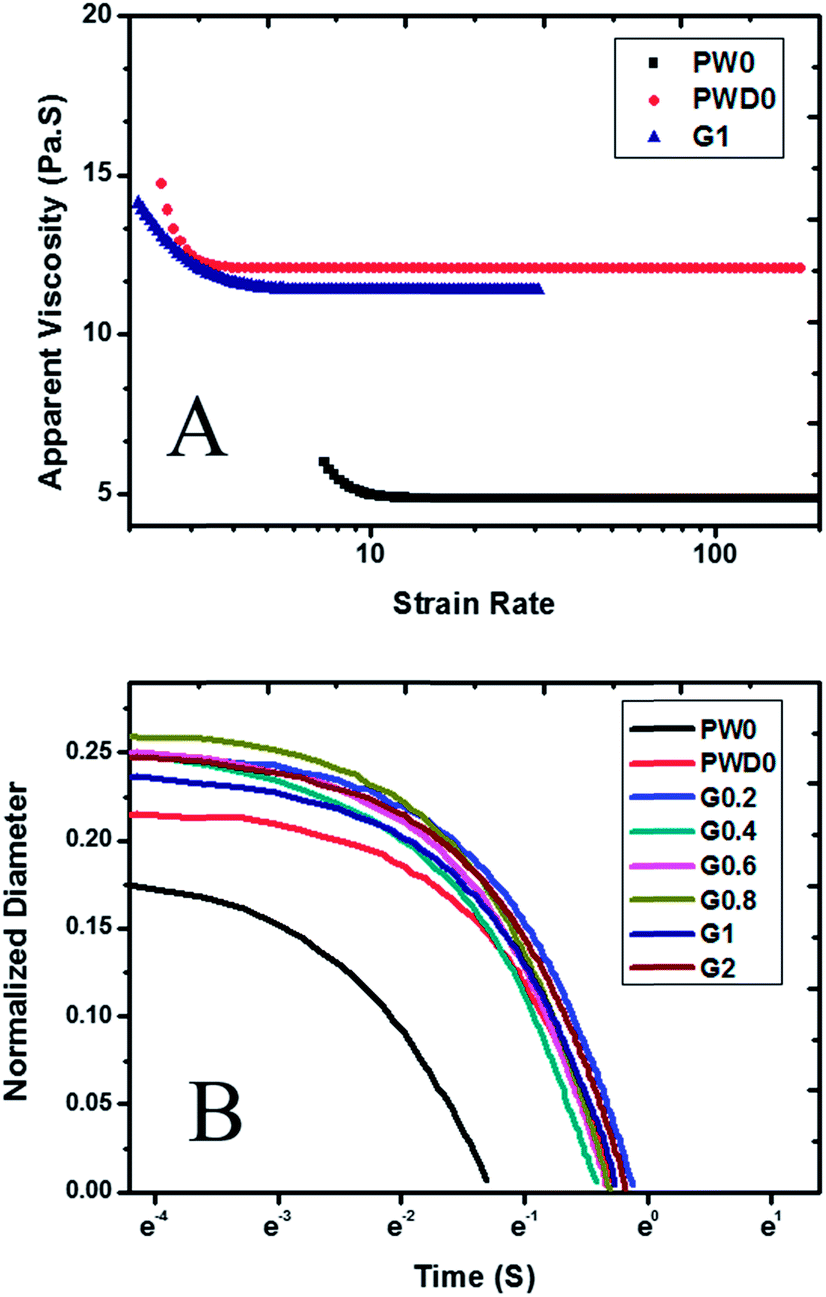 | ||
| Fig. 3 (A) Apparent viscosity vs. strain rate of PW0, PWD0, and G1 samples, and (B) normalized diameter vs. time graph of all samples. | ||
The increase in the approximate apparent viscosity values of DMF containing sample (PWD0) signifies that the physical hydrogel formation takes place among polymer chains by introduction of the co-solvent. Thus local viscosity heterogeneity within the polymer solution occurs. The viscosity of PWD0 sample was recorded as twofold higher comparing to the PW0. This solution microstructure change further increased chain movement limitations. Increased apparent viscosity values with respect to strain rate were then concluded to be resulted from the mentioned change in chain movement behavior.12 The viscosity and overall behavior of solution exhibits no significant change in graphene-containing G1 sample. This is regarded to low concentration of filler compared to the matrix as well as its homogeneous dispersion benefitted from the perfect interaction of DMF and PVA aqueous solution. This behavior signifies that the filler addition will not show a noticeable interference with the polymer solution behavior during the electrospinning process. However, localized graphene clusters with limited interaction with polymer solution resulted in formation of viscosity fluctuating regions within the suspension. These regions can become nanometer scale inconsistent regions under applied tangential forces, e.g. electrospinning, therefore the suspension showed a decrease in viscosity. As a result of viscosity increase in DMF containing samples in comparison with PW0 sample, the normalized diameter breakup time values were significantly increased (Fig. 3B). Such behavior is a result of ultimate resistance of the former type of fluid against droplet breakup phenomenon via formation of high modulus hydrogel rich areas with elasticity improving characteristics.20 This effect shows that under a constant force, such as the fluid jet forming force during electrospinning, the graphene containing samples will have higher jet consistency resulting in further improvement of fiber quality.21
Exterior texture and interior morphology analysis
The SEM images of the electrospun fibers show that at low graphene concentration samples (Fig. 4B) as a result of desirable graphene dispersion achievement within the polymer solution, the fiber morphologies as well as surface textures were almost identical to the pristine polymer samples (Fig. 4A). However, the appearance and density of irregular particles were increased in the high filler-content samples (Fig. 4C). This phenomenon was due to lack of success in achieving the desired filler dispersion within the PVA solution media. In that regard, graphene agglomerations as well as bead-like features were introduced to the mat structures. The morphology consistency was regarded as a parameter reflecting the fluctuations in electrospinning process. It was concluded that poor filler dispersion introduced heterogeneity in the solution, thus process fluctuations were also increased.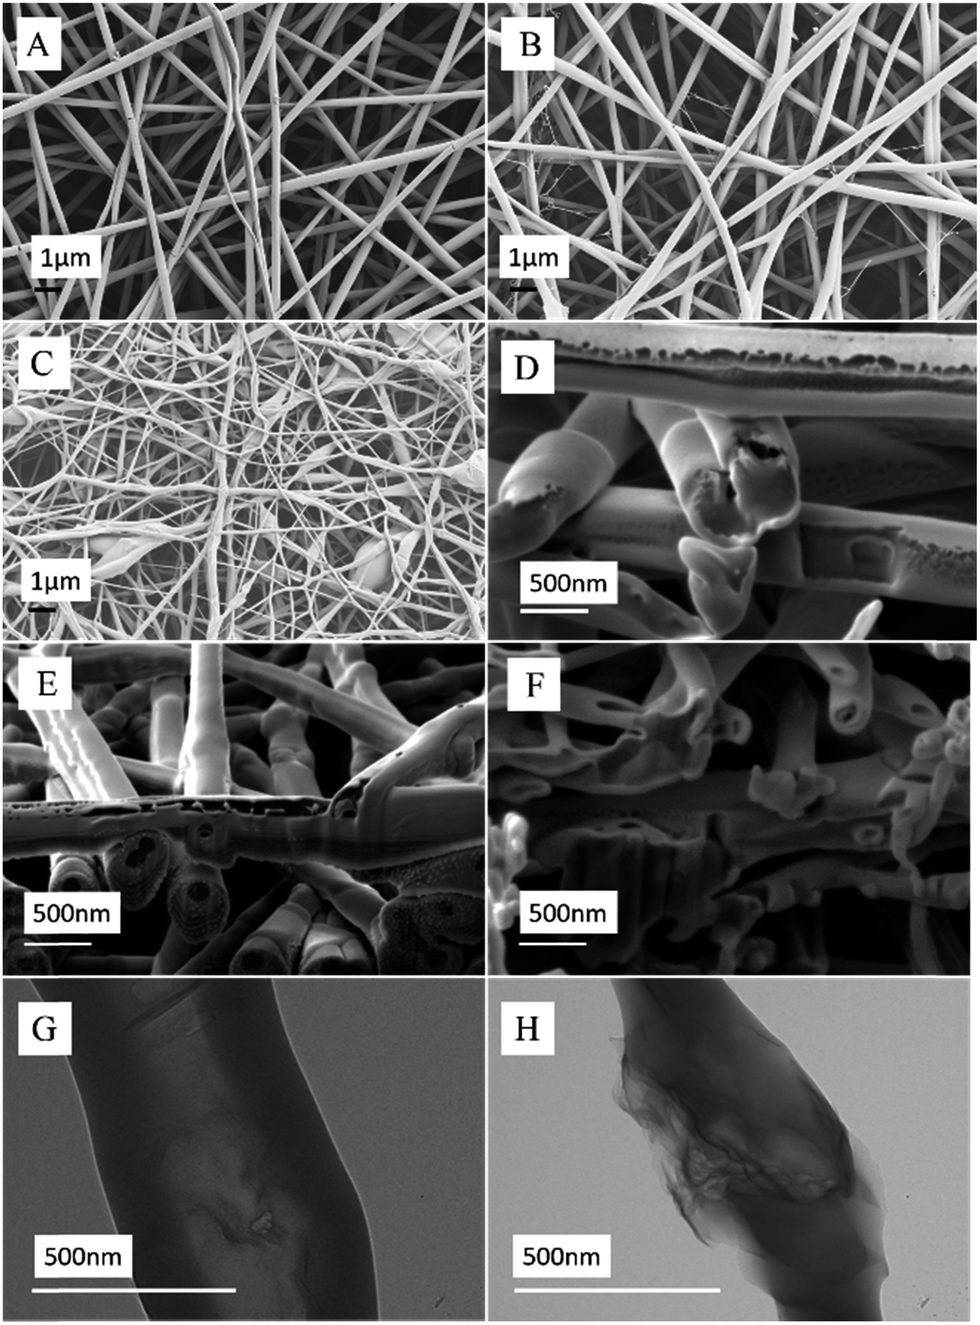 | ||
| Fig. 4 SEM images of samples (A) PW0, (B) G0.6, (C) G2, SEM images of FIB milled samples (D) PWD0, (E) G0.6, (F) G2, TEM images of (G) G0.6, and (H) rGO cluster in sample G2, respectively. | ||
The increase in fiber diameter values (Table 1) of PWD0 sample is considered as a result of physical hydrogel forming effect of DMF/polymer interactions. As it was mentioned during rheology investigation, this effect resulted in higher viscosity values. Thus, the required force to obtain fine fibrous structure was increased. As it was clarified by rheology analysis, well-distributed filler dispersion in the electrospinning solution played an effective role in solution viscosity increase, thus improvement in jet formation quality with minimal process defects was achieved. As a result the fiber diameters showed a decreasing trend with respect to graphene content. However, at higher filler concentrations, such as G1 and G2 sample, due to presence of filler clusters, the fluctuations during the process will be increased. Local viscosity fluctuations arising from graphene cluster formation in the solution consequently resulted in relatively higher fiber diameters as well as irregular morphologies appearance. The effect of viscosity change on increase in process disturbances producing such defects cannot be ignored as well. As shown in Fig. 4G that for G0.6, hollow interior structure was formed within the electrospun mats by introduction of rGO in the fiber structure. Although formation of filler agglomerations have been shown in recent reports,22 our imaging confirmed that graphene-based fillers have been perfectly dispersed in the media as a result of the extensive dispersion process in the DMF co-solvent media. This high quality of polymer–filler interaction was achieved by synergistic effect of stabilizing nature of PVA in interaction with DMF co-solvent. As a result, in Fig. 2H, graphene layer-like textures embedded within the fibrous structure were observed indicating that a desirable exfoliation of graphitic layers was also achieved.23 However, the TEM image of G2 sample (Fig. 4H) shows that the graphene textures occurred at irregular morphology sites of fibers. This effect is a result of cluster formation tendency among graphene layers during the fiber formation.
Electrical conductivity measurement
The electrical conductivity results of as-spun nanofibrous mats measured are shown in Table 2. Although for graphene containing samples a significant improvement of two orders of magnitude in comparison with the pristine samples was recorded, due to high amount of insulating PVA content and its dominant coverage all around the graphene nanosheets, effective contact among the additive material's particles was not formed. This effect resulted in electrical conductivity values at μS cm−1 range. The highest electrical conductivity value was recorded for G2 sample as 18.34 μS cm−1. This phenomenon was reported to be effective on the electrical conductivity of similar fibrous structures by other research groups as well.18| Sample | Electrical conductivity (μS cm−1) |
|---|---|
| PW0 | 0.04 ± 0.01 |
| PWD0 | 0.3 ± 0.04 |
| G0.2 | 6.2 ± 1.2 |
| G0.4 | 9.7 ± 1.9 |
| G0.6 | 10.3 ± 2.5 |
| G0.8 | 14.1 ± 1.9 |
| G1 | 15.6 ± 3.0 |
| G2 | 18.3 ± 2.8 |
Thermal stability and crystallinity
The thermal gravimetric analysis (TGA) results shows that the decomposition behavior of the electrospun mats have been relatively improved due to incorporation of graphene compartment (Fig. 5). The temperature region for the material decomposition within the PWD0 sample with no incorporated graphene is recorded as 345 °C. By introducing graphene the thermal decomposition temperature was increased by over 20 °C for P0.2, where a further 60 degree improvement was shown in higher graphene containing sample behaviors. This effect can also be noticed by studying the remaining mass at 600 °C where the highest residue was recorded at high graphene-content samples. This shows the constructive effect of graphene through thermal stability improvement of the fibrous structure.9b,14,24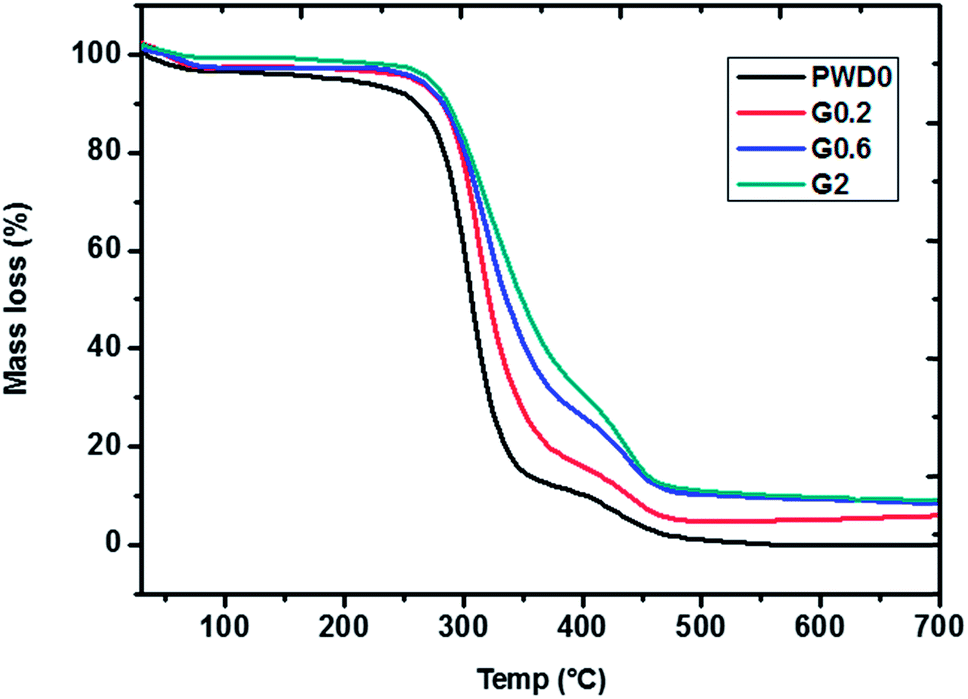 | ||
| Fig. 5 TGA analysis graphs of electrospun mats. | ||
The information about decomposition temperature regions of as-spun fibrous mats (Table 3) show great improvement of approximately 110 °C, and over 170 °C increase in first and second decomposition steps after dehydration of mats at around 100 °C, respectively.
| Sample | 1st Decomposition (°C) | 2nd Decomposition (°C) |
|---|---|---|
| PW0 | 197–286 | 299–368 |
| PWD0 | 204–341 | 341–429 |
| G0.2 | 289–372 | 372–486 |
| G0.4 | 246–398 | 398–493 |
| G0.6 | 230–380 | 380–514 |
| G0.8 | 259–406 | 406–527 |
| G1 | 277–402 | 402–510 |
| G2 | 281–395 | 395–541 |
The governing effecting parameters in the case of strain at tensile strength are the polymer crystallinity as well as graphene cluster alignment. The FT-IR analysis was used to determine the change in crystallinity of polymer chains within the fibers with the increase in graphene amount (Fig. 6A). The device used for this analysis was a Thermo Scientific iS10 FT-IR platform. The peak at 1144 cm−1 was mentioned to be a determining peak for C–O or –OH groups in crystalline regions.14 Since there was no observed peak shift for the crystallinity peak with respect to graphene content change, the crystallinity behavior of as-spun mats was proved to be similar.
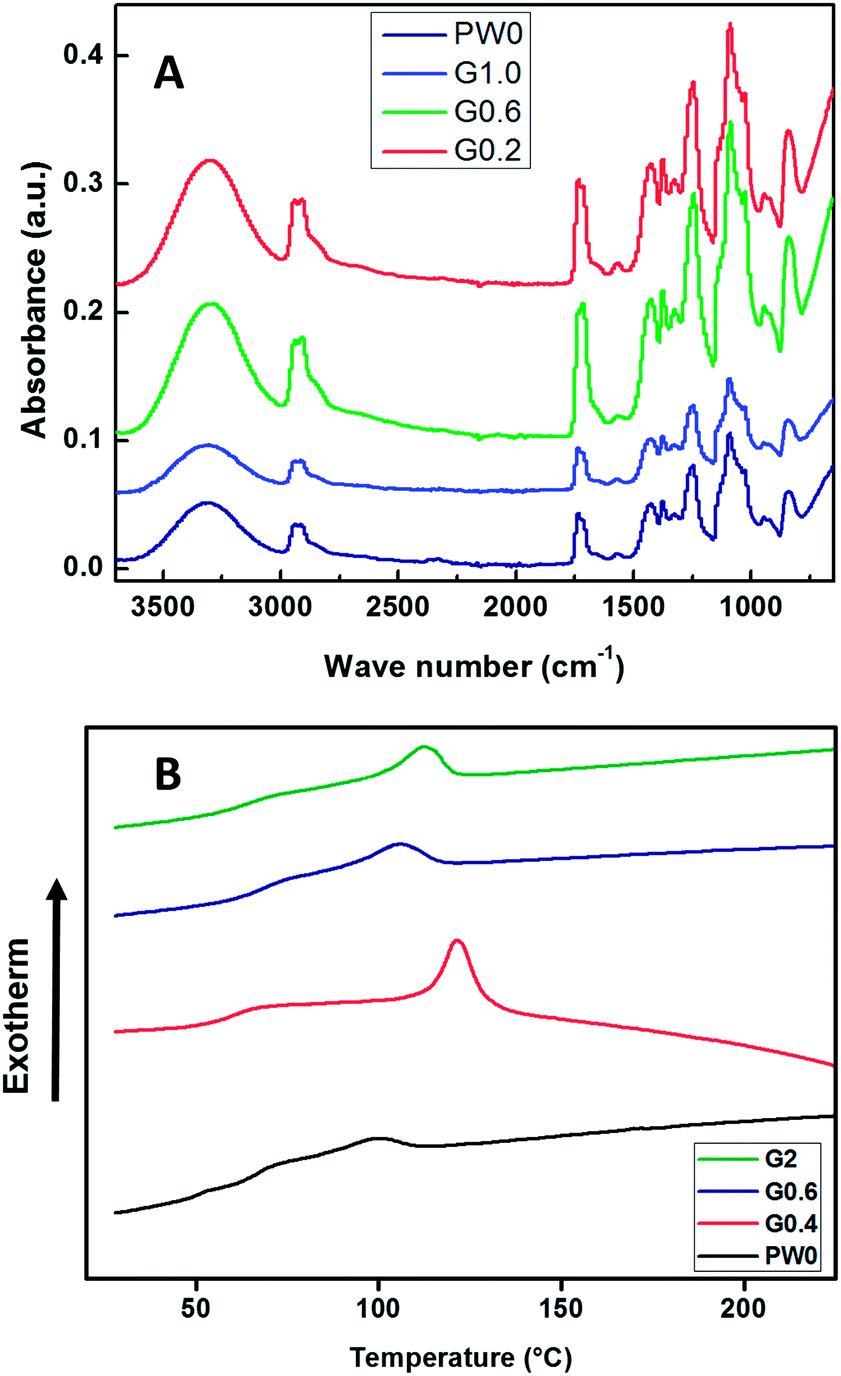 | ||
| Fig. 6 (A) FT-IR spectra of selected sample and (B) DSC analysis of selected as spun mats at the cooling region. | ||
The DSC analysis was conducted to investigate the crystallinity of as-spun mats (Fig. 6B). The crystallinity of the samples was 12.7% with minimal standard deviation of 0.46. The thermal behavior of the samples as well as their respective calculated degree of crystallinity were also similar with the previous reports in the literature.25
Mechanical properties of nanocomposites
The mechanical test results can be discussed in two regions of deformation: initial part of the testing (small deformation) shows the incorporation of graphene led to increase of stiffness compared to neat PVA fibers (Table 1), G0.6 sample giving the highest, in which the highest level of constructive polymer–graphene interaction with desirable load transfer ability was observed.9a,14 The second part after the noticeable change in the slope suggests yielding-like behavior and associated large deformation afterwards. The slope/stiffness in the large deformation zone indicates that higher the GO content results in higher stiffness and strength (Table 1 and Fig. 7C). A gradual increase in tensile strength values was recorded as the graphene content in the PVA fibers was increased (Table 1 and Fig. 7C). This effect was mentioned to be the result of both high strength constituents along with constructive polymer/filler interaction. However, the synergistic effect of graphene layer alignment among the high filler-concentration mats is found to be responsible for their desired improved strength (Fig. 4H).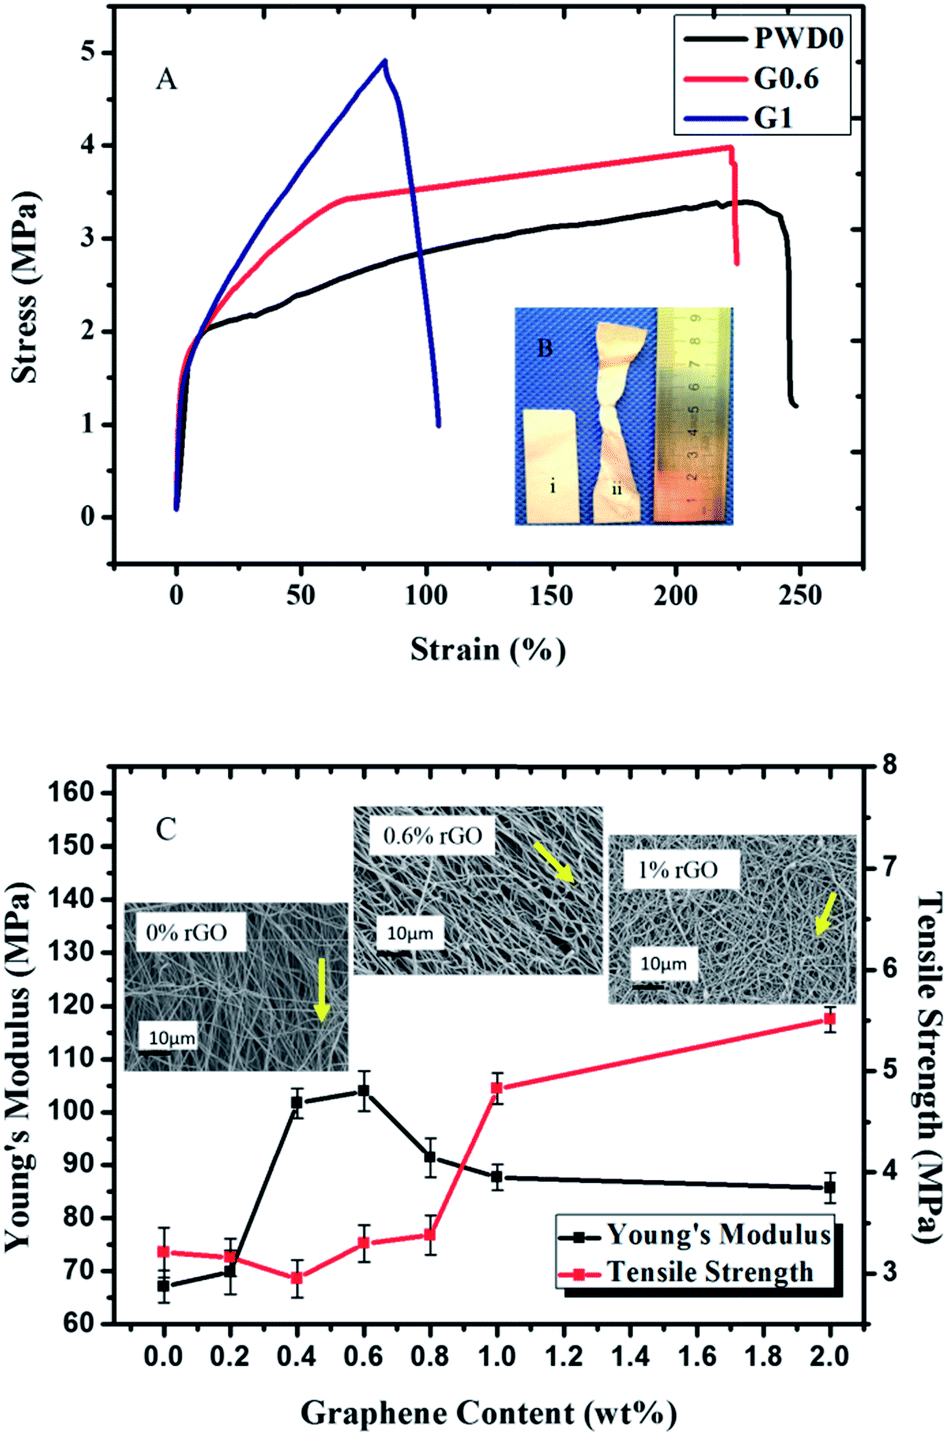 | ||
| Fig. 7 (A) Stress–strain plot of electrospun mats, (B) picture of G2% specimen (i) before, and (ii) after tension test, and (C) Young's modulus (in the initial 0.2% strain range) and tensile strength and the trend of fiber alignment as the tension test progressed until failure with respect to graphene content as a key factor responsible for the change in as-spun mats' mechanical properties. | ||
At low graphene content a desirable dispersion of filler particles was easily achieved, while at higher contents the ultimate dispersion achieved was not as homogeneous as of the lower concentrations. This effect resulted in formation of either weak polymer–graphene or graphene–graphene interfaces. The irregular morphologies shown in the SEM images of high concentration samples also confirm the increase in filler–filler interactions. The higher the density of such interactions, less deformability may be expected also reported by (Fig. 7A).9a The specimen macroscopic necking-like behavior was observed as exemplified in Fig. 3B. The responsible phenomenon for such a large deformation can arguably be attributed to not only to the plastic deformation of the individual fibers, but also change in orientation of the fibers (random as received) relative to the load direction. Fig. 7B also shows how numerous nanofibers were finally aligned in particular for low concentration of graphene. In G0.6 sample, similar to pristine sample, high level of fiber alignment was observed, while by increasing the graphene content, the fibrous structure remained stable during the drawing process and the fiber alignment behavior showed a dramatic diminishing trend (Fig. 7C). In regard to large deformation zone until failure, the plastic deformation of the fibers is also assessed by the change in the stretched fibers. Fig. 8 suggest the contribution of the plastic deformation of the fibers was substantial for the PVA fibers alone, whereas the rGO content seemed to be limiting factor for the permanent change in the average diameter of the fibers. The low graphene-concentration samples had a gradual increasing behavior in terms of initial stiffness, while in the high filler-content nanofibers an abrupt decrease in terms of the mentioned strain values was shown (Fig. 7C). The effect of the increase in brittle, mechanically weak filler–filler interfaces also provides confirmation for the Young modulus change of the samples in terms of graphene content. The highest modulus was recorded for the G0.6 sample, in which the highest level of constructive polymer–graphene interaction with desirable load transfer ability was observed.9a,11a,14 As it was shown in the Fig. 7C, The Young's modulus starts to increase in the low rGO-content samples, where the tensile strength does not show a noticeable change. The study suggests that such a phenomenon was caused by constructive interactions between well-dispersed rGO and polymer matrix's chains which will further improve Young's modulus. However, at those concentration values, despite the desirable load transfer to the filler, tensile strength remains almost the same due to low concentration of high strength component in the nanostructure.
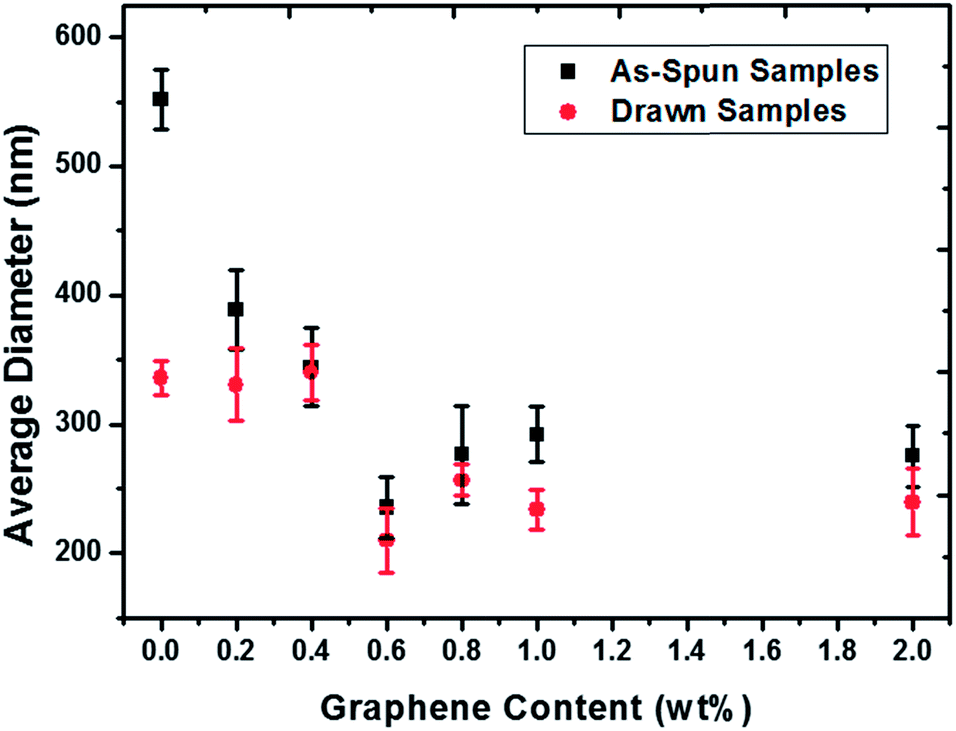 | ||
| Fig. 8 Average diameter of sample fibers at as-spun and after drawing during UTM analysis states, respectively versus the incorporated graphene content. | ||
Whilst studying the trend of the mentioned mechanical properties in high concentration samples, 0.8–2 wt%, on one hand a relative decrease in samples' initial stiffness was observed due to increase in fraction of weak filler–filler interactions. On the other hand, as the concentration of ultra-high-strength filler was increased up to approximately 2 wt%, the mechanical strength records showed an almost twofold increase.
Conclusion
Co-solvent assisted dispersion of as-prepared reduced graphene oxide in poly(vinyl alcohol) aqueous solution at highest content of 2 wt%, with respect to dry mass, was successfully prepared followed by electrospinning of the PVA/rGO suspensions. Noticeable change in viscosity and rheological behavior extensional viscometry analysis of electrospinning suspensions was observed indicating the electrospinning jet formation improvement due to addition of co-solvent as dispersing/hydrogel forming agent. However, the addition of rGO in the media introduced more fluctuations to the process thus jet quality was decreased.The effect of rGO content on both the exterior textures and the interior morphology of as-spun fibers were investigated and it was shown that the amount of irregular morphology among fibrous structures was increased with respect to increase in rGO content. The mentioned phenomenon was proved to be the result of electrospinning process fluctuations, among which the rGO cluster formation in the electrospinning suspension found to be the key factor for formation of such structures. Focused ion milling study revealed that the interior morphology of the fibers was changed from a bulk structure to a hollow, cylindrical shape in the pristine and graphene containing samples, respectively. Such a noticeable improvement was found to be due to the formation of a viscosity profile within the electrospinning suspension as the high-viscosity, rGO-rich regions of suspension increased within the electrospinning jet.
A 100 °C increase in the final decomposition temperature of as-spun fibers was recorded for the 2 wt% graphene-content sample compared to the pristine one, showing that the thermal stability of fibers were improved by almost 20% as the concentration of thermally stable rGO increased to the ultimate value of 2 wt% with respect to dry product mass. The optimum properties in terms of mechanical stiffness and tensile strength of the freestanding fibrous thin layers were achieved at the moderate rGO concentration of 0.6 wt%. FT-IR and DSC analyses on the specimens subjected to tension, and via these methods it was shown that the crystallinity of polymer chains was not changed among samples with various graphene contents.
It was shown that the individual fiber alignment along with constructive addition of rGO were responsible factors for tensile strength and mechanical stiffness improvement of rGO-containing samples in comparison with the pristine as-spun mats among which, sample with 0.6 wt% graphene showed the optimal alignment of fibers which resulted in over 60% improvement in its Young's modulus property compared to neat PVA sample.
As a result of tunable superior thermal and mechanical properties, along with unique hollow structure of the electrospun fibrous mats, their application in production of high stiffness, and thermally stable nanocomposites is strongly acknowledged.
Acknowledgements
The research leading to these results have received funding from the European Union Seventh Framework Programme under grant agreement n 604391 Graphene Flagship and The Scientific and Technological Research Council of Turkey (TUBITAK) (Project No: 112M291) – COST Action MP1003.Notes and references
- (a) H. Xia, Y. Hashimoto and T. Hirai, Electric-Field-Induced Actuation of Poly(vinyl alcohol) Microfibers, J. Phys. Chem. C, 2012, 116(44), 23236–23242 CrossRef CAS; (b) W. Yuan, L. Huang, Q. Zhou and G. Shi, Ultrasensitive and Selective Nitrogen Dioxide Sensor Based on Self-Assembled Graphene/Polymer Composite Nanofibers, ACS Appl. Mater. Interfaces, 2014, 6(19), 17003–17008 CrossRef CAS PubMed; (c) S.-H. Hwang, D. Kang, R. S. Ruoff, H. S. Shin and Y.-B. Park, Poly(vinyl alcohol) Reinforced and Toughened with Poly(dopamine)-Treated Graphene Oxide, and Its Use for Humidity Sensing, ACS Nano, 2014, 8(7), 6739–6747 CrossRef CAS PubMed.
- H. Wang, B. Xia, Y. Yan, N. Li, J.-Y. Wang and X. Wang, Water-Soluble Polymer Exfoliated Graphene: As Catalyst Support and Sensor, J. Phys. Chem. B, 2013, 117(18), 5606–5613 CrossRef CAS PubMed.
- (a) J. Wang, X. Zhao, J. Li, X. Kuang, Y. Fan, G. Wei and Z. Su, Electrostatic Assembly of Peptide Nanofiber–Biomimetic Silver Nanowires onto Graphene for Electrochemical Sensors, ACS Macro Lett., 2014, 3(6), 529–533 CrossRef CAS; (b) N. Promphet, P. Rattanarat, R. Rangkupan, O. Chailapakul and N. Rodthongkum, An electrochemical sensor based on graphene/polyaniline/polystyrene nanoporous fibers modified electrode for simultaneous determination of lead and cadmium, Sens. Actuators, B, 2015, 207(Part A (0)), 526–534 CrossRef CAS PubMed; (c) S. Wu, Q. He, C. Tan, Y. Wang and H. Zhang, Graphene-Based Electrochemical Sensors, Small, 2013, 9(8), 1160–1172 CrossRef CAS PubMed.
- (a) T. Mosciatti, S. Haar, F. Liscio, A. Ciesielski, E. Orgiu and P. Samorì, A Multifunctional Polymer–Graphene Thin-Film Transistor with Tunable Transport Regimes, ACS Nano, 2015, 9(3), 2357–2367 CrossRef CAS PubMed; (b) S. Kim, P. Zhao, S. Aikawa, E. Einarsson, S. Chiashi and S. Maruyama, Highly Stable and Tunable n-Type Graphene Field-Effect Transistors with Poly(vinyl alcohol) Films, ACS Appl. Mater. Interfaces, 2015, 7(18), 9702–9708 CrossRef CAS PubMed.
- L. Zeng, T. S. Zhao, L. An, G. Zhao, X. H. Yan and C. Y. Jung, Graphene-supported platinum catalyst prepared with ionomer as surfactant for anion exchange membrane fuel cells, J. Power Sources, 2015, 275, 506–515 CrossRef CAS PubMed.
- (a) L. Kyhl, S. F. Nielsen, A. G. Cabo, A. Cassidy, J. A. Miwa and L. Hornekaer, Graphene as an anti-corrosion coating layer, Faraday Discuss., 2015, 180, 495–509 RSC; (b) Y. Liu, J. Zhang, S. Li, Y. Wang, Z. Han and L. Ren, Fabrication of a superhydrophobic graphene surface with excellent mechanical abrasion and corrosion resistance on an aluminum alloy substrate, RSC Adv., 2014, 4(85), 45389–45396 RSC.
- (a) X. Qian, L. Song, B. Yu, B. Wang, B. Yuan, Y. Shi, Y. Hu and R. K. K. Yuen, Novel organic–inorganic flame retardants containing exfoliated graphene: preparation and their performance on the flame retardancy of epoxy resins, J. Mater. Chem. A, 2013, 1(23), 6822–6830 RSC; (b) B. Yu, Y. Shi, B. Yuan, S. Qiu, W. Xing, W. Hu, L. Song, S. Lo and Y. Hu, Enhanced thermal and flame retardant properties of flame-retardant-wrapped graphene/epoxy resin nanocomposites, J. Mater. Chem. A, 2015, 3(15), 8034–8044 RSC.
- (a) G. Liu, W. Jin and N. Xu, Graphene-based membranes, Chem. Soc. Rev., 2015, 44(15), 5016–5030 RSC; (b) K. Nieszporek and M. Drach, Alkane separation using nanoporous graphene membranes, Phys. Chem. Chem. Phys., 2015, 17(2), 1018–1024 RSC.
- (a) S. Panzavolta, B. Bracci, C. Gualandi, M. L. Focarete, E. Treossi, K. Kouroupis-Agalou, K. Rubini, F. Bosia, L. Brely, N. M. Pugno, V. Palermo and A. Bigi, Structural reinforcement and failure analysis in composite nanofibers of graphene oxide and gelatin, Carbon, 2014, 78, 566–577 CrossRef CAS PubMed; (b) F. Barzegar, A. Bello, M. Fabiane, S. Khamlich, D. Momodu, F. Taghizadeh, J. Dangbegnon and N. Manyala, Preparation and characterization of poly(vinyl alcohol)/graphene nanofibers synthesized by electrospinning, J. Phys. Chem. Solids, 2015, 77, 139–145 CrossRef CAS PubMed.
- (a) D. C. Marcano, D. V. Kosynkin, J. M. Berlin, A. Sinitskii, Z. Sun, A. Slesarev, L. B. Alemany, W. Lu and J. M. Tour, Improved Synthesis of Graphene Oxide, ACS Nano, 2010, 4(8), 4806–4814 CrossRef CAS PubMed; (b) L. P. Biro, P. Nemes-Incze and P. Lambin, Graphene: nanoscale processing and recent applications, Nanoscale, 2012, 4(6), 1824–1839 RSC; (c) Y. Zhang, T. R. Nayak, H. Hong and W. Cai, Graphene: a versatile nanoplatform for biomedical applications, Nanoscale, 2012, 4(13), 3833–3842 RSC.
- (a) G. Anagnostopoulos, C. Androulidakis, E. N. Koukaras, G. Tsoukleri, I. Polyzos, J. Parthenios, K. Papagelis and C. Galiotis, Stress Transfer Mechanisms at the Submicron Level for Graphene/Polymer Systems, ACS Appl. Mater. Interfaces, 2015, 7(7), 4216–4223 CrossRef CAS PubMed; (b) S. Sahoo, S. Dhibar, G. Hatui, P. Bhattacharya and C. K. Das, Graphene/polypyrrole nanofiber nanocomposite as electrode material for electrochemical supercapacitor, Polymer, 2013, 54(3), 1033–1042 CrossRef CAS PubMed; (c) Y. Liu, X. Dong and P. Chen, Biological and chemical sensors based on graphene materials, Chem. Soc. Rev., 2012, 41(6), 2283–2307 RSC; (d) Y. Fan, J.-H. Liu, C.-P. Yang, M. Yu and P. Liu, Graphene–polyaniline composite film modified electrode for voltammetric determination of 4-aminophenol, Sens. Actuators, B, 2011, 157(2), 669–674 CrossRef CAS PubMed.
- K. Sawada, S. Sakai and M. Taya, Enhanced productivity of electrospun polyvinyl alcohol nanofibrous mats using aqueous N,N-dimethylformamide solution and their application to lipase-immobilizing membrane-shaped catalysts, J. Biosci. Bioeng., 2012, 114(2), 204–208 CrossRef CAS PubMed.
- K. J. Ramalingam, N. R. Dhineshbabu, S. R. Srither, B. Saravanakumar, R. Yuvakkumar and V. Rajendran, Electrical measurement of PVA/graphene nanofibers for transparent electrode applications, Synth. Met., 2014, 191, 113–119 CrossRef CAS PubMed.
- C. Surawut, S. Anuvat and S. Pitt, Mechanical and electro-rheological properties of electrospun poly(vinyl alcohol) nanofibre mats filled with carbon black nanoparticles, Nanotechnology, 2007, 18(14), 145705 CrossRef.
- (a) H. R. Darrell and C. Iksoo, Nanometre diameter fibres of polymer, produced by electrospinning, Nanotechnology, 1996, 7(3), 216 CrossRef; (b) N. M. Thoppey, R. E. Gorga, J. R. Bochinski and L. I. Clarke, Effect of Solution Parameters on Spontaneous Jet Formation and Throughput in Edge Electrospinning from a Fluid-Filled Bowl, Macromolecules, 2012, 45(16), 6527–6537 CrossRef CAS.
- (a) X. Xu, A. J. Uddin, K. Aoki, Y. Gotoh, T. Saito and M. Yumura, Fabrication of high strength PVA/SWCNT composite fibers by gel spinning, Carbon, 2010, 48(7), 1977–1984 CrossRef CAS PubMed; (b) S. Ramazani and M. Karimi, Electrospinning of poly(ε-caprolactone) solutions containing graphene oxide: effects of graphene oxide content and oxidation level, Polym. Compos., 2014 DOI:10.1002/pc.23163; (c) U. Stachewicz, F. Modaresifar, R. J. Bailey, T. Peijs and A. H. Barber, Manufacture of Void-Free Electrospun Polymer Nanofiber Composites with Optimized Mechanical Properties, ACS Appl. Mater. Interfaces, 2012, 4(5), 2577–2582 CrossRef CAS PubMed.
- K. Fujikura, S. Lin, J. Nakamura, A. Obata and T. Kasuga, Preparation of electrospun fiber mats using siloxane-containing vaterite and biodegradable polymer hybrids for bone regeneration, J. Biomed. Mater. Res., Part B, 2013, 101(8), 1350–1358 CrossRef PubMed.
- H. J. Salavagione, G. Martinez and M. A. Gomez, Synthesis of poly(vinyl alcohol)/reduced graphite oxide nanocomposites with improved thermal and electrical properties, J. Mater. Chem., 2009, 19(28), 5027–5032 RSC.
- Y. Tan, Y. Song and Q. Zheng, Hydrogen bonding-driven rheological modulation of chemically reduced graphene oxide/poly(vinyl alcohol) suspensions and its application in electrospinning, Nanoscale, 2012, 4(22), 6997–7005 RSC.
- S. J. Haward, V. Sharma, C. P. Butts, G. H. McKinley and S. S. Rahatekar, Shear and Extensional Rheology of Cellulose/Ionic Liquid Solutions, Biomacromolecules, 2012, 13(5), 1688–1699 CrossRef CAS PubMed.
- J. E. Kim and H. S. Lee, Oscillatory shear induced gelation of graphene–poly(vinyl alcohol) composite hydrogels and rheological premonitor of ultra-light aerogels, Polymer, 2014, 55(1), 287–294 CrossRef CAS PubMed.
- A. Moayeri and A. Ajji, Fabrication of polyaniline/poly(ethylene oxide)/non-covalently functionalized graphene nanofibers via electrospinning, Synth. Met., 2015, 200, 7–15 CrossRef CAS PubMed.
- G. H. Teo, Y. H. Ng, P. B. Zetterlund and S. C. Thickett, Factors influencing the preparation of hollow polymer–graphene oxide microcapsules via Pickering miniemulsion polymerization, Polymer, 2015, 63, 1–9 CrossRef CAS PubMed.
- A. J. Uddin, J. Araki and Y. Gotoh, Characterization of the poly(vinyl alcohol)/cellulose whisker gel spun fibers, Composites, Part A, 2011, 42(7), 741–747 CrossRef PubMed.
- (a) S. Sirohi, D. Singh, R. Nain, D. Parida, A. K. Agrawal and M. Jassal, Electrospun composite nanofibres of PVA loaded with nanoencapsulated n-octadecane, RSC Adv., 2015, 5(43), 34377–34382 RSC; (b) S. Virtanen, J. Vartianen, H. Setala, T. Tammelin and S. Vuoti, Modified nanofibrillated cellulose-polyvinyl alcohol films with improved mechanical performance, RSC Adv., 2014, 4(22), 11343–11350 RSC.
| This journal is © The Royal Society of Chemistry 2015 |