In situ incorporation of a S, N doped carbon/sulfur composite for lithium sulfur batteries

Zhigao Yanga, Yu Daia, Shengping Wang*a, Hong Chenga and Jingxian Yub
aFaculty of Materials Science and Chemistry, China University of Geosciences, Wuhan 430074, China. E-mail: spwang@cug.edu.cn
bARC Centre of Excellence for Nanoscale BioPhotonics (CNBP), School of Chemistry and Physics, The University of Adelaide, Adelaide, SA 5005, Australia

Received 1st August 2015 , Accepted 9th September 2015

First published on 10th September 2015


Abstract

A novel sulfur–nitrogen co-doped carbon material (SNC), which is obtained by taking polyaniline as the nitrogen-containing carbon precursor and then incorporating sulfur atoms in situ as the matrix material for lithium sulfur batteries, is investigated. XPS reveals the formation of strong chemical bonding (–C–S–C– and C–SOx–C (x = 2–4)) in the structure of SNC materials. Moreover, the results demonstrate that SNC–S composites showed higher specific capacity and better cycle performance than the pristine nitrogen co-doped carbon material (NC)/sulfur (NC–S) composites. Except for providing more lithium storage sites due to faradaic reactions, the incorporation of sulfur not only immobilizes the sulfur and polysulfide species, thus improving the interfacial characterization between the electrode and the electrolyte, but also influences the reversible dissolving balance of long-chain polysulfides and suppresses the “shuttle effect”, resulting in better electrochemical behavior. This facile approach of the SNC matrix could provide a practical research direction for lithium sulfur batteries.

Introduction

Sulfur is one of the most promising rechargeable cathode materials, with a high specific capacity of 1675 mA h g−1 and an inexpensive price.1–3 Lithium sulfur batteries, combined with elemental sulfur cathodes and metal lithium anodes, can provide a theoretical energy density of approximately 2600 W h kg−1, which far exceeds that of existing materials based on transition metal oxides and phosphates. Moreover, the cell voltage of lithium sulfur batteries of ∼2.2 V is relatively low and avoids safety concerns. Unfortunately, many challenges remain in developing a practical lithium–sulfur battery for commercialization.4–8 One of the issues is that the poor intrinsic conductivity of sulfur often leads to low electrochemical utilization and limited rate capability, which necessitates intimate contact with conductors (e.g., porous carbons) and decreases the whole theoretical specific energy. Another critical issue is associated with the dissolution of intermediate polysulfides Li2Sx (3 ≤ x ≤ 8) in ether-based electrolytes. The whole process is known as the “PS shuttle mechanism”, which leads to the reduction of coulombic efficiency and capacity decay upon cycling. Moreover, the large volumetric expansion (∼80%) upon lithiation is also a key test for the structure stability of the materials.

Over the years, extensive efforts have been devoted to addressing the above problems, but most of them focused on the development of the supporting matrix for sulfur, such as carbon-based materials, conductive polymers and metal oxides, working both as the reservoir to accommodate sulfur and the adsorbent to suppress the loss of polysulfide intermediates.9–17 Though with improved electrochemical performance, the interactions between sulfur and the supporting matrix are very weak due to the synthesis process, which occurs mostly in two approaches, thermal mixing and chemical reaction deposition, both of which only enable physical absorption, resulting in unsatisfied long-term stability and rate capability.

Recently, a successful approach to modifying the intrinsic properties of pure carbon was developed, which involved doping with heteroatoms, such as N and B, due to their diversity, robust chemistry, good conductivity and unique defect structure.18 For example, Sun et al. constructed a nitrogen-doped mesoporous carbon (NC)/S composite that can enhance activity toward sulfur reduction. Under a current density of 84 mA g−1, a battery based on the NC/S composite exhibited a higher discharge potential and an initial capacity of 1420 mA h g−1.19 Later, Sun and co-workers further provided unequivocal proof that nitrogen doping could assist mesoporous carbon in suppressing the shuttling phenomenon, possibly via an enhanced surface interaction between the basic nitrogen functionalities and polysulfide species.20 Song et al. prepared a mesoporous nitrogen-doped carbon (MPNC)–sulfur nanocomposite.21 Nitrogen doping in the MPNC material was found to promote the formation of bonds between sulfur atoms and oxygen functional groups on the carbon. The S–O chemical bonding was directly demonstrated by X-ray absorption near-edge structure spectroscopy (XANES), and the mechanism by which nitrogen enables the behavior was further revealed by DFT calculations.

Moreover, the sulfur-doped carbon materials also have unique features, such as promoting the redox reaction, possessing strong adsorption, improving electric conductivity and increasing the reversible capacity.22–25 Recently, the effects of sulfur doping on the electrochemical properties of GNS (graphene-based nanosheets) were studied for their use as an anode material in lithium-ion batteries.26 Sulfur doping in GNS contributes to a high specific capacity by providing more lithium storage sites due to faradaic reactions and improved electrical conductivity for the existence of a defect. Moreover, NanoS@graphene composites were prepared using the one-pot hydrothermal method, and XPS revealed strong bonding between sulfur and graphene; due to the strong bonding of immobilized sulfur and polysulfide species, higher utilization of sulfur and better capacity retention were obtained.27 Notably, for the reason that Li storage is determined not only by the number of heteroatoms but also by synergistic effects between dopants, artificial doping with two different heteroatoms is a more attractive option for LIB applications that takes advantage of the additionally created defect sites for Li storage.28,29

Therefore, in view of current existing problems related to the sulfur cathode, we try to utilize the two different heteroatoms doped carbon material, S, N co-doped carbon material, to improve the electrochemical performance of sulfur. In this paper, based on polyaniline as the precursor, nitrogen-doped carbon materials were obtained, and then sulfur atoms were in situ incorporated at high temperature. As a matrix, for the preparation of sulfur–nitrogen co-doped carbon materials (SNC)/sulfur composites (SNC–S), it is noted that the SNC–S composites could further improve the electrochemical performance of a sulfur electrode than single nitrogen doped carbon materials (NC)/sulfur composites (NC–S). In addition, the reaction mechanism between the two types of carbon materials and active materials is also discussed to provide a profound thought for subsequent practical research on lithium–sulfur batteries.

Experimental

Preparation of NC, SNC and the composites NC–S, SNC–S

Nitrogen-doped carbon material (NC) was obtained via carbonizing the precursor, polyaniline, which was synthesized according to a chemical oxidative polymerization method by using phytic acid as the doping acid.30 In detail, first, 0.9 ml of solution A, which contains 100 mM of aniline monomer and 30 mM of phytic acid, was added. Second, 0.3 ml of solution B, containing 125 mM of ammonium persulfate, was added into the above mixture and subjected to 1 min bath sonication. In approximately 2 min, the solution changed color from brown to dark green and released a lot of heat, then became viscous and gel-like, indicating in situ polymerization of the aniline monomer to form a PANi hydrogel. After washing with ethanol and deionized water until a neutral pH was reached, the dark green Polyaniline was collected and dried in an air-oven at 45 °C for 24 h. Next, polyaniline, as the carbon precursor, was transferred into a tube furnace and heat-treated at 700 °C for 10 h under a nitrogen atmosphere at a heating rate of 10 °C min−1 before being cooled to room temperature to afford the nitrogen-doped carbon materials (NC).

The sulfur–nitrogen co-doped carbon materials (SNC) were prepared as follows. The NC powder was mixed with elemental sulfur (3[thin space (1/6-em)]:[thin space (1/6-em)]1 w/w) under 155 °C for 3 h. Then, the mixtures were further heated at 700 °C for 5 h at a heating rate of 10 °C min−1, and then the SNC were obtained.

Finally, to prepare the NC–S (SNC–S) composite, a mixture of the NC (SNC) and elemental sulfur in a 1[thin space (1/6-em)]:[thin space (1/6-em)]3 mass ratio was heated at 155 °C for 8 h.

Materials characterization

The morphology of the composite materials was carried out with a SU8010 high-resolution field emission scanning electron microscope (SEM). X-ray diffraction (XRD) patterns of the S, NC, SNC, NC–S and SNC–S composite materials were tested on a D8-FOCUS powder diffraction system operating at 40 kV and 40 mA using Cu-Ka radiation. Raman spectra of the NC and SNC were measured by using a MK 1-1000 Spectra spectrometer. The X-ray photoelectron spectroscopy (XPS) analysis was performed on a VG Multilab 2000 spectrometer with Al-Ka radiation (1486.6 eV) as the X-ray source. The sulfur contents in the composites were calculated from the thermal gravimetric analysis (TGA) data, collected with a STA 449F Thermogravimetric Analyzer at a heating rate of 10 °C min−1 from 30 °C to 500 °C in a nitrogen atmosphere. The resistivity of S, NC, SNC, NC–S and SNC–S was measured with a Radiant/RT66B ferroelectric tester, respectively.

Electrochemical measurements

The cathodes containing the NC–S, SNC–S composites were prepared by mixing the active material (80 wt%) with acetylene black (10 wt%) and poly(vinylidene fluoride) (PVdF) binder (10 wt%), dispersing the mixture in N-methylpyrrolidone (NMP) to form a slurry, coating the slurry onto an aluminum foil by means of a doctor blade method, and evaporating the NMP at 60 °C in an air-flow oven for 5 h. Subsequently, the electrode film was cut into sheets measuring 15 mm in diameter and a weight of 3 mg. The film disk was dried in a vacuum oven at 60 °C for 24 h before assembling the testing cells.

Handmade Teflon cells were then assembled in a glove box filled with argon. Lithium metal was used as the counter electrode and the reference electrode, and a microporous polypropylene film (Celgard 2300) was used as a separator. The electrolyte consisted of 0.1 M anhydrous lithium nitrate and 1 M LiN(CF3SO2)2 in a mixed solvent of 1,3-dioxolane and dimethyl ether at a volume ratio of 1[thin space (1/6-em)]:[thin space (1/6-em)]1. The cells rested for 12 h before testing. Galvanostatic charge/discharge tests were then performed in a voltage range of 1.5 to 2.8 V with a BT-2000 Arbin Battery Testing System. Cyclic voltammetry (CV) experiments were conducted with a VMP3 electrochemical workstation at a scanning rate of 0.1 mV s−1 with a voltage range from 1.5 to 3.0 V. Electrochemical impedance spectroscopy (EIS) data were collected with the VMP3 electrochemical workstation over the frequency range from 10−2 to 105 Hz at potentiostatic signal amplitudes of 5 mV.

Results and discussion

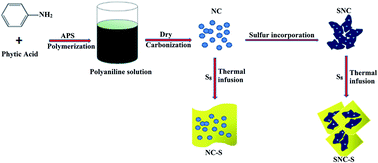
A schematic representation of the synthesis of NC–S and the SNC–S composite is shown in Fig. 1. The NC is prepared through the high temperature carbonization of PANi. In the chemical oxidative polymerization process, phytic acid molecules enter into the PANi chains as dopants. However, the SNC is in situ synthesized at high temperature after the NC is mixed with elemental sulfur.
image file: c5ra15360c-f1.tif
Fig. 1 Schematic representation of the synthetic route to a NC–S and SNC–S composite.

Fig. 2 shows the SEM images of the samples. As seen in Fig. 2a, the nitrogen-doped carbon material (NC), which was carbonized by polyaniline nanofiber at high temperature, turned into a homogeneous nonporous block material. Further sulfured at 700 °C, the morphology of the obtained SNC is greatly changed. The surface is smoother and looks like winding canyons. Moreover, there are many pores of uneven size that can be observed on the surface, probably resulting from the evaporation of the sulfur, which was heated at high temperature. Fig. 2c shows the white selected area of Fig. 2b after scanning, and the elemental mapping of carbon, nitrogen and sulfur was given in Fig. 2d–f. Rich carbon and sulfur and poor nitrogen is revealed on the surface of the sample, indicating that many nitrogen atoms formed into ammonia and were volatilized. The SEM images of the composite sample in Fig. 2g and h show that NC–S is in the form of a large and smooth bulk material, attributing to the nonporous feature of NC materials. Unlike the NC–S composites, SNC–S is flakey, resulting from the unique and bended morphology or the incorporation of sulfur into the framework of the NC materials.


image file: c5ra15360c-f2.tif
Fig. 2 SEM images of (a) NC and (b) SNC; (c) SEM image of SNC and the corresponding EDX elemental mappings of (d) carbon, (e) nitrogen and (f) sulfur; SEM images of (g) NC–S composite and (h) SNC–S composite.

XRD patterns of the as-prepared carbon materials and the corresponding composite are presented in Fig. 3. The NC samples exhibit a broad (002) diffraction peak at 26° and a weak (100) diffraction peak at approximately 43° in the hexagonal graphitic carbon structure.31,32 After sulfur incorporation, the characteristic peak of the graphite (100) diffraction peak vanished, indicating that the degree of graphitization of the SNC–S composite was decreased, which means that the defect structure of the SNC–S composite was increased and can afford more lithium storage sites upon cycles.23,33,34 Moreover, compared with the pattern of the raw elemental sulfur, the XRD spectrum of the NC–S and SNC–S did not exhibit many changes, indicating that no phase transformation occurred during heat treatment and the crystal structure of sulfur still remains an Fddd orthorhombic structure. The resistivity of S, NC, SNC, NC–S and SNC–S is 1.1 × 1028, 3.17 × 10², 2.88 × 10², 8.24 × 10⁸ and 6.77 × 10⁸ Ω cm, respectively.


image file: c5ra15360c-f3.tif
Fig. 3 The XRD patterns of sublimed S, NC, SNC, and the corresponding composites NC–S and SNC–S.

Information about the structure of NC and SNC was further verified by analysis of the Raman spectra, as shown in Fig. 4. The D band centered at 1350 cm−1 indicates the disordered arrangement of the sixfold aromatic carbon ring, and the G band centered at 1580 cm−1 represents the sp2-bonded carbon atoms of graphite layers.35,36 In general, the intensity ratio of the D and G peaks (ID/IG) reflects the degree of distortion of a graphitic lattice. Compared with NC (0.93), the ID/IG of SNC is increased to 1.01 due to the unrepaired defects after the sulfur incorporation for further treatment. The existence of the defects is good for lithium storage, which is consistent with the XRD results.23,31 In addition, there are no sharp peaks below 600 cm−1 that can be assigned to the S–S bond in composites, which verified the S incorporation into the graphene lattice by the formation of C–S covalent bonds and moderate restoration of sp2 bonding during thermal treatment.37


image file: c5ra15360c-f4.tif
Fig. 4 Raman spectra of the NC and SNC.

To confirm the chemical composition and surface properties of the NC and SNC materials, XPS measurements were performed, and the results are exhibited in Fig. 5. The survey spectra in Fig. 5a prove the existence of N1s peaks in NC and co-existence of N1s and S2p peaks in SNC composites, indicating the successful nitrogen doping into NC and then incorporation of sulfur into SNC. The peaks centered at approximately 285.0 eV and 530.0 eV in all survey spectra correspond to the C1s and O1s, respectively. The high resolution N1s peaks (Fig. 5b and c) can be divided into four components, including pyridinic-N (398.2 eV), pyrrolic-N (399.9 eV), graphitic-N (400.7 eV) and pyridine-N-oxide (402.0 eV).38 However, after sulfured treatment at high temperature, for SNC, the ratio of the pyrrolic-N to the overall nitrogen is obviously higher than NC, and the ratio of the graphitic-N to the overall nitrogen is obviously lower, which is in agreement with the results of XRD and Raman. The percentage of nitrogen doping and distribution of nitrogen species in NC and SNC are also given in Table 1. The sulfur configuration and chemical composition of SNC were elucidated in Fig. 5d. The asymmetric S2p peak of SNC was fitted to three peaks at binding energies of 163.7 eV, 164.8 eV and 168.1 eV, respectively. The two major peaks corresponded to S2p3/2 and S2p1/2 of the C–S–C covalent bond of the thiophene-S arising from spin–orbit coupling. The minor and broad peaks at 168.1 eV were assigned to the oxidized sulfur form of the C–SOx–C (x = 2–4) bond.34,39,40 Note that the main sulfur atoms were incorporated into NC in the form of the C–S–C covalent bond of thiophene-S, meaning that the electrochemical performance of the active material was mainly influenced by the C–S–C covalent bond in the framework of SNC. Fig. 5e and f illustrate the C1s XPS spectra of the NC and SNC materials, respectively. For the NC materials, the C1s spectrum is deconvoluted into four peaks at 284.4, 285.3288.0 and 289.2 eV corresponding to C–C, C–N, C[double bond, length as m-dash]O and O–C[double bond, length as m-dash]O, respectively. For the SNC materials, additional peaks at 286.5 eV associated with C–S, are observed, confirming that C–S covalent bond is formed by in situ incorporation of elemental sulfur.41,42 In a word, the difference in the distribution of nitrogen and sulfur bonding configurations may finally influence the electrochemical properties of the NC–S and SNC–S composites.


image file: c5ra15360c-f5.tif
Fig. 5 (a) The XPS survey spectra of the NC and SNC; high-resolution XPS spectra of N1s in (b) NC and (c) SNC; (d) high-resolution XPS spectra of S2p in SNC; high-resolution XPS spectra of C1s in (e) NC and (f) SNC.
Table 1 XPS fitting parameters
    NC peak position FWHM Area% Peak position SNC FWHM Area%
C1s O–C[double bond, length as m-dash]O 289.0 2.4 5.4% 289.1 2.4 7.1%
C–O 288.0 2.5 5.3% 288.0 1.5 2.9%
C–S 286.5 286.5 1.3 23.1%
C–N 285.4 2.6 30.1% 285.1 1.2 20.0%
C–C 284.6 1.6 59.1% 284.3 1.5 47.5%
N1s Oxidized-N 402.0 1 5.9% 402.5 1.2 5.0%
Graphitic-N 400.7 1.4 29.6% 400.8 1.4 23.5%
Pyrrolic-N 399.9 1.4 25.9% 399.9 2.5 54.6%
Pyridinic-N 398.2 2.1 38.5% 398.0 1.4 16.8%
S2p Oxidized-S 168.1 168.1 2.3 14.6%
Thiophene S1/2 164.8 164.8 1.8 46.3%
Thiophene S3/2 163.7 163.7 1.4 39.0%


TGA was measured to determine the sulfur contents of the composites in a nitrogen atmosphere, as shown in Fig. 6. The pristine sulfur sample shows that the process occurred in one-step, with weight loss starting at approximately 150 °C and ending with all weight lost at 315 °C. In contrast, the two composites exhibited total weight loss until 330 °C; the delay means that there is some physical adsorption between the carbon materials and elemental sulfur, causing the weight loss of sulfur to be more difficult with increasing temperature. The actual sulfur contents in the composites, as determined from the TGA data, are 71.25 wt% and 73.21 wt%, respectively.


image file: c5ra15360c-f6.tif
Fig. 6 TGA curves of the NC–S and SNC–S composites in a nitrogen atmosphere.

Stimulated cells with a lithium foil anode and either an NC–S or SNC–S cathode were assembled to evaluate the electrochemical performance of the composites. Fig. 7a and b show the CV profiles of the NC–S and SNC–S electrode between 1.5 and 3 V vs. Li+/Li for the initial three cycles and the 7th cycle at a scan rate of 0.1 mV s−1. Typically, it was obviously found from the CV curves that there were two cathodic peak potentials at ∼2.3 V and ∼2.0 V for the NC–S composite due to the two-step reduction of sulfur in the presence of Li ions, assigning the reduction of element sulfur (S8) to soluble lithium polysulfides (Li2Sn, 4 ≤ n ≤ 8) and further conversion of these lithium polysulfides to insoluble Li2S2 and Li2S, respectively. In the subsequent anodic scan, the only anodic peak at ∼2.4 V corresponds to the transformation of Li2S2 and Li2S to Li2S8.43,44 After several cycles, it was also found that the anodic peak current density of the NC–S composite decreased quickly due to the dissolution of lithium polysulfides (Li2Sn, 4 ≤ n ≤ 8), which could not oxidize to Li2S8 completely. Moreover, the reduction and oxidation peak areas are also decreased, demonstrating the decline of the material capacity.


image file: c5ra15360c-f7.tif
Fig. 7 Cycle voltammetry plots of the (a) NC–S and (b) SNC–S electrode at a scan rate of 0.1 mV s−1 for the initial three and 7th cycles; charge–discharge profiles of (c) NC–S and (d) SNC–S electrodes at 0.2 mA cm−2.

In contrast, some different observations can be seen in Fig. 7b. In the first cycle, two cathodic peaks are identified: one is located at ∼2.25 V, corresponding to the reduction of elemental sulfur to polysulfide as the same way as NC–S composites; the other is a broad peak between ∼2.0 V and ∼1.75 V, probably attributed to the sulfur atoms in the SNC, which may have immobilized the polysulfide species. The interaction may slow down the transformation of long-chain lithium polysulfides into insoluble Li2S2 and Li2S. In the anodic scan, the sharp redox peaks show stable overlapping features for the same reason that the interaction between the SNC and polysulfides gives rise to the relatively slow conversion of long-chain polysulfides to Li2S8. In the second cycle, the first cathodic peaks are shifted to a higher voltage (∼2.3 V). This is because the electrochemical reactions during the first discharge process need to overcome the strong absorbing energy between the sulfur and the conductive matrix.45 The second broad peak still occurred at approximately ∼2.0 V, implying that the interaction between the SNC and polysulfides still existed. Meanwhile, the voltage, peak current density and peak areas of the cathodic and anodic peaks for the composite remain constant after the 2nd cycle, showing the stable performance of the composite. As a result, sulfur incorporation into the SNC had a consistent effect on the intermediate products, i.e., soluble polysulfides, which ensured the reduction of active materials and suppressed the shuttle phenomenon; this could increase discharge capacity retention.

Fig. 7c and d display the charge–discharge curves of, respectively, the NC–S and SNC–S cathodes during the first 3 cycles at 0.2 mA cm−2. From Fig. 7c regarding the NC–S composite electrode, it can be obviously observed that the two discharge potential plateaus are consistent with the two cathodic peaks in the CV curves. Notably, on the charge curve, a voltage plateau at approximately 2.3 V corresponds to the oxidization process, which shows a small change during cycling. The voltage peak can be attributed to the oxidation of Li2S and Li2S2 to soluble polysulfides, which would keep dissolution equilibrium in the electrolyte. The phenomenon is very common and was already reported elsewhere.46 In the following second and third cycles, the upper discharge potential plateau was shifted to ∼2.4 V and the length was decreased, i.e., the discharge capacity from the first process shrank, meaning that the only physical adsorption between the NC and active materials still inevitably lead to the loss of active materials and severe discharge capacity decrease.

Interestingly, the charge–discharge profiles of the SNC–S composite electrode show something different. From an overall perspective, the profiles are consistent with the CV plots, even though two discharge plateaus and two closely spaced charge plateaus are still exhibited. However, at the beginning of the initial discharge curve, the discharge voltage drops a little and then rises to ∼2.3 V; it is likely that the existence of sulfur atoms in the SNC materials (mainly in the form of –C–S–C) causes a chemical immobilization with the polysulfide species, thereby influencing the dissolution equilibrium in the electrolyte. Moreover, the length of the upper discharge plateaus becomes shorter, also demonstrating that the incorporation of sulfur atoms is beneficial for chemical stabilization with the polysulfide species, leading to minimizing the loss of active materials. As the electrochemical reaction proceeded, the polysulfide species still changed into the final products. In addition, in the following charge state, the voltage moves up to ∼2.35 V first and then soon falls back down to ∼2.2 V. After a while, there was another rise of the voltage to ∼2.25 V, and then it moved down to ∼2.2 V. This strange and funny phenomenon means that except for the concentration of soluble polysulfides, the interaction between the SNC and soluble polysulfides also could influence the dissolution equilibrium in the electrolyte. In other words, the existence of sulfur in the SNC materials (mainly in the form of –C–S–C) played a significant role in immobilizing the polysulfide species. These results coincide with the CV curves. In the successive second and third cycles, the upper discharge potential plateau was shifted to ∼2.4 V and the length was not decreased, indicating that the main reason for discharge capacity decay comes from the transformation of the long chain polysulfides to short chain polysulfides. The above observations imply that the sulfur atoms anchored onto carbon materials could be compromised to a certain extent during long cycling.

The cycling performances of the NC–S and SNC–S composite cathodes were shown in Fig. 8. The capacity is calculated based on the mass of sulfur. The mass of sulfur in NC–S is 1.7 mg and that in SNC–S is 1.8 mg, respectively. Without the sulfur incorporation, the NC–S delivers a considerable discharge capacity of 1053 mA h g−1 (0.2 mA cm−2) and 956 mA h g−1 (1 mA cm−2) for the first cycle, which then rapidly decreases to 440 mA h g−1 (0.2 mA cm−2) and 322 mA h g−1 (1 mA cm−2) after 100 cycles. In contrast, the SNC–S exhibits a slightly higher initial capacity of 1081 mA h g−1 (0.2 mA cm−2) and 985 mA h g−1 (1 mA cm−2). After 100 cycles, the SNC–S cathode maintains a specific capacity of 552 mA h g−1 (0.2 mA cm−2) and 455 mA h g−1 (1 mA cm−2), with a corresponding columbic efficiency with 0.2 mA cm−2 close to 100%. Therefore, the sulfur incorporation effectively improves the cycling stability of the NC–S composite cathode. Similarly, the results also confirmed that SNC (mainly the existence of –C–S–C) has an effect on the intermediate products, thereby influencing the reversible dissolving balance of long-chain polysulfides and minimizing the shuttle phenomenon. Such a chemical bond is beneficial for better capacity retention and higher columbic efficiency.


image file: c5ra15360c-f8.tif
Fig. 8 Cycle performance of the NC–S and SNC–S electrodes.

To further understand the effect of sulfur incorporation in NC for the improved rate performance of the SNC–S composites, EIS measurements of the NC–S and SNC–S fresh electrodes were carried out and collected in Fig. 9. It can be seen that the impedance plots for all of the open-circuit potential states were composed of a depressed semicircle in the high-frequency domain and a sloping, straight line in the low-frequency region. The semicircle in the high-frequency domain corresponds to the charge-transfer process, and the straight line in the low-frequency domain corresponds to a semi-infinite Warburg diffusion process.47


image file: c5ra15360c-f9.tif
Fig. 9 EIS spectra of NC–S and SNC–S fresh electrodes at open-circuit potential.

The equivalent circuits are also shown in Fig. 9. Re refers to the resistance of the electrolyte on the surfaces of the electrode, Rs refers to the surface film resistance, Rct refers to the charge transfer resistance between the interfaces of the electrode/electrolyte, ZW refers to the Warburg impedance, and Q refers to the constant phase element.48 A lower charge transfer resistance is more conducive to electrochemical reaction kinetics. Apparently, the SNC–S composite electrode exhibited a much lower charge transfer resistance (123.6 Ω) than that of the NC–S (151.2 Ω), which could be attributed to the enhanced conductivity of the SNC–S composite due to the formation of –C–S–C– and C–SOx–C (x = 2–4) covalent bonds in the SNC–S composite, which further improved the interfacial characterization between the electrode and electrolyte. Thus, the incorporation of sulfur in SNC–S will increase the effectiveness of surface absorption to the polysulfide species and subsequently improve the overall electrochemical performance of the SNC–S composite (Table 2).

Table 2 EIS fitting parameters
Sample Re Rs Rct
NC–S 2.165 82.61 151.2
SNC–S 1.07 29.76 123.6


Conclusions

In summary, we synthesized a sulfur-incorporated, nitrogen-doped carbon material composite in situ via high temperature heat treatment using polyaniline as a precursor. Compared with the pristine nitrogen-doped carbon material composite, the SNC–S composite demonstrates significant enhancement of the electrochemical properties of the cathode in Li–S batteries. The remarkable enhancement in the cycling performance of the SNC–S cathodes may be ascribed to the following aspects. First, XPS revealed the formation of strong chemical bonding (–C–S–C– and C–SOx–C (x = 2–4)) in the structure of SNC materials. The strong adherence of the sulfur atoms on carbon materials, which was induced by the heat treatment, immobilized the sulfur and polysulfide species, influenced the reversible dissolving balance of long-chain polysulfides and suppressed the “shuttle effect”, resulting in higher utilization of sulfur, higher coulombic efficiency and better capacity retention. Second, EIS also suggested that the strong bonding improved the interfacial characterization between the electrode and electrolyte, enabled rapid electronic/ionic transport and improved electrochemical kinetics; therefore, a good rate capability was obtained. These results demonstrated that the SNC–S composite was a very promising candidate for high-performance Li–S batteries. We hope that this facile approach of the SNC matrix will provide a practical research direction for lithium sulfur batteries.

Acknowledgements

This work was supported by the National Natural Science Foundation of China (21173198) and the Science and Technology Support Program of Hubei Province, China (2015BCA301).

Notes and references

  1. Z. Li, Y. Huang, L. Yuan, Z. Hao and Y. Huang, Carbon, 2015, 92, 41–63 CrossRef CAS PubMed.
  2. A. Manthiram, Y. Fu, S.-H. Chung, C. Zu and Y.-S. Su, Chem. Rev., 2014, 114, 11751–11787 CrossRef CAS PubMed.
  3. J. Liu, W. Li, L. Duan, X. Li, L. Ji, Z. Geng, K. Huang, L. Lu, L. Zhou, Z. Liu, W. Chen, L. Liu, S. Feng and Y. Zhang, Nano Lett., 2015, 15, 5137–5142 CrossRef CAS PubMed.
  4. S.-H. Chung, R. Singhal, V. Kalra and A. Manthiram, J. Phys. Chem. Lett., 2015, 6, 2163–2169 CrossRef CAS PubMed.
  5. J.-J. Chen, R.-M. Yuan, J.-M. Feng, Q. Zhang, J.-X. Huang, G. Fu, M.-S. Zheng, B. Ren and Q.-F. Dong, Chem. Mater., 2015, 27, 2048–2055 CrossRef CAS.
  6. A. Schneider, C. Weidmann, C. Suchomski, H. Sommer, J. Janek and T. Brezesinski, Chem. Mater., 2015, 27, 1674–1683 CrossRef CAS.
  7. J. Balach, T. Jaumann, M. Klose, S. Oswald, J. Eckert and L. Giebeler, J. Phys. Chem. C, 2015, 119, 4580–4587 CAS.
  8. Y.-S. Su and A. Manthiram, Chem. Commun., 2012, 48, 8817–8819 RSC.
  9. S. Niu, W. Lv, C. Zhang, Y. Shi, J. Zhao, B. Li, Q.-H. Yang and F. Kang, J. Power Sources, 2015, 295, 182–189 CrossRef CAS PubMed.
  10. S. Xiao, S. Liu, J. Zhang and Y. Wang, J. Power Sources, 2015, 293, 119–126 CrossRef CAS PubMed.
  11. G. Zhou, E. Paek, G. S. Hwang and A. Manthiram, Nat. Commun., 2015, 6, 7760 CrossRef CAS PubMed.
  12. Y. Cui and Y. Fu, J. Power Sources, 2015, 286, 557–560 CrossRef CAS PubMed.
  13. Y.-X. Yin, S. Xin, Y.-G. Guo and L.-J. Wan, Angew. Chem., Int. Ed., 2013, 52, 13186–13200 CrossRef CAS PubMed.
  14. J. Song, M. L. Gordin, T. Xu, S. Chen, Z. Yu, H. Sohn, J. Lu, Y. Ren, Y. Duan and D. Wang, Angew. Chem., Int. Ed., 2015, 54, 4325–4329 CrossRef CAS PubMed.
  15. A. Rosenman, E. Markevich, G. Salitra, D. Aurbach, A. Garsuch and F. F. Chesneau, Adv. Energy Mater., 2015 DOI:10.1002/aenm.201500212.
  16. S. Wang, Z. Zhao, H. Xu, Y. Deng, Z. Li and G. Chen, Electrochim. Acta, 2015, 173, 282–289 CrossRef CAS PubMed.
  17. Y. Zhao, Z. Bakenova, Y. Zhang, H. Peng, H. Xie and Z. Bakenov, Ionics, 2015, 21, 1925–1930 CrossRef CAS.
  18. J. P. Paraknowitsch and A. Thomas, Energy Environ. Sci., 2013, 6, 2839 CAS.
  19. X.-G. Sun, X. Wang, R. T. Mayes and S. Dai, ChemSusChem, 2012, 5, 2079–2085 CrossRef CAS PubMed.
  20. F. Sun, J. Wang, H. Chen, W. Li, W. Qiao, D. Long and L. Ling, ACS Appl. Mater. Interfaces, 2013, 5, 5630–5638 CAS.
  21. J. Song, T. Xu, M. L. Gordin, P. Zhu, D. Lv, Y.-B. Jiang, Y. Chen, Y. Duan and D. Wang, Adv. Funct. Mater., 2013, 24, 1243 CrossRef PubMed.
  22. W. Kiciński, M. Szala and M. Bystrzejewski, Carbon, 2014, 68, 1–32 CrossRef PubMed.
  23. G. Ning, X. Ma, X. Zhu, Y. Cao, Y. Sun, C. Qi, Z. Fan, Y. Li, X. Zhang, X. Lan and J. Gao, ACS Appl. Mater. Interfaces, 2014, 6, 15950–15958 CAS.
  24. Y. Xia, Y. Zhu and Y. Tang, Carbon, 2012, 50, 5543–5553 CrossRef CAS PubMed.
  25. H. Seema, K. C. Kemp, N. H. Le, S.-W. Park, V. Chandra, J. W. Lee and K. S. Kim, Carbon, 2014, 66, 320–326 CrossRef CAS PubMed.
  26. Y. Kim, J.-H. Lee, S. Cho, Y. Kwon, I. In, J. Lee, N.-H. You, E. Reichmanis, H. Ko, K.-T. Lee, H.-K. Kwon, D.-H. Ko, H. Yang and B. Park, ACS Nano, 2014, 8, 6701–6712 CrossRef CAS PubMed.
  27. J. Zhang, Z. Dong, X. Wang, X. Zhao, J. Tu, Q. Su and G. Du, J. Power Sources, 2014, 270, 1–8 CrossRef CAS PubMed.
  28. D. Sun, J. Yang and X. Yan, Chem. Commun., 2015, 51, 2134–2137 RSC.
  29. W. Ai, Z. Luo, J. Jiang, J. Zhu, Z. Du, Z. Fan, L. Xie, H. Zhang, W. Huang and T. Yu, Adv. Mater., 2014, 26, 6186–6192 CrossRef CAS PubMed.
  30. H. Wu, G. Yu, L. Pan, N. Liu, M. T. McDowell, Z. Bao and Y. Cui, Nat. Commun., 2013, 4, 1943 Search PubMed.
  31. Y. Li, R. Mi, S. Li, X. Liu, W. Ren, H. Liu, J. Mei and W.-M. Lau, Int. J. Hydrogen Energy, 2014, 39, 16073–16080 CrossRef CAS PubMed.
  32. L. Zhou, X. Lin, T. Huang and A. Yu, Electrochim. Acta, 2014, 116, 210–216 CrossRef CAS PubMed.
  33. W. H. Shin, H. M. Jeong, B. G. Kim, J. K. Kang and J. W. Choi, Nano Lett., 2012, 12, 2283–2288 CrossRef CAS PubMed.
  34. X. Ma, G. Ning, Y. Sun, Y. Pu and J. Gao, Carbon, 2014, 79, 310–320 CrossRef CAS PubMed.
  35. Z. Liu, J. Tang, C. Kang, C. Zou, W. Yan and P. Xu, Solid State Commun., 2012, 152, 960–963 CrossRef CAS PubMed.
  36. X. Wang, Z. Zhang, Y. Qu, Y. Lai and J. Li, J. Power Sources, 2014, 256, 361–368 CrossRef CAS PubMed.
  37. J. Guo, Y. Xu and C. Wang, Nano Lett., 2011, 11, 4288–4294 CrossRef CAS PubMed.
  38. G. Xu, B. Ding, P. Nie, L. Shen, J. Wang and X. Zhang, Chemistry, 2013, 19, 12306–12312 CrossRef CAS PubMed.
  39. X. Yu and H. S. Park, Carbon, 2014, 77, 59–65 CrossRef CAS PubMed.
  40. W. Li, D. Yang, H. Chen, Y. Gao and H. Li, Electrochim. Acta, 2015, 165, 191–197 CrossRef CAS PubMed.
  41. D. Zhang, L. Zheng, Y. Ma, L. Lei, Q. Li, Y. Li, H. Luo, H. Feng and Y. Hao, ACS Appl. Mater. Interfaces, 2014, 6, 2657–2665 CAS.
  42. D. Zhang, Y. Hao, L. Zheng, Y. Ma, H. Feng and H. Luo, J. Mater. Chem. A, 2013, 1, 7584 CAS.
  43. X. Ji and L. F. Nazar, J. Mater. Chem., 2010, 20, 9821 RSC.
  44. L. Qiu, S. Zhang, L. Zhang, M. Sun and W. Wang, Electrochim. Acta, 2010, 55, 4632–4636 CrossRef CAS PubMed.
  45. X. Liang, Z. Wen, Y. Liu, H. Zhang, J. Jin, M. Wu and X. Wu, J. Power Sources, 2012, 206, 409–413 CrossRef CAS PubMed.
  46. C. Wang, W. Wan, J. T. Chen, H. Zhou, X. Zhang, L. X. Yuan and Y. Huang, J. Mater. Chem. A, 2013, 1, 1716–1723 CAS.
  47. S. R. Narayanan, D. H. Shen, S. Surampudi, A. I. Altia and G. Halpert, J. Electrochem. Soc., 1993, 140, 1854–1861 CrossRef CAS PubMed.
  48. Y. Sun, S. Wang, H. Cheng, Y. Dai, J. Yu and J. Wu, Electrochim. Acta, 2015, 158, 143–151 CrossRef CAS PubMed.

This journal is © The Royal Society of Chemistry 2015
Click here to see how this site uses Cookies. View our privacy policy here.