DOI:
10.1039/C5RA15002G
(Paper)
RSC Adv., 2015,
5, 99084-99094
Synthesis, evaluation and thermodynamics of a 1H-benzo-imidazole phenanthroline derivative as a novel inhibitor for mild steel against acidic corrosion†
Received
28th July 2015
, Accepted 10th November 2015
First published on 12th November 2015
Abstract
A novel 1H-benzo-imidazole phenanthroline derivative (1) was developed as a corrosion inhibitor for mild steel in 1.0 M HCl solution with temperature ranging from 25 °C to 90 °C. Potentiodynamic polarization, electrochemical impedance spectroscopy and weight loss indicates that inhibitor 1 can efficiently protect mild steel from corrosion in acidic medium with better performance under moderately higher concentration and temperature. Based on thermodynamic and kinetic analysis, it is observed that 1 functioned as a mixed-type inhibitor and obeyed Langmuir adsorption isotherm via chemisorption. Further assisted by synergistic effect of iodide ions, inhibition efficiency can be dramatically enhanced up to 99.2%.
1 Introduction
Acidic technology widely used in acid picking and oil-well acidizing results in serious corrosion, becoming a major concern in the oil and gas industry.1 The injection of organic inhibitors into the aggressive medium has been proven to be an effective and practical way to reduce the corrosion process on metal.2–5 In particular, organic compounds with suitable structures bearing functional polar electron-donating heteroatoms such as P, S, N or O can serve as efficient corrosion inhibitors.6–11 Some organic derivatives, e.g., indoles,12 pyridine,13,14 triazoles,15,16 schiff base17,18 as well as quaternary ammonium salts19 usually offer satisfactory protection to steel in acidic solution, due to both the polar heteroatoms and unlocalized conjugated electrons chemically bind on a metal surface via formation of π and back π bonds. In these ways, corrosion inhibitors extend on the metal surface and form a protective film, acting as a physical barrier to restrict the electrochemical reactions and inhibit further dissolution of metal.20 Inhibitor selection is very important for the application and it depends on what kind of metal or alloy and corrosive environment are used.21 During the past several decades, although efforts have been made in systematic observation of corrosion inhibitors, more attention needs to be paid to the development and investigation of corrosion inhibitors with new active functional groups.
In corrosion medium, synergistic effect of halides to improve the inhibitive action of the inhibitors has been investigated.22–25 Halides have attracted much attention for research not only because of their notably positive effects, but also for their low cost and environmentally friendly properties. It is usually considered that halides ions with negative charge tend to adsorb on metal surface and form an electrostatic field (oriented dipoles), fascinating the adsorption process of protonated inhibitors cation.26 These results highlight the important features of the additives, which can synergistically increase surface coverage through ion-pair interactions between the organic cations and the anions.
In this study, we reported a novel 1H-benzo-imidazole derivative (1), which bears several multiple adsorption centres and was characterized by IR and 1H-NMR. The compound has similar structure to the inhibitors reported by Obot et al., but was first time developed as corrosion inhibitor for mild steel in HCl solution.27–29 Systematic studies indicate 1 acts as an efficient inhibition to protect steel from corrosion, especially in the presence of iodide ions. Since 1H-benzo-imidazole provides a scaffold, it is possible to introduce more functional groups to achieve better design for corrosion inhibitors in acid media.
2 Experimental
2.1 Material preparation
The chemical composition of the mild steel used in this study was (wt%): 0.24% C, 0.26% Si, 1.44% Mn, 0.82% Cr, 0.10% Mo, 0.014% Ni, 0.007% V, 0.014% Ti, 0.02% Cu, 0.018% P, 0.004% S, and balance Fe. For electrochemical experiments, the working electrodes were round rods with typical dimension of Ø 10 × 5 mm. The rods were connected to copper wires and embedded in two-component epoxy resin, ground with up to 1500 grit SiC papers, rinsed with double-distilled water, then degreased in ethanol, and finally dried with a stream of cold air. For weight loss test, steel coupons were cut into rectangular pieces with dimension of 30 × 15 × 2.5 mm sheets, ground with up to 1000 grit SiC papers, then cleaned using the same methods stated as above.
2.2 Synthesis
2.2.1 Materials and instrumentation. All reactions and operations were carried out under a dry N2 atmosphere with standard Schlenk techniques. All solvents were used directly without further dryness and distillation. The synthesis and structure of inhibitor 1 is exhibited in Scheme 1. The synthesis of 1,10-phenanthroline-5,6-dione and 1H-benzo-imidazole were prepared by following general procedures known from the literature.30 1,10-Phenanthroline, cinnamic aldehyde, were purchased from Aldrich or Aladdin and used as received. 1H-NMR spectra were run on a Bruker-400 spectrometer with tetramethylsilane (1H) as an internal standard. Infrared spectra (IR) were recorded on a Nicolet NEXUS 670 FTIR spectrophotometer. Mass spectra were recorded with Trio-2000 GC-MS spectrometers.
 |
| Scheme 1 The synthesis and structure of investigated inhibitor. | |
2.2.2 Synthesis of 1,10-phenanthroline-5,6-dione (2). A flask containing 4.6 g (0.025 mol) 1,10-phenanthroline and 5.0 g (0.042 mol) of potassium bromide was placed in an ice bath. 75 ml cooled mixture of concentrated sulphuric acid and nitric acid (v/v = 2
:
1) was dropwise added carefully. The medium was refluxed for 3 h. After cooling to room temperature, 500 g ice was poured into. The pH of the system was adjusted to be neutral with potassium hydroxide. Filtration to remove solid, the filtrate was extracted with chloroform, then dried with Na2SO4. The solvent was evaporated to give the yellow crude product, which was recrystallized from toluene to afford acicular crystal with yield of 67%. MS: m/z = 210 (M+). Attention: installation of poison gas absorption is necessary due to the emission of Br2 during the reaction.
2.2.3 Synthesis of 2-styryl-1H-imidazo[4,5-f][1,10]phenanthroline (1). N2 stream was bubbled in a 25 ml ethanol solution containing 2 (1.05 g, 10 mmol), cinnamaldehyde (1.32 g, 10 mmol) and dry acetamide, and the medium was refluxed for 8 h. 10 ml H2O was poured into after the resulting solution was cooled down to room temperature, then organic phase was extracted with chloroform for three times. The mixture was concentrated in vacuo, and the crude product was purified by neutral alumina column chromatography with the mixture of CH2Cl2/CHCl3 as eluent to give complex 1 as dark brown solid, yield 70%. IR, νmax (KBr, cm−1): 3400–3200, 3100, 2996, 2926, 2855, 1720, 1689, 1588, 1563, 1505, 1466, 1419, 1377, 1251, 1095, 1022, 871, 803, 740; 1H-NMR (DMSO, 400 MHz) δ: 13.75 (s, 1H), 9.03 (dd, J = 2 and 2 Hz, 2H), 8.88–8.81 (m, 2H), 7.94–7.81 (m, 3H), 7.75 (t, J = 4 and 4 Hz, 2H), 7.47 (t, J = 4 and 4 Hz, 2H), 7.40 (t = 5 and 4 Hz, 2H).
2.3 Electrochemical measurements
Electrochemical experiments were carried out on a CS370 electrochemical workstation. The experiment temperatures were 25, 50, 70 and 90 °C and the concentrations of inhibitor were 0, 0.01, 0.05, 0.1, 0.5 and 1.0 mM, respectively. The working electrode (WE) was inserted into a glass cell with 500 ml 1.0 M HCl aqueous solution. Two graphite electrodes and a saturated calomel electrode (SCE) were used as the counter electrode (CE) and reference electrode (RE), respectively. In order to eliminate the unstable performance of SCE that may existed at 70 °C and 90 °C, we used a long luggin capillary with a cooling system for SCE. The cooling system was made of thick twining cotton (soaked with ethanol) around the luggin capillary, and ethanol was added to keep the cooling effect during the electrochemical measurements.
Before all experiments, the WE was stably immersed in the solution for 30 min. The open circuit potential (OCP) vs. time plot was recorded during the stabilization process. Electrochemical impedance spectroscopy (EIS) tests were performed at the OCP with a small amplitude ac voltage of 5 mV and a frequency spectrum ranging from 100 kHz to 10 mHz with 10 points per hertz decade. After EIS measurements, potentiodynamic polarization curves were recorded with 1 mV s−1 scanning rate from −300 mV to 400 mV (vs. OCP).
2.4 Weight loss test
Cleaned steel coupons were weighed and then immersed in conical flasks with 1.0 M aerated HCl aqueous solution for 4 h. The same experiment temperatures and inhibitor concentrations were used in the electrochemical tests. After immersion experiment, the samples were removed and cleaned with double-distilled water, washed with ethanol, dried and weighed.
2.5 Surface morphologies observation
Optical microscope was used to observe the surface morphologies of the weight loss samples after immersion test. Stereo microscope was applied to characterize the bottom surface features of the sheet samples.
3 Results and discussion
3.1 Open circuit potential (OCP) curves
Compound 1 was designed bearing nucleophile centers with heteroatoms and unlocalized π-electron to readily share and donate electrons to empty orbit of electrophilic metal, then form a coordinate covalent chemical bond (Scheme 1). The relationship between open circuit potential (OCP) and immersion time of mild steel in 1.0 M HCl with concentrations (0 to 1.0 mM) of inhibitor 1 is shown in Fig. 1. During the preliminary 15 min, the OCPs in the absence of inhibitor shift to positive values quickly, while the OCPs in the presence of inhibitor show no definite trend. The system could reach a steady state after 30 min OCP test. Consequently, 30 min is chosen as stabilization time for subsequent EIS and polarization measurements. Also, it is found that the OCP shifts towards more noble values with the addition of inhibitor 1 at 25 °C, while there is no obvious tendency at higher temperatures. But the displacements of OCP are very small (29–61 mV difference between the highest and lowest OCP values).
 |
| Fig. 1 Open circuit potential vs. time plots of mild steel in 1.0 M HCl at 25 °C (a), 50 °C (b), 70 °C (c) and 90 °C (d) with the concentrations of inhibitor. | |
3.2 Potentiodynamic polarization curves
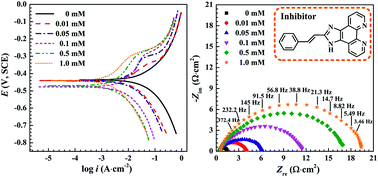
Fig. 2 shows the potentiodynamic polarization curves of mild steel in 1.0 M HCl with concentrations (0 to 1.0 mM) of inhibitor 1. As expected, both anodic and cathodic reactions were inhibited in the presence of 1. The electrochemical corrosion parameters such as the free corrosion potential (Ecorr), corrosion current density (icorr), slope of the cathodic branch (bc), slope of the anodic branch (ba), corrosion rate (CR) and inhibition efficiency (IE) associated with different conditions were determined and listed in Table S1.† Since both the cathodic and anodic corrosion reactions were inhibited, the surface coverage degrees (θ) in Table S1† can be calculated by the equation:31 |
 | (1) |
where (icorr)inh and (icorr)0 represents current density in the presence and absence of inhibitor, respectively. IE values (%) in Table S1† are determined on the basis of eqn (2):31
 |
| Fig. 2 Potentiodynamic polarization curves of mild steel in 1.0 M HCl at 25 °C (a), 50 °C (b), 70 °C (c) and 90 °C (d) with the concentrations of inhibitor. | |
Generally, the corrosion current densities decreased markedly with the addition of inhibitor, implying a slower corrosion process. According to Zarrouk,6 if the shift value of Ecorr in the presence of inhibitor is larger than 85 mV compared to that in its absence, the inhibitor can be considered as a cathodic or anodic type; and if the shift is less than 85 mV, it can be regarded as mixed-type. Riggs32 and Ferreira33 stated that such classification for the inhibitor is reasonable only in the case when the OCP displacement is not less than 85 mV compared to the blank specimen. If an inhibitor could not induce OCP displacements (or only very small ones), it means that the inhibitor acts simultaneously on anodic and cathodic reactions, which can be regarded as mixed-type. As is shown in Fig. 1 and 2, the displacement in OCP and Ecorr with addition of 1 is less than 85 mV, suggesting that the compound behaved as a mixed-type inhibitor. An interesting phenomenon is the different shifting trend of Ecorr (or OCP) at 25 °C and higher temperatures. At 25 °C, Ecorr displayed positive shift with addition of 1, implying 1 inhibited the anodic reaction (dissolution of steel substrate) to more extent. In contrast, at the other temperatures, the negative shift of Ecorr in the presence of 1 demonstrated the cathodic reaction (hydrogen evolution reaction) was dominantly inhibited. It is assumed that, the addition of 1 fascinated the inhibition of both two processes, but with the temperature, cathodic reaction was affected much more seriously than anodic reaction, leading to the different trend of changes in Ecorr.
However, it is clear that IE generally increased with both inhibitor concentration and temperature. For instance, with 1.0 mM inhibitor, IE is only 84.2% at 25 °C, but increases to 97.6% at 90 °C. This can be explained by the fact that higher temperature allows for a better solubility of 1 in acid medium, fascinating more 1 to adsorb on the steel, followed by a much stronger film formation.34–36 Besides, due to chemisorptions playing a critical role, 1 performed as efficient inhibitor at higher temperatures (see Section 3.4).
In compare with other types of imidazolines or their derivatives, compound 1 displays better inhibition effect in 1 M HCl under the similar conditions.7,31,37–42 More importantly, only a few imidazolines or their derivatives were reported to still display sufficient inhibition effect at temperatures higher than 50 °C, while inhibitor 1 performs much better at higher temperatures.
According to the results of surface coverage degree (θ) and the mixed-type nature of the inhibitor, it is concluded that the inhibition function is attributed to geometric blocking effect caused by the inhibitor adsorption.43 Since the addition of 1 reduced anodic dissolution and retarded the cathodic hydrogen evolution reaction (HER), both the anodic and cathodic branches shifted to lower current densities. Meanwhile, with the concentration of 1, the cathodic branch features are similar to that without 1, indicating that the inhibitor does not change the HER mechanism.44 However, for the anodic branches, the curves of blank samples are simple arcs while each of the inhibited curves exhibits a platform, which divides the anodic branches into three stages, named as stage I, II and III, as shown in Fig. 2d. Qu et al. illustrated the three steps in the anodic dissolution region during the potential sweeping: ideal adsorb stage (stage I), start of desorption (stage II) and completely desorption (stage III).45 In the stage I, the inhibitor molecules strongly adsorbed on the electrode surface and displayed satisfying protection. With the increase of applied potential, the desorption of the inhibitor molecules occurred and the current density sharply increased, in accordance with the appearance of platform resign as shown in the stage II.46 In the stage III, due to the complete desorption of inhibitor, the anodic dissolution reaction behaved similarly to that of the blank sample, thus the anodic branches in the presence of 1 approaches that in its absence.22
3.3 Electrochemical impedance spectroscopy (EIS)
The Nyquist plots of mild steel in 1.0 M HCl with different concentrations of 1 are shown in Fig. 3. The pure electric models can verify mechanistic models and enable the calculation of parameters corresponding to the physical and/or chemical properties of the electrochemical system under investigation.47 In Fig. 3, each spectrum consists of one capacitive arc featuring only one time constant obtained.19 Therefore, the equivalent circuit model shown in Fig. S1† was applied to determine the main electrochemical parameters and the results are listed in Table S2.†
 |
| Fig. 3 Nyquist plots of mild steel in 1.0 M HCl at 25 °C (a), 50 °C (b), 70 °C (c) and 90 °C (d) with the concentrations of inhibitor. | |
In the equivalent circuit, constant phase element (CPE) is simulated to analyze the non ideal capacitive behaviour of mild steel in HCl solution; Rct is the charge transfer resistance which represents the resistance between the metal surface and outer Helmholtz plane; Rs is the solution resistance. In Table S2,† Cdl is the electrical double layer capacitance; n is related to phase angle; θ was obtained from the following equation:48
|
 | (3) |
where (
Rct)
0 and (
Rct)
inh is the charge transfer resistance in the absence and presence of
1, respectively.
As shown in Fig. 3, throughout all tested concentration, the capacitive arc diameters with inhibitor 1 are bigger than that in its absence, and the changes of impedance response of the test steel are more pronounced with the increasing concentration of 1. Besides, similar shapes are found in all the diagrams, indicating that the presence of 1 cannot affect the corrosion mechanism of the steel in HCl solution. It is noted that the deviation from the ideal semicircle of capacitive loops is related to the electrode surface inhomogeneous properties, e.g., surface roughness, dislocations, impurities, aqueous layers and so on.11 In particular, when inhibitors adsorption involved, the surface status of the steel will be changed. Exponent n is often used to evaluate the impact of inhibitors adsorption.9,49,50 For ideal surface, n equals 1, but n ranges from 0 to 1 in actual circumstances. The value of n closer to 1 indicates a less inhomogeneous degree of the steel surface. As exhibited in Table S2,† in the presence of inhibitor, n is lower than that in its absence, suggesting that inhibitor adsorption increased the surface inhomogeneous degree of mild steel in 1.0 M HCl. However, the influence of inhibitor concentrations on n seems has no linear function, although the surface coverage increased. Inspection of data in Table S2,† Rct prominently increased while Cdl decreased with the concentrations of inhibitor, suggesting the formation of a protective adsorption film on the steel surface. According to the Stern model, in the compact layer, Cdl positively correlates with local dielectric constant (ε), and negatively correlates with double layer thickness (d), that is: Cdl ∝ ε and Cdl ∝ d−1.51 The decrease in Cdl indicates the decrease in ε or increase in d, which were caused by adsorption of inhibitor molecules at metal/solution interface.52 Therefore, lower Cdl and higher Rct values are associated with slower corroding systems. In line with potentiodynamic polarization, IE increased with the concentration of 1 at the same temperature and with the temperature at any given concentration. Typically, the addition of 1.0 mM 1 at 90 °C gives Rct of 18.59 Ω cm2, Cdl of 2.21 × 10⁻⁴ F cm−2 and IE of 94.3% respectively.
3.4 Kinetic and thermodynamic analysis
Electrochemical experiments demonstrate 1 can efficiently protect the steel from corrosion. Thermodynamic parameters are very useful to ascertain the inhibitive mechanism and investigate the influence of temperature and inhibitor concentration. In this section, the analysis of kinetic and thermodynamic was conducted based on polarization data. Activation energy (Ea) of the corrosion process reflects the reaction rate, which has been accomplished by investigating the temperature dependence of the corrosion rates. The values of Ea are obtained based on Arrhenius equation:53 |
 | (4) |
where CR represents corrosion rate, R is the universal gas constant, T is the absolute temperature, A is the pre-exponential factor. Besides, eqn (4) can be written as follows: |
 | (5) |
According to eqn (5), the natural logarithm of CR behaves linear function with 1/T. Therefore, the value of Ea could be obtained by calculating the linear slope (−Ea/R) of eqn (5). The correspondence plots are shown in Fig. 4, and the values of Ea are listed in Table 1. It is found that Ea is lower in the presence of 1 than in its absence, and more obvious decrease of Ea is accompanied by more efficient inhibiting effect with the concentration of 1. The decrease of activation energy with inhibitor concentration is a typical of chemisorption.9,50,53
 |
| Fig. 4 Arrhenius plots of ln CR vs. 1/T for mild steel in 1.0 M HCl at 25 °C, 50 °C, 70 °C and 90 °C with the concentrations of inhibitor. | |
Table 1 Values of activation parameters for mild steel in 1.0 M HCl with the concentrations of inhibitor
C (mM) |
Ea (kJ mol−1) |
ΔH* (kJ mol−1) |
ΔS* (J mol−1 K−1) |
0 |
71.58 |
68.84 |
−30.35 |
0.01 |
69.67 |
66.93 |
−49.39 |
0.05 |
66.35 |
63.60 |
−61.27 |
0.1 |
60.03 |
57.28 |
−82.47 |
0.5 |
54.12 |
51.38 |
−101.93 |
1.0 |
47.14 |
44.40 |
−124.63 |
A transition state formulation of Arrhenius equation as follows can be used to calculate enthalpy and entropy of the activation:54
|
 | (6) |
where
CR is the corrosion rate, Δ
H* is the enthalpy of the activation, Δ
S* is the entropy of the activation,
R is the universal gas constant,
T is the absolute temperature,
NA is Avogadro's number,
h is Plank's constant. The values of Δ
H* and Δ
S* could be obtained by respectively calculating the slopes (−Δ
H*/
R) and intercepts [ln(
R/
NAh) + (Δ
S*/
R)] of
eqn (6). Plots of ln(
CR/
T) against 1/
T are shown in
Fig. 5, and the values of Δ
H* and Δ
S* are listed in
Table 1.
 |
| Fig. 5 Arrhenius plots of ln CR/T vs. 1/T for mild steel in 1.0 M HCl at 25 °C, 50 °C, 70 °C and 90 °C with the concentrations of inhibitor. | |
The positive signs of ΔH* reflect the transition state (formation of the activated complex) is an endothermic process.11,19,50,56 Generally, the positive signs of ΔH* are not influenced by the presence of inhibitor, reflecting the addition of inhibitor cannot change the endothermic character of the activated complex formation process. In the presence of 1, the values of ΔS* decreased and is generally interpreted as a decrease in disordering, which is due to the adsorption of organic inhibitor accompanied by desorption of water molecules on the metal/solution surface.10
Usually, the free energy of adsorption (ΔG0ads) is used to clarify the type of adsorption between inhibitor and the metal surface. Values of ΔG0ads around or less negative than −20 kJ mol−1 indicate physisorption processes, resulting from electrostatic interaction between the charged organic molecules and metal surface; while those more negative than −40 kJ mol−1 imply chemisorption, which involves charge sharing or transfer from the inhibitor molecules to the metal surface to form a coordinate type of bond. The values between −20 kJ mol−1 and −40 kJ mol−1 are considered as physisorption and chemisorption.55–59 ΔG0ads is correlated to the adsorption equilibrium constant (Kads) by the relation:60
|
 | (7) |
where
R is the universal gas constant,
T is the absolute temperature. In order to determine
Kads, attempts were made to fit experimental data with various isotherms, such as the Langmuir, Terkin, Frumkin as well as Flory–Huggins isotherms. It is found that Langmuir isotherm is the best description of the adsorption behaviour of the tested inhibitor. Langmuir isotherm for monolayer chemisorption has the form as follows:
61 |
 | (8) |
where
θ is the surface coverage degree,
C is the concentration of the inhibitor. A transition state form of
eqn (8) is:
|
 | (9) |
Therefore, the value of Kads can be obtained by calculating the intercept of the plot of C/θ vs. C. Langmuir's adsorption plots of C/θ vs. C for mild steel in 1.0 M HCl is exhibited in Fig. 6. The straight line gives the ideal correlation coefficients (R2) with values all above 0.999 (Table 2). Based on eqn (7) and (9), Kads and ΔG0ads are calculated and listed in Table 2. The negative values of ΔG0ads indicate the spontaneity of the adsorption process. ΔG0ads more negative than −40 kJ mol−1 and decreasing with temperature in the range of 25–90 °C demonstrate that the organic species can adsorb on the steel surface with a typical of chemisorption, implying the formation of a stable protection layer.45
 |
| Fig. 6 Langmuir's adsorption plots of C/θ vs. C for mild steel in 1.0 M HCl at 25 °C, 50 °C, 70 °C and 90 °C with the concentrations of inhibitor. | |
Table 2 Values of thermodynamic parameters for mild steel in 1.0 M HCl at 25 °C, 50 °C, 70 °C and 90 °C with the concentrations of inhibitor
Temp. (°C) |
R2 |
Kads (L mol−1) |
ΔG0ads (kJ mol−1) |
25 |
0.9999 |
7.87 × 10⁵ |
−43.61 |
50 |
0.9995 |
3.69 × 10⁵ |
−45.23 |
70 |
0.9997 |
2.78 × 10⁵ |
−47.22 |
90 |
0.9999 |
1.89 × 10⁵ |
−48.80 |
3.5 Weight loss measurements
Compared with electrochemistry experiment, weight loss test provides more direct information for the evaluation of the inhibition effect. In combination with surface morphologies analysis, weight loss measurement results usually induce improved method to enhance protection of steel. The corrosion rates (CR) were calculated by the following equation:62 |
 | (10) |
where ΔW is the average weight loss of three parallel sheet samples (mg), A is the area of the samples (cm−2), t is the immersion time (h). The inhibition efficiency (IE) was calculated according to the following equation:62 |
 | (11) |
where CR0 represents the corrosion rate in the absence of inhibitor, and CRinh is that in its presence. The values of corrosion rate (CR) and inhibition efficiency (IE) obtained from weight loss tests for various concentrations of 1 at 25–90 °C are summarized in Table 3. It can be seen that by increasing inhibitor concentration, the corrosion rate decreased and inhibition efficiency increased when temperature ranged from 25 to 70 °C. Noticeably, if concentration of inhibitor is controlled less than 0.1 mM, CR decreases dramatically with an increase in concentration, with the typical IE of 76.9% at 25 °C, 86.4% at 50 °C and 86.1% at 70 °C, respectively. However, further increases in concentration caused no appreciable changes in IE. Since the adsorption of inhibitors on the metal surface is an exothermic process, after saturated adsorption of inhibitor, the excess molecules tended to desorb from the metal surface due to the intermolecular repulsion. Besides, it is found that with the temperature, although the CR increased, the presence of 1 gives the more enhanced IE values, which is related to the chemisorption behaviour of 1 at higher temperature.
Table 3 Weight loss results of mild steel in 1.0 M HCl at 25 °C, 50 °C, 70 °C and 90 °C with the concentrations of inhibitor
C (mM) |
CR (mg cm−2 h−1) |
IE (%) |
CR (mg cm−2 h−1) |
IE (%) |
CR (mg cm−2 h−1) |
IE (%) |
CR (mg cm−2 h−1) |
IE (%) |
25 °C |
50 °C |
70 °C |
90 °C |
0 |
28.1 × 10⁻² |
— |
11.0 × 10⁻¹ |
— |
61.7 × 10⁻¹ |
— |
265.0 × 10⁻¹ |
— |
0.01 |
7.8 × 10⁻² |
72.2 |
2.0 × 10⁻¹ |
81.8 |
10.7 × 10⁻¹ |
82.7 |
41.2 × 10⁻¹ |
84.5 |
0.05 |
6.6 × 10⁻² |
76.5 |
1.6 × 10⁻¹ |
85.5 |
8.7 × 10⁻¹ |
85.9 |
9.4 × 10⁻¹ |
96.5 |
0.1 |
6.5 × 10⁻² |
76.9 |
1.5 × 10⁻¹ |
86.4 |
8.6 × 10⁻¹ |
86.1 |
7.7 × 10⁻¹ |
97.1 |
0.5 |
6.2 × 10⁻² |
77.9 |
1.3 × 10⁻¹ |
88.2 |
8.2 × 10⁻¹ |
86.7 |
15.5 × 10⁻¹ |
94.2 |
1.0 |
6.1 × 10⁻² |
78.3 |
1.2 × 10⁻¹ |
89.1 |
8.2 × 10⁻¹ |
86.7 |
19.8 × 10⁻¹ |
92.5 |
Interestingly, the inhibition efficiency at 90 °C increases with the concentration of 1 and then goes down to a maximum of 97.1% with 0.1 mM inhibitor. The surface micro-morphologies of samples after weight loss measurement by optical microscope were shown in Fig. 7. It is clear that, at 90 °C, the corrosion morphologies of sheet samples are unique: the front surface of the blank sample (without inhibitor) is severely ruined with deep pits; however, in the presence of 1, better protected surfaces with fewer pits were obtained.
 |
| Fig. 7 Front and bottom surfaces morphologies of mild steel samples after weight loss experiment in 1.0 M HCl solution with the concentrations of inhibitor: (a) 0 mM; (b) 0.05 mM; (c) 0.1 mM; (d) 0.5 mM and (e) 1.0 mM. | |
In this regard, the inhibition efficiencies at 90 °C should be raised along with the inhibitor concentration. To our surprise, with the concentration of inhibitor, the bottom surface of the samples was corroded more seriously with some deep pits, leading to slightly decrease of the IE value. The corrosion morphologies at 25–70 °C exhibited same features, however, due to much lower corrosion rates, the “bottom surface defect” was not strong enough to affect the inhibition efficiency tendency.
3.6 Synergistic effect of iodide ions
Although the reason is still unclear, and the related study on this phenomenon is going on now, the above “bottom surface defect” pressurised us to look for an effective solution to the problem. An idea to strengthen the adsorption action between inhibitor molecules and metal surface came out. Generally, synergistic effect of halide ions is suggested to be an effective and convenient way to enhance the performance of inhibitors in complicated corrosive environments.20 They could create oriented dipoles and facilitate the adsorption of protonated inhibitor cations on the dipoles prior to adsorption on metal surface.22–25,63 In most cases, it was reported that iodide ions have better synergistic effect than chloride and bromine ions.22,25 Therefore, the synergistic effect of iodide ions in combination of inhibitor 1 in 1.0 M HCl solution was investigated via electrochemical methods as well as weight loss measurement.
The OCP vs. immersion time plots with 0.5 mM 1 or 0–100 mM KI are shown in Fig. 8. The OCPs varied quickly in the preliminary 15 min, but they could reach a steady state after 30 min OCP test. Addition of 100 mM KI gives noblest OCP, but the OCP values show no obvious tendency in the presence of 1 with 0–100 mM KI.
 |
| Fig. 8 Open circuit potential vs. time plots of mild steel in 1.0 M HCl with KI and 0.5 mM inhibitor at 90 °C. | |
Fig. 9 and Table S3† display the polarization curves and Tafel fitting data with the same condition as that in Fig. 8. The Nyquist plots and fitting results are shown in Fig. 10 and Table S4†, respectively. It is clear that I− itself could well protect mild steel in 1.0 M HCl solution from corrosion, but the inhibition efficiency is relatively lower than that with only 0.5 mM inhibitor. When the inhibitor and I− were both added, the inhibition effect increased dramatically; the corrosion current density decreased distinctly and radius of the capacitance arcs increased evidently. In the presence of 50 mM KI and 0.5 mM 1 could lead to the enhanced IE reaching up to 99.1% at 90 °C. For Nyquist plots, the presence of KI did not affect the time constant, but was featured by larger capacitive arcs and gives an improved IE value up to 98.8%. This means that I− promotes adsorption of inhibitor molecules without changing the electrochemical reaction mechanism. Usually, organic inhibitor acting as a protective film with a typical chemisorption on the metal surface is affected by interaction between organic molecules, iodide ions and metal.24 Distinctly, the polar electron-donating groups on the organic inhibitors can transfer electrons to metal orbit, followed by a formation of a strong chemical bond. On the other hand, iodide ions can facilitate the adsorption of inhibitor cations through charging and creating oriented dipoles on the steel surface, accomplished by a higher IE.63
 |
| Fig. 9 Potentiodynamic polarization curves of mild steel in 1.0 M HCl with KI and 0.5 mM inhibitor at 90 °C. | |
 |
| Fig. 10 Nyquist plots of mild steel in 1.0 M HCl with KI and 0.5 mM inhibitor at 90 °C. | |
Weight loss test exhibits a dramatically enhanced IE value of 99.2% in the presence of 0.5 mM inhibitor and 50 mM KI at 90 °C, which is much higher than that without KI (Table 3). Inspection of the morphology in Fig. S2† revealed that the front surface of weight loss sample was smooth with a few small notches. However, much to our surprise, the bottom surface was perfectly protected, opposite to what was observed in the absence of KI. Reduced steel surface damage highlights the combination of 1 and KI facilitates the better protection from acidic corrosion, and also efficiently eliminates the “bottom surface risk”. Very recently, a co-adsorption mechanism was used to interpret cooperative mechanism of the counterion to enhance inhibition efficiency.64 Without KI, the positively charged mild steel surface prevents organic cations from adsorbing onto the metal surface. However, in the presence of HCl, chloride ions can undergo the expected specific adsorption, followed by the charged mild steel surface. Being specifically adsorbed, they create an excess negative charge towards the solution and favour the electrostatic adsorption of the cations. Thus, organic cations gain access to the mild steel–solution interface, consequently leading to an increase in surface coverage and inhibition efficiency compared to the blank samples. In comparison, in the presence of KI, Cl− then initially adsorbed from the anode's metal surface and is readily displaced by I−. This can be explained by the advantages in hydration and electronegativity degree of I−, which can favour I− much more easily attach on the metal surface. Being specifically adsorbed, I− can create an excess negative charge towards the solution and allow much more organic cations to adsorb by coulombic attraction, leading to a denser film and better protection of the steel from exposure to the acidic medium. As a result, KI additive facilitates organic cations to access to steel/solution interface and leads to more dense film and better protection of steel from exposure to the acidic medium.
4 Conclusion
A novel 1H-benzo-imidazole derivative (1) bearing several multiple adsorption centres was synthesized and developed as corrosion inhibitor in acidic medium. Potentiodynamic polarization, electrochemical impedance spectroscopy and weight loss indicate that inhibitor 1 can efficiently protect mild steel from corrosion in 1.0 M HCl solution, with better performance at moderately higher concentration and temperature. Chemisorption enables 1 to create a dense and stable film covering on mild steel surface. More interestingly, in the presence of KI, synergistic effect benefits for less corrosion of the sample bottom. The high inhibition activity of 1 implies that it can be fruitful to explore 1H-benzo-imidazole derivatives based on similar frameworks for corrosion inhibition of mild steel in acidic medium. To improve the inhibition performance of 1H-benzo-imidazole derivatives, the modification of the scaffold is currently in progress.
Acknowledgements
The authors gratefully acknowledge the funding and technical supports from the Tubular Goods Research Institute (TGRI) of China National Petroleum Corporation (CNPC), the National Natural Science Foundation of China (1202020425), the Fundamental Research Funds for the Central Universities (1301030461). The authors also would like to thank Jiedi Lei from University College London (UCL) for her great help with the language improvement.
References
- H. H. Uhlig and R. W. Revie, Corrosion and Corrosion Control, Wiley, New York, 1985 Search PubMed.
- C. C. Nathan, Organic Inhibitor, NACE, Houston, TX, 1977 Search PubMed.
- I. L. Rosenfeld, Corrosion Inhibitors, McGraw-Hill, New York, 1981 Search PubMed.
- G. Trabanelli, Corrosion, 1991, 47, 410–419 CrossRef CAS.
- V. S. Sastri, Green Corrosion Inhibitors: Theory and Practice, John Wiley and Sons, New York, 1998 Search PubMed.
- A. Zarrouk, B. Hammouti and T. Lakhlifi, Corros. Sci., 2015, 90, 572–584 CrossRef CAS.
- K. G. Zhang, B. Xu and W. Z. Yang, Corros. Sci., 2015, 90, 284–295 CrossRef CAS.
- M. Lebrini, M. Lagrenee and H. Vezin, Corros. Sci., 2007, 49, 2254–2269 CrossRef CAS.
- G. Quartarone, L. Ronchin and A. Vavasori, Corros. Sci., 2012, 64, 82–89 CrossRef CAS.
- R. Puthalath, A. O. Surendranathan and C. S. N. Murthy, Ind. Eng. Chem. Res., 2014, 53, 23–30 CrossRef CAS.
- M. A. Hegazy, A. M. Badawi and S. S. Abd El Rehim, Corros. Sci., 2013, 69, 110–122 CrossRef CAS.
- M. Lebrini, F. Robert and H. Vezin, Corros. Sci., 2010, 52, 3367–3376 CrossRef CAS.
- A. Kosari, M. H. Moayed and A. Davoodi, Corros. Sci., 2014, 78, 138–150 CrossRef CAS.
- M. Yadav and S. Kumar, Surf. Interface Anal., 2014, 46, 254–268 CrossRef CAS.
- A. Espinoza-Vázquez, G. E. Negrón-Silva and R. González-Olvera, Mater. Chem. Phys., 2014, 145, 407–417 CrossRef.
- W. H. Li, Q. He and S. T. Zhang, J. Appl. Electrochem., 2008, 38, 289–295 CrossRef CAS.
- D. Daoud, T. Douadi and S. Issaadi, Corros. Sci., 2014, 79, 50–58 CrossRef CAS.
- N. A. Negm, F. M. Ghuiba and S. M. Tawfik, Corros. Sci., 2011, 53, 3566–3575 CrossRef CAS.
- M. A. Hegazy, M. Abdallah and M. K. Awad, Corros. Sci., 2014, 81, 54–64 CrossRef CAS.
- M. Finšgar and J. Jackson, Corros. Sci., 2014, 86, 17–41 CrossRef.
- A. Yıldırım and M. Cetin, Corros. Sci., 2008, 50, 155–165 CrossRef.
- A. Khamis, M. M. Saleh and M. I. Awad, Corros. Sci., 2013, 66, 343–349 CrossRef CAS.
- M. K. Pavithra, T. V. Venkatesha and K. Vathsala, Corros. Sci., 2010, 52, 3811–3819 CrossRef CAS.
- M. Heydari and M. Javidi, Corros. Sci., 2012, 61, 148–155 CrossRef CAS.
- S. A. Umoren, O. Ogbobe and I. O. Igwe, Corros. Sci., 2008, 50, 1998–2006 CrossRef CAS.
- E. E. Oguzie, Y. Li and F. H. Wang, J. Colloid Interface Sci., 2007, 310, 90–98 CrossRef CAS PubMed.
- I. B. Obot, N. O. Obi-Egbedi and A. O. Eseola, Ind. Eng. Chem. Res., 2011, 50, 2098–2110 CrossRef CAS.
- N. O. Obi-Egbedi, I. B. Obot and A. O. Eseola, Arabian J. Chem., 2014, 7, 197–207 CrossRef CAS.
- M. A. Subhan, M. S. Rahman and K. Alam, Spectrochim. Acta, Part A, 2014, 118, 944–950 CrossRef PubMed.
- H.
Y. Wang, G. Si and W. G. Wang, Chem. Commun., 2011, 47, 8406–8408 RSC.
- J. Aljourani, K. Raeissi and M. A. Golozar, Corros. Sci., 2009, 51, 1836–1843 CrossRef CAS.
- O. L. Riggs Jr, Corrosion Inhibitors, ed. C. C. Nathan, Houston, TX, 2nd edn, 1973 Search PubMed.
- E. S. Ferreira, C. Giacomelli and F. C. Giacomelli, Mater. Chem. Phys., 2004, 83, 129–134 CrossRef CAS.
- X. M. Wang, H. Y. Yang and F. H. Wang, Corros. Sci., 2010, 52, 1268–1276 CrossRef CAS.
- E. E. Oguzie, V. O. Njoku and C. K. Enenebeaku, Corros. Sci., 2008, 50, 3480–3486 CrossRef CAS.
- A. Popova, M. Christov and A. Vasilev, Corros. Sci., 2015, 94, 70–78 CrossRef CAS.
- A. Popova, E. Sokolova and S. Raicheva, Corros. Sci., 2003, 45, 33–58 CrossRef.
- K. F. Khaled, Electrochim. Acta, 2003, 48, 2493–2503 CrossRef CAS.
- J. Cruz, R. Martınez and J. Genesca, J. Electroanal. Chem., 2004, 566, 111–121 CrossRef CAS.
- J. Zhang, X. L. Gong and H. H. Yu, Corros. Sci., 2011, 53, 3324–3330 CrossRef CAS.
- O. Olivares-Xometl, N. V. Likhanova and M. A. Domınguez-Aguilar, Appl. Surf. Sci., 2006, 252, 2139–2152 CrossRef CAS.
- A. O. Yüce, B. D. Mert and G. Kardas, Corros. Sci., 2014, 83, 310–316 CrossRef.
- R. Solmaz, Corros. Sci., 2014, 81, 75–84 CrossRef CAS.
- H. Hamani, T. Douadi and M. Al-Noaimi, Corros. Sci., 2014, 88, 234–245 CrossRef CAS.
- Q. Qu, Z. Z. Hao and L. Li, Corros. Sci., 2009, 51, 569–574 CrossRef CAS.
- Y. Feng, K. S. Siow and W. K. Teo, Corros. Sci., 1999, 30, 718–741 Search PubMed.
- N. A. Negma, N. G. Kandile and E. A. Badr, Corros. Sci., 2012, 65, 94–103 CrossRef.
- N. S. Ayati, S. Khandandel and M. Momeni, Mater. Chem. Phys., 2011, 126, 873–879 CrossRef CAS.
- M. Özcan, D. Toffoli and H. Üstünel, Corros. Sci., 2014, 80, 482–486 CrossRef.
- X. W. Zheng, S. T. Zhang and W. P. Li, Corros. Sci., 2014, 80, 383–392 CrossRef CAS.
- A. J. Bard and L. R. Faulkner, Electrochemical Methods: Fundamentals and Applications, John Wiley and Sons, 2nd edn, 2001 Search PubMed.
- K. F. Khaled and N. Hackerman, Mater. Chem. Phys., 2003, 82, 949–960 CrossRef CAS.
- F. Bentiss, M. Traisnel and M. Lagrenee, J. Appl. Electrochem., 2001, 31, 41–48 CrossRef CAS.
- J. O. 'M. Bochris and A. K. N. Reddy, Modern Electrochemistry, Plenum Press, New York, 1977 Search PubMed.
- J. Marsh, Advanced Organic Chemistry, Wiley Eastern, New Delhi, 1988 Search PubMed.
- F. Bentiss, M. Lebrini and M. Lagrenee, Corros. Sci., 2005, 47, 2915–2931 CrossRef CAS.
- I. Lozano, E. Mazario and C. O. Olivares-Xometl, Mater. Chem. Phys., 2014, 147, 191–197 CrossRef CAS.
- H. Bentrah, Y. Rahali and A. Chala, Corros. Sci., 2014, 82, 426–431 CrossRef CAS.
- G. I. Ostapenko, P. A. Gloukhov and A. S. Bunev, Corros. Sci., 2014, 82, 265–270 CrossRef CAS.
- S. Issaadi, T. Douadi and S. Chafaa, Appl. Surf. Sci., 2014, 316, 582–589 CrossRef CAS.
- C. J. Zou, X. L. Yan and Y. B. Qin, Corros. Sci., 2014, 85, 445–454 CrossRef CAS.
- S. D. Deng, X. H. Li and H. Fu, Corros. Sci., 2010, 52, 3840–3846 CrossRef CAS.
- N. Caliskan and S. Bilgic, Appl. Surf. Sci., 2000, 153, 128–133 CrossRef CAS.
- L. Bai, L. J. Feng and H. Y. Wang, RSC Adv., 2015, 5, 4716–4726 RSC.
Footnote |
† Electronic supplementary information (ESI) available: Electrochemical parameters obtained from Tafel polarization curves and Nyquist plots; electrical equivalent circuit used for modeling the metal–solution interface; surface morphology of mild steel after weight loss test in the presence of inhibitor and KI. See DOI: 10.1039/c5ra15002g |
|
This journal is © The Royal Society of Chemistry 2015 |
Click here to see how this site uses Cookies. View our privacy policy here.