Preparation, electrochemical responses and sensing application of Au disk nanoelectrodes down to 5 nm

Yaoyao Zhang, Shen Xu, YuanYuan Qian, Xiaosong Yang and Yongxin Li*
College of Chemistry and Materials Science, Anhui Normal University, Wuhu 241000, China. E-mail: yongli@mail.ahnu.edu.cn; Fax: +86-553-3869303; Tel: +86-553-3869302

Received 25th July 2015 , Accepted 4th September 2015

First published on 4th September 2015


Abstract

In this work, we report the preparation and electrochemical responses of Au disk nanoelectrodes as small as 5 nm in radii by the improvement of the laser-assisted pulling technique. A Au microwire is sealed into a bilayer capillary and pulled into an ultrasharp Au nanowire sealed in a silica tip using a laser-assisted puller. The ultrasharp tip is then sealed into a piece of glass tube, which is manually polished to expose the Au. Transmission electron microscopy, steady-state voltammetry of small redox species (e.g., ferrocene (Fc), ferrocene methanol (FcH2OH), potassium ferricyanide (Fe(CN)63−), hexaammineruthenium(III)chloride (Ru(NH3)63+)), and cyclic voltammetry in a H2SO4 solution are utilized to characterize the nanoelectrodes. The heterogeneous electron transfer rate constants for the oxidation/reduction of Fc, FcH2OH, Fe(CN)63−, and Ru(NH3)63+ are determined from steady-state voltammetry using the method developed by Mirkin and Bard and found to be ko = 7.9 ± 3.6 cm s−1 and α = 0.41 ± 0.04 for Fc, ko = 7.4 ± 7.1 cm s−1 and α = 0.41 ± 0.23 for FcCH2OH, ko = 4.0 ± 3.6 cm s−1 and α = 0.52 ± 0.17 for Fe(CN)63−, and ko = 7.2 ± 6.9 cm s−1 and α = 0.53 ± 0.22 for Ru(NH3)63+. These Au disk nanoelectrodes have been used to investigate the direct electrochemistry of ferritin molecules, which are immobilized on the Au surface by an electrostatic interaction between the cysteamine monolayer modified on the Au surface and ferritin molecules. From the voltammetric peak of ferritin on the Au nanoelectrode (200 nm in radius), the amount of ∼3900 molecules or 6.1 zmol can be calculated.
1. Introduction

Electrodes with nano-scale size have shown tremendous advantages such as smaller RC constants, faster mass-transport rates, and lower influences from solution resistance.1–7 Due to their small size, nanoelectrodes are exhibiting extensive applications in numerous areas, such as the study of electron transfer kinetics,8–11 detection of single molecules and single nanoparticles,12–14 high-resolution imaging in scanning electrochemical microscopy (SECM) and scanning tunneling microscopy (STM),15–21 atomic force microscopy (AFM),22 and chemical analysis and bioanalysis.23–26

In the past decades, several different methods have been reported producing single nanoelectrodes of submicrometer dimensions, which include glass encapsulation,3,27 electrochemical/chemical etching techniques followed by electrodeposition,11,28,29 and micropipette/capillary pulling and microfabrication,16,30 etc. Among above methods, the use of a laser puller for the fabrication of nanoelectrodes has its advantage such as simple, rapidness and good reproducibility.5,7,10,12,18,21,24,26,29,31,32 Mirkin's group has reported the preparation and electrochemical responses of nanoelectrodes,7,10,18,21,24,26,29,31–33 and also investigated their applications in the adsorption/desorption of hydrogen,33 electron transfer reactions,10,18,34 and electrocatalysis,35,36 etc. Schuhmann's group and Sun's group have each discussed the fabrication process of Pt nanoelectrodes.16,17,37 Zhang's group reported recently the preparation and characterization of the Pt nanoelectrode with a radius of 1–3 nm,5 which can be used to fabricate single gold nanoelectrode12,14 and single nanowire electrode.38

Most of nanoelectrodes previously fabricated in Zhang's group were made of Pt.5,12,38 It is well-known that other metal (e.g., Au) electrodes have more extensively applications due to the good reaction activity of gold surface (e.g., surface modification through molecular self-assembly,39 electrocatalysis,40 bioanalysis41). Many attempts have been reported to address the fabrication of Au nanoelectrode using laser-assisted pulling technique.27,32,42 Mirkin et al. recently developed gold nanotips to study the electron transfer rate using SECM.32 Zhang's group and Shi's group also fabricated gold disk nanoelectrodes.42,43 Because the melting point of gold (1064 °C) is lower than platinum (1710 °C), it is still a challenge to fabricate single Au nanoelectrodes within extremely small size (e.g., r < 5 nm), and this would limit their applications such as bio-analysis and catalysis.

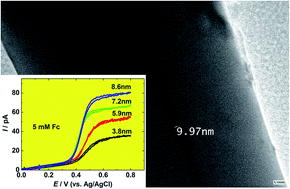
In this paper, we wish to focus on the fabrication and characterization of Au disk electrodes scaling down to 5 nm in radii. Fig. 1 shows transmission electron microscopy (TEM) image of a 5 nm radius Au nanowire sealed in SiO2. These electrodes were fabricated by a laser-assisted pulling process with several key modifications in our laboratory, which include bilayer capillary and epoxy sealing after pulling. An electrical continuity tester is used to monitor the polishing process. The Au nanoelectrodes fabricated in this study have been utilized to measure the standard heterogeneous electron transfer (ET) rate constant, ko, for several redox species, including ferrocene (Fc), ferrocene methanol (FcH2OH), potassium ferricyanide (Fe(CN)63−), hexaammineruthenium(III)chloride (Ru(NH3)63+), in acetonitrile or aqueous solution. It has been found that the obtained values of ko in this method are similar to previous results reported by our and other groups.8,18,44–46 This Au nanoelectrode has also been used to investigate the direct electrochemistry of ferritin molecules and the amount of ∼3900 molecules or 6.1 zmol can be calculated from the voltammetric peak of ferritin on Au nanoelectrode (200 nm in radius).


image file: c5ra14777h-f1.tif
Fig. 1 TEM image of single Au nanoelectrode sealed in SiO2.

2. Experimental section

2.1. Chemicals

Ferrocene (Fc, Fluka), ferrocene methanol (FcCH2OH, Aldrich), hexaammineruthenium(III)chloride (Ru(NH3)6Cl3; Aldrich), potassium ferricyanide (K3Fe(CN)6; Acros Organics), tetra-n-butylammonium hexafluorophosphate (TBAPF6, Aldrich), potassium chloride (KCl, Shanghai Chemical Company, Shanghai, China), and acetonitrile (ACN, Shanghai Chemical Company, Shanghai, China), ferritin (from equine spleen, Sigma), cysteamine hydrochloride (Fluka) were of reagent grade quality or better and used without further purification. Aqueous and organic solutions were prepared from deionized water (Milli-Q, Millipore Co.) and acetonitrile, respectively.

Au microwires with a diameter of 25 μm (99.95%, hard) were purchased from Alfa Aesar. Borosilicate glass capillaries (o.d. = 1.0 mm; i.d. = 0.64 mm) were obtained from Sutter Instrument Co. A silver filled epoxy glue (DuPont) was used to contact the Au wire with a tungsten wire. Alumina polishing powders with different particle sizes of 1.0, 0.3, and 0.05 μm and fine grit sandpapers with 400, 600, and 800 grits were purchased from Buehler.

2.2. Transmission electron microscopy

TEM images of SiO2-coated Au nanoelectrodes were acquired on a Tecnai G2 F20 (FEI) microscope. No additional coatings were performed prior to imaging.

2.3. Nanoelectrode preparation

The Au disk nanoelectrodes were prepared utilizing a four-step process, which is similar to the fabrication process of Pt with some changes.5,32 The details of the fabrication procedure were provided in ESI. Briefly, a 25 μm Au wire was sealed into a 1 cm long piece of a silica capillary with an inner diameter of ∼80 μm and an outer diameter of ∼300 μm with the help of a stereo microscope. The small silica capillary/Au ensemble was then inserted into the center of a 7.5 cm long piece of a borosilicate glass capillary (o.d. = 1.0 mm; i.d. = 0.64 mm). The Au/bi-layer capillary assembly was sealed and then pulled into two ultra-sharp tips. The ultra-sharp was sealed with care into borosilicate glass tubing using epoxy, which was then polished with sandpaper to expose the Au nanodisk under the control of a homemade ultrasensitive continuity tester to ensure the polishing stops when the very end of Au is exposed.47,48 After that, the electrode was polished slightly by alumina polishing powders on a special cloth to make sure the surface is mirror-like.

2.4. Ferritin immobilized on Au surface

The Au nanoelectrode was modified with cysteamine by being immersed in an aqueous solution of cysteamine hydrochloride (10 mM) for 2 hour, and then washed by water.49 The cysteamine monolayer will electrostatically capture ferritin molecules (pI = 4–5)50 and also enhance the direct electron transfer reaction of ferritin.51,52 Au disk microelectrode modified with cysteamine was prepared in the same manner for control experiment.

2.5. Electrochemical measurements

Electrochemical measurements were carried out using a computer-controlled potentiostat (Dagan Chem-Clamp Voltammeter-Amperometer) and a biopotentiostat connected to a scanning electrochemical microscope (SECM, 900B mode, CH Instrument). A one-compartment, two-electrode cell was employed with the cell and preamplifier in a home-built Faraday cage. A Ag/AgCl electrode (Bioanalytical Sciences, Inc.) was used as the reference electrode. All electrochemical experiments were performed at room temperature (25 °C).

3. Results and discussion

3.1. TEM image of Au nanoelectrode

TEM is one of most popular methods to provide atomic resolution structural information of nanomaterials. Fig. 1 shows the TEM image of a Au nanowire tip prepared from a 25 μm microwire perform. The Au nanowire with the radius of ∼5 nm can be observed clearly, and the SiO2–Au wire surface of the electrode is smooth and no obvious gap can be found. One more TEM image with the radius of ∼18 nm is also provided in ESI (Fig. S1). From the energy dispersive X-ray spectroscopy (EDX) result (shown in Fig. S2), it could be obtained that Au nanoelectrode was fabricated successfully.

3.2. Key improvements of the fabrication procedure to obtain Au nanoelectrodes down to 5 nm

The details of the fabrication of Au nanoelectrodes were provided in experimental section and ESI. Because the melting point of gold (1064.18 °C) is lower than platinum (1773 °C), which makes it much difficult to pull the continuous Au ultra-sharp tips and nanoelectrodes. We have made the several revisions to get the Au nanoelectrodes within 5 nm. First, Au microwire was inserted to a small silica capillary with an inner diameter of ∼80 μm, which can improve the stability of the following sealing and pulling steps.5 Second, the programs designed to pull Au/bi-layer capillary assembly were changed compared to pull Pt/capillary assembly. For example, the parameter heat that control the output power of a laser was set lower for gold (560) than for platinum (820),5 but the parameter velocity was higher for gold (100) than for platinum (80). Third, it is necessary to seal the Au ultra-sharp tips into glass tube. Most of the nanoelectrodes were polished using a special beveler to expose the Pt/Au wire.16,18,53 However, extremely small size of the Au tip makes it hard to expose the Au by direct polishing on a surface without breaking the tip and it is hard to get the exposed Au tip within 10 nm. In our experiment, we sealed the Au ultra-sharp tip into a 2 mm borosilicate glass tube with epoxy. Finally, the sealed Au ultra-sharp tips were directly polished on fine sandpapers and aluminum oxide powers under the control of a homemade ultrasensitive continuity tester to ensure the polishing stops when the very end of Au is exposed.47,48

With above improvement, the fabrication process can be well-controlled, which resulting in >90% reproducibility in obtaining Au electrodes <5 nm in radii.

3.3. Voltammetric responses of Au nanoelectrodes

Fig. 2 shows the voltammetric responses of Au nanoelectrodes with different sizes in an ACN solution containing 5 mM Fc and 0.2 M TBAPF6 (A), a 1 mM FcCH2OH containing 0.1 M KCl (B), a 5 mM K3Fe(CN)6 containing 0.2 M KCl (C), and a 5 mM Ru(NH3)6Cl3 containing 0.2 M KCl (D). Assuming a disk-shaped geometry of the Au nanoelectrode embedded in an infinite large insulation material, the radius of the electrode can be calculated from the diffusion-limited steady-state current:54
 
id = 4nFDCba (1)
where n is the number of electrons transferred per molecule, F is Faraday's constant, D and Cb are the diffusion coefficient and bulk concentration of the redox molecule, respectively. The radius of the nanodisk electrode, a, is determined by measuring id for the oxidation Fc, FcCH2OH, Fe(CN)63− or Ru(NH3)63+. In agreement with theory and previous results of voltammetric response at nanodisk electrodes,30 all the voltammograms have an ideal sigmoidal shape and display no obvious hysteresis on the reverse scan, and the curve deviations are relatively small due to ohmic resistance or overlaying capacitance, even for the smallest electrodes with radii down to 3.8 nm, as shown in Fig. 2A, which is much smaller than the previous result prepared by laser-assisted pulling process.32,42 The EC diffusion process was simulated by COMSOL47,48 using 5 mM Fc ACN solution and 5 nm Au disk electrode in radius (Fig. S3). The calculated current value from COMSOL simulation is almost the same obtained from the CV experimental result (Fig. S4 and 5), indicating the prepared Au nanoelectrode is well-sealed and has good EC response.

image file: c5ra14777h-f2.tif
Fig. 2 Voltammetric responses of Au nanoelectrodes in a 5 mM Fc ACN solution containing 0.2 M TBAPF6 (A), 1 mM FcCH2OH containing 0.1 M KCl (B), 5 mM K3Fe(CN)6 containing 0.2 M KCl (C), and 5 mM Ru(NH3)6Cl3 containing 0.2 M KCl (D). Scan rate is 10 mV s−1.

However, Amemiya et al. recently found that damaged Pt nanoelectrodes could show perfect voltammetric responses.55 To investigate the surface property of Au nanodisc electrode, the voltammograms with different scan rates have been collected (Fig. S6). From Fig. S6, it can be seen that both the curves are retraceable and well-shaped, with a flat plateau and negligibly small background current. Although the capacitive contribution is more significant at higher scan rate (2.0 V s−1, red curve in Fig. S6), the overall shape of both voltammograms is steady-state, indicating no solution-filled cavity existed at the surface of the nanodisc surface.

3.4. Cyclic voltammetry of Au nanoelectrodes in H2SO4

The cyclic voltammetry (CV) in H2SO4 solution is often used as a finger-print method for the characterization of different metal electrodes, especially for Pt and Au electrodes based on their characteristic voltammograms for the formation of surface oxides and their subsequent reduction processes in acid electrolytes.12,42 After successful fabrication of Au disk nanoelectrodes, the cyclic voltammograms using Au nanoelectrodes with different radii were recorded in 0.5 M H2SO4 solution, and the results were provided in Fig. 3. Fig. 3 shows the cyclic voltammograms of three Au nanoelectrodes with a radius of (a) 12.2 nm, (b) 28.6 nm, and (c) 32.3 nm, at a scan rate of 50 mV s−1. As it can be found, all of the Au nanoelectrodes show typically characteristic voltammograms: during the forward sweep, the current increases at ∼1.2 V vs. Ag/AgCl corresponding to the formation of Au surface oxide; during the backward sweep, a reduction peak appears at ∼0.95 V vs. Ag/AgCl corresponding to the reduction of Au oxide. Interestingly it can be observed that the peak potential of the reduction peak has a slightly shift towards negative direction for smaller Au nanoelectrodes, which was also reported by Zhang et al.42 and Zamborini et al.56 This size-dependent potential shift may be due to a change in the standard redox potential of Au and Au oxide.
image file: c5ra14777h-f3.tif
Fig. 3 The cyclic voltammograms in 0.5 M H2SO4 of three Au nanoelectrodes with the radii of (a) 12.2 nm, (b) 28.6 nm, and (c) 32.3 nm. Scan rate: 50 mV s−1.

3.5. Electron-transfer rate constant measured at Au nanoelectrodes

It is well-known that the measurement of ko requires that the rate of mass transfer of the molecule to the electrode surface be comparable to or greater than the rate of electron transfer.8 For steady-state voltammetry at a hemispherical or disk electrode involving purely diffusional transport, this condition can be expressed as57,58
 
(D/koa) ≥ 0.1 (2)

Generally, values of ko between 1 and 100 cm s−1 can be measured using electrodes with a between 100 and 1 nm, assuming a typical value of D (∼10−5 cm2 s−1). Therefore, it is appropriate to measure the ET rate constants for the oxidation of Fc, FcCH2OH, Fe(CN)63−, and Ru(NH3)63+ using the Au nanoelectrodes prepared in this work.

Herein, steady-state voltammetric responses of Au nanoelectrodes were employed to measure the standard heterogeneous ET rate constant, ko, for Fc, FcCH2OH, Fe(CN)63−, and Ru(NH3)63+, respectively. The voltammetric responses of Au nanoelectrodes are shown in Fig. 4A, B, C and D for Fc, FcCH2OH, Fe(CN)63−, and Ru(NH3)63+, respectively. Then the voltammetric current of each redox species is normalized to its diffusion-controlled limiting current based on the oxidation wave, id, to better display the relationship between voltammetric response and the radius of the nanoelectrode, and the normalized currents are shown in Fig. S7A–D. From the normalized voltammograms of each redox species with different radii shown in Fig. S7, it can be easily obtained that the voltammetric half-wave potential, E1/2, shifts towards more positive potentials as the decreases of radii, which is similar to previous results.8


image file: c5ra14777h-f4.tif
Fig. 4 Voltammetric responses of Au nanoelectrodes in a 5 mM Fc ACN solution containing 0.1 M TBAPF6 (A), 1 mM FcCH2OH containing 0.1 M KCl (B), 5 mM K3Fe(CN)6 containing 0.2 M KCl (C), and 5 mM Ru(NH3)6Cl3 containing 0.2 M KCl (D). Scan rate is 10 mV s−1.

Assuming the voltammetric results shown in Fig. 4 and S7 are fit to classical Butler–Volmer electrode kinetics, the iE relationship for the oxidation of Fc, FcCH2OH, Fe(CN)63−, and Ru(NH3)63+ can be written as57

 
image file: c5ra14777h-t1.tif(3)
where A is known generally as the frequency factor, Eo′ is formal potential of an electrode, α is the transfer coefficient, T is absolute temperature, and other parameters have been previously defined. According to the method developed by Mirkin and Bard,59 the values of ko and α can be calculated based on the measurement of experimental parameters (E1/4E1/2) and (E1/2E3/4) in Fig. 4 and S7, where E1/4 and E3/4 are the quartile potentials, corresponding to the electrode potentials where the current is equal to 1/4 and 3/4 of the limiting value, respectively. Values of ko and α for the oxidation of Fc, FcCH2OH, Fe(CN)63−, and Ru(NH3)63+, determined by this method for different size nanoelectrodes, with radii ranging from 0.6 to 183.6 nm, are listed in Tables S1, S2, S3 and S4, respectively. So the average values of ko and α for the oxidation of Fc, FcCH2OH, Fe(CN)63−, and Ru(NH3)63+ can be obtained as ko = 7.9 ± 3.6 cm s−1 and α = 0.41 ± 0.04 for Fc, ko = 7.4 ± 7.1 cm s−1 and α = 0.41 ± 0.23 for FcCH2OH, ko = 4.0 ± 3.6 cm s−1 and α = 0.52 ± 0.17 for Fe(CN)63−, and ko = 7.2 ± 6.9 cm s−1 and α = 0.53 ± 0.22 for Ru(NH3)63+, respectively. Our measured results for ko and α are reasonable as compared to values previously reported by other groups.8,44–46 However, it must be pointed out that the mean rate constant value at Au surface (ko = 7.2 ± 6.9 cm s−1) in this work is lower than that measured at Au tips using SECM method (ko = 13.5 ± 2.0 cm s−1),32 which is different from the results of Iwasita et al.60 We think it may be due to the different supporting electrolyte because the kinetics of Ru(NH3)63+ reduction strongly depends on the nature of the supporting electrolyte, and the ko value greatly increases in a high concentration of chloride. Finally it should be pointed out that the method developed by Mirkin and Bard59 is only used to the condition that the experimental voltammograms is fit the theoretical value exactly. Unfortunately it is hard to get these accurate values because the experimental conditions are always affected by different issues such as temperature, ion strength, concentration, etc. The values of the parameters calculated here are just used to estimate the ET constants got from the nanoelectrodes with different radii.

3.6. CVs of ferritin adsorbed on Au nanoelectrode

It is well-known that Au electrode is one of the easiest surfaces to be modified due to the strong Au–S bond and can be used to investigate the redox response of very few molecules.42 Watkins et al. have carefully investigated the redox response of bis(2,2′-bipyridine)chloro(4,4′-trimethylenedipyridine)osmium(II) molecules adsorbed on a Pt nanoelectrode.8 Zhang et al.42 and Hoeben et al.25 have reported the redox responses of 2.3 × 10⁶ ferrocene molecules and less than 50 [NiFe]-hydrogenase proteins on Au nanoelectrodes, respectively. Herein ferritin molecules were immobilized on the surface of Au nanoelectrodes and their redox responses were investigated. Fig. 5a shows CVs of Au nanoelectrode after immersion in 5 mg mL−1 ferritin solution for 2 hours. It can be a cathodic peak ∼−0.34 V and an anodic peak ∼−0.19 V were observed in the first cycle, which were originated from the direct electron transfer reaction of ferritin immobilized on the Au surface.51,61–64 In the subsequent cycles, the cathodic peak shifted to more positive potential (−0.30 V), probably reflecting the reconstruction of the ferritin layer on Au surface, which was reported previously when ferritin adsorbed onto tin-doped indium oxide electrodes and nanopore recessed Au electrode.52,62 Moreover, the cathodic current gradually decreased probably due to the release of Fe(II) from the ferritin molecules.51,52,62,63 A similar shift in cathodic potential and a gradual decrease in the charge were observed on cysteamine-modified gold substrates with micro-size (25 μm, Fig. 5b). The number of ferritin molecules adsorbed on the Au surface can be calculated based on the following equation8,42
 
Γ* = Q/nFA (4)
where Γ* is the surface coverage of ferritin, Q is the charge associated with the voltammetric peak, n is the number of electrons transferred per redox molecules (n is ∼4500 for ferritin52,65), F is the Faraday's constant, and A is the area of the Au electrode, respectively. The total number of the electrons transferred has been integrated to be 2.8 × 10⁻¹² C, which corresponds to ∼3900 molecules or ∼6.1 zmol. Assuming the planar cysteamine-modified gold surface was completely covered with ferritin upon (i.e., 8 × 10³ molecules per μm2),51,52 the radius of the Au nanoelectrode can be calculated to be 393 nm, which is much bigger than the value calculated from eqn (1) by small redox species. Considering the similar radii of Au microelectrode calculated from eqn (4) and (1) (14.8 μm calculated from eqn (4) vs. 12.5 μm calculated from eqn (1)), it can be obtained that the surface roughness factor of Au nanoelectrode (∼1.96) is much bigger than that from Au micro/macro electrodes (∼1.18).

image file: c5ra14777h-f5.tif
Fig. 5 Multiple potential cycles for ferritin immobilized on a gold nanoelectrode with a radius of 200 nm (a) and a gold microelectrode with a radius of 12.5 μm (b). CVs (scan rate, 100 mV s−1) were measured in a 0.1 M KH2PO4–K2HPO4 buffer at pH 7.0. The gold electrodes were modified with cysteamine by immersion in an aqueous solution of cysteamine hydrochloride (10 mM) for 2 h, followed by rinsing with water.

Based on the relationship between peak voltammetric current and the scan rate given as follows,58 it can be obtained that increasing scan rate will be helpful to get large peak current. Because this result was obtained at a slow scan rate (100 mV s−1) on a relatively large Au nanoelectrode (radius: 200 nm), we believe that more improvement can be investigated to get the voltammetric response from much less redox molecules.

 
ip = (n2F2/4RT)vAΓ* (5)

4. Conclusions

Au disk nanoelectrodes with the radii down to 5 nm have been prepared through improved laser-assisted pulling technique, which have been characterized by TEM and voltammetry in small redox species and H2SO4 solution. These Au disk nanoelectrodes have been employed to measure the rapid heterogeneous ET rate constant of four different redox species, and the results are in good agreement with the values reported previously. From the voltammetric peak of ferritin on Au nanoelectrode (200 nm in radius), the amount of ∼3900 molecules or 6.1 zmol can be calculated. The results from the direct electrochemistry of ferritin immobilized on Au disk nanoelectrodes demonstrate the ability of electrode at nanoscale to detect zeptomole quantities of an electroactive species, indicating that the Au disk nanoelectrodes can be applied in many interesting studies, such as single molecule/nanoparticle detection, bioanalysis, electrocatalytic effects of novel materials at the nanoscale.

Acknowledgements

We thank Prof. Bo Zhang (University of Washington) for his useful suggestion and discussion. This work is financially supported by the National Natural Science Foundation of China (No. 20975002), the Key Project of Chinese Ministry of Education (No. 212083) and Anhui Normal University.

References

  1. R. W. Murray, Chem. Rev., 2008, 108, 2688–2720 CrossRef CAS PubMed.
  2. J. Abbou, C. Demaille, M. Druet and J. Moiroux, Anal. Chem., 2002, 74, 6355–6363 CrossRef CAS.
  3. R. M. Penner, M. J. Heben, T. L. Longin and N. S. Lewis, Science, 1990, 250, 1118–1121 CAS.
  4. J. T. Cox and B. Zhang, Annu. Rev. Anal. Chem., 2012, 5, 253–272 CrossRef CAS PubMed.
  5. Y. X. Li, D. Bergman and B. Zhang, Anal. Chem., 2009, 81, 5496–5502 CrossRef CAS PubMed.
  6. D. W. M. Arrigan, Analyst, 2004, 129, 1157–1165 RSC.
  7. J. Velmurugan, J. M. Noel and M. V. Mirkin, Chem. Sci., 2014, 5, 189–194 RSC.
  8. J. J. Watkins, J. Y. Chen, H. S. White, H. D. Abruna, E. Maisonhaute and C. Amatore, Anal. Chem., 2003, 75, 3962–3971 CrossRef CAS.
  9. B. Zhang, L. X. Fan, H. W. Zhong, Y. W. Liu and S. L. Chen, J. Am. Chem. Soc., 2013, 135, 10073–10080 CrossRef CAS PubMed.
  10. P. Sun, Z. Liu, H. Yu and M. V. Mirkin, Langmuir, 2008, 24, 9941–9944 CrossRef CAS PubMed.
  11. P. Sun, Z. Q. Zhang, J. D. Guo and Y. H. Shao, Anal. Chem., 2001, 73, 5346–5351 CrossRef CAS.
  12. Y. X. Li, J. T. Cox and B. Zhang, J. Am. Chem. Soc., 2010, 132, 3047–3054 CrossRef CAS PubMed.
  13. J. Lakbub, A. Pouliwe, A. Kamasah, C. Yang and P. Sun, Electroanalysis, 2011, 23, 2270–2274 CrossRef CAS PubMed.
  14. P. Sun, F. Li, C. Yang, T. Sun, I. Kady, B. Hunt and J. Zhuang, J. Phys. Chem. C, 2013, 117, 6120–6125 CAS.
  15. M. V. Mirkin, W. Nogala, J. Velmurugan and Y. X. Wang, Phys. Chem. Chem. Phys., 2011, 13, 21196–21212 RSC.
  16. B. B. Katemann and T. Schuhmann, Electroanalysis, 2002, 14, 22–28 CrossRef CAS.
  17. B. B. Katemann, A. Schulte and W. Schuhmann, Electroanalysis, 2004, 16, 60–65 CrossRef CAS PubMed.
  18. P. Sun and M. V. Mirkin, Anal. Chem., 2006, 78, 6526–6534 CrossRef CAS PubMed.
  19. M. Etienne, E. C. Anderson, S. R. Evans, W. Schuhmann and I. Fritsch, Anal. Chem., 2006, 78, 7317–7324 CrossRef CAS PubMed.
  20. M. V. Mirkin, L. O. S. Bulhoes and A. J. Bard, J. Am. Chem. Soc., 1993, 115, 201–204 CrossRef CAS.
  21. Y. Wang, K. Kececi, J. Velmurugan and M. V. Mirkin, Chem. Sci., 2013, 4, 3606–3616 RSC.
  22. W. Nogala, J. Velmurugan and M. V. Mirkin, Anal. Chem., 2012, 84, 5192–5197 CrossRef CAS PubMed.
  23. A. G. Ewing, D. Omiatek, L. Mellander, Y. Dong, M. Heien and B. Zhang, Abstracts of Papers of the American Chemical Society, 2011, p. 241 Search PubMed.
  24. Y. X. Wang, J. M. Noel, J. Velmurugan, W. Nogala, M. V. Mirkin, C. Lu, M. G. Collignon, F. Lemaitre and C. Amatore, Proc. Natl. Acad. Sci. U. S. A., 2012, 109, 11534–11539 CrossRef CAS PubMed.
  25. F. J. M. Hoeben, F. S. Meijer, C. Dekker, S. P. J. Albracht, H. A. Heering and S. G. Lemay, ACS Nano, 2008, 2, 2497–2504 CrossRef CAS PubMed.
  26. P. Sun, F. O. Laforge, T. P. Abeyweera, S. A. Rotenberg, J. Carpino and M. V. Mirkin, Proc. Natl. Acad. Sci. U. S. A., 2008, 105, 443–448 CrossRef CAS PubMed.
  27. B. Zhang, J. Galusha, P. G. Shiozawa, G. Wang, A. J. Bergren, R. M. Jones, R. J. White, E. N. Ervin, C. C. Cauley and H. S. White, Anal. Chem., 2007, 79, 4778–4787 CrossRef CAS PubMed.
  28. J. Velmurugan, J.-M. Noel and M. V. Mirkin, Chem. Sci., 2014, 5, 189–194 RSC.
  29. J. Velmurugan, J.-M. Noel, W. Nogala and M. V. Mirkin, Chem. Sci., 2012, 3, 3307–3314 RSC.
  30. Y. H. Shao, M. V. Mirkin, G. Fish, S. Kokotov, D. Palanker and A. Lewis, Anal. Chem., 1997, 69, 1627–1634 CrossRef CAS.
  31. J. Velmurugan and M. V. Mirkin, Chemphyschem, 2010, 11, 3011–3017 CrossRef CAS PubMed.
  32. J. Velmurugan, P. Sun and M. V. Mirkin, J. Phys. Chem. C, 2009, 113, 459–464 CAS.
  33. D. Zhan, J. Velmurugan and M. V. Mirkin, J. Am. Chem. Soc., 2009, 131, 14756–14760 CrossRef CAS PubMed.
  34. Y. X. Wang, K. Kececi, J. Velmurugan and M. V. Mirkin, Chem. Sci., 2013, 4, 3606–3616 RSC.
  35. J.-M. Noel, Y. Yu and M. V. Mirkin, Langmuir, 2013, 29, 1346–1350 CrossRef CAS PubMed.
  36. Y. Wang, J.-M. Noel, J. Velmurugan, W. Nogala, M. V. Mirkin, C. Lu, M. G. Collignon, F. Lemaitre and C. Amatore, Proc. Natl. Acad. Sci. U. S. A., 2012, 109, 11534–11539 CrossRef CAS PubMed.
  37. C. Yang and P. Sun, Anal. Chem., 2009, 81, 7496–7500 CrossRef CAS PubMed.
  38. Y. X. Li, Q. Q. Wu, S. F. Jiao, C. D. Xu and L. Wang, Anal. Chem., 2013, 85, 4135–4140 CrossRef CAS PubMed.
  39. H. Lin, H. Cheng, L. Liu, Z. Zhu, Y. Shao, P. Papakonstantinou, D. Mihailovic and M. Li, Biosens. Bioelectron., 2011, 26, 1866–1870 CrossRef CAS PubMed.
  40. T. d. F. Paulo, I. C. N. Diogenes and H. D. Abruna, Langmuir, 2011, 27, 2052–2057 CrossRef CAS PubMed.
  41. K. Dawson, A. Wahl, R. Murphy and A. O'Riordan, J. Phys. Chem. C, 2012, 116, 14665–14673 CAS.
  42. B. K. Jena, S. J. Percival and B. Zhang, Anal. Chem., 2010, 82, 6737–6743 CrossRef CAS PubMed.
  43. Y. Liu, M. Li, F. Zhang, A. Zhu and G. Shi, Anal. Chem., 2015, 87, 5531–5538 CrossRef CAS PubMed.
  44. D. O. Wipf, E. W. Kristensen, M. R. Deakin and R. M. Wightman, Anal. Chem., 1988, 60, 306–310 CrossRef CAS.
  45. J. J. Watkins and H. S. White, Langmuir, 2004, 20, 5474–5483 CrossRef CAS.
  46. M. V. Mirkin, T. C. Richards and A. J. Bard, J. Phys. Chem., 1993, 97, 7672–7677 CrossRef CAS.
  47. B. Zhang, Y. Zhang and H. S. White, Anal. Chem., 2004, 76, 6229 CrossRef CAS PubMed.
  48. B. Zhang, Y. Zhang and H. S. White, Anal. Chem., 2006, 78, 477 CrossRef CAS PubMed.
  49. C. R. Raj and T. Ohsaka, Electroanalysis, 2002, 14, 679–684 CrossRef CAS.
  50. E. C. Thiel, Annu. Rev. Biochem., 1987, 56, 289–315 CrossRef PubMed.
  51. M. Tominaga, A. Ohira, Y. Yamaguchi and M. Kunitake, J. Electroanal. Chem., 2004, 566, 323–329 CrossRef CAS PubMed.
  52. Y. X. Li and T. Ito, Anal. Chem., 2009, 81, 851–855 CrossRef CAS PubMed.
  53. S. E. Salamifar and R. Y. Lai, Anal. Chem., 2014, 86, 2849–2852 CrossRef CAS PubMed.
  54. Y. Saito, Rev. Polarogr., 1968, 15, 177–187 CrossRef CAS.
  55. N. Nioradze, R. Chen, J. Kim, M. Shen, P. Santhosh and S. Amemiya, Anal. Chem., 2013, 85, 6198–6202 CrossRef CAS PubMed.
  56. O. S. Ivanova and F. P. Zamborini, J. Am. Chem. Soc., 2010, 132, 70–72 CrossRef CAS PubMed.
  57. C. G. Zoski, in Modern Techniques in Electroanalysis, Wiley, New York, 1996 Search PubMed.
  58. A. J. Bard and L. R. Faulkner, Electrochemical Methods, 2nd edn, John Wiley & Sons, New York, 2001 Search PubMed.
  59. M. V. Mirkin and A. J. Bard, Anal. Chem., 1992, 64, 2293–2303 CrossRef CAS.
  60. T. Iwasita, W. Schmickler and J. W. Schultze, Phys. Chem. Chem. Phys., 1985, 89, 138–142 CAS.
  61. T. D. Martin, S. A. Monheit, R. J. Niichel, S. C. Peterson, C. H. Campbell and D. C. Zapien, J. Electroanal. Chem., 1997, 420, 279–290 CrossRef CAS.
  62. R. J. Cherry, A. J. Bjornsen and D. C. Zapien, Langmuir, 1998, 14, 1971–1973 CrossRef CAS.
  63. M.-S. Pyon, R. J. Cherry, A. J. Bjornsen and D. C. Zapien, Langmuir, 1999, 15, 7040–7046 CrossRef CAS.
  64. D. C. Zapien and M. A. Johnson, J. Electroanal. Chem., 2000, 494, 114–120 CrossRef CAS.
  65. A. Mohammadi, A. B. Moghaddam and J. Badraghi, Anal. Chem., 2012, 4, 1024–1028 CAS.

Footnote

Electronic supplementary information (ESI) available. See DOI: 10.1039/c5ra14777h

This journal is © The Royal Society of Chemistry 2015
Click here to see how this site uses Cookies. View our privacy policy here.